Cities with the Lowest Poverty Level Among Single Fathers in Washington
RELATED REPORTS & OPTIONS
Lowest Poverty | Single Father
Washington
Compare Cities
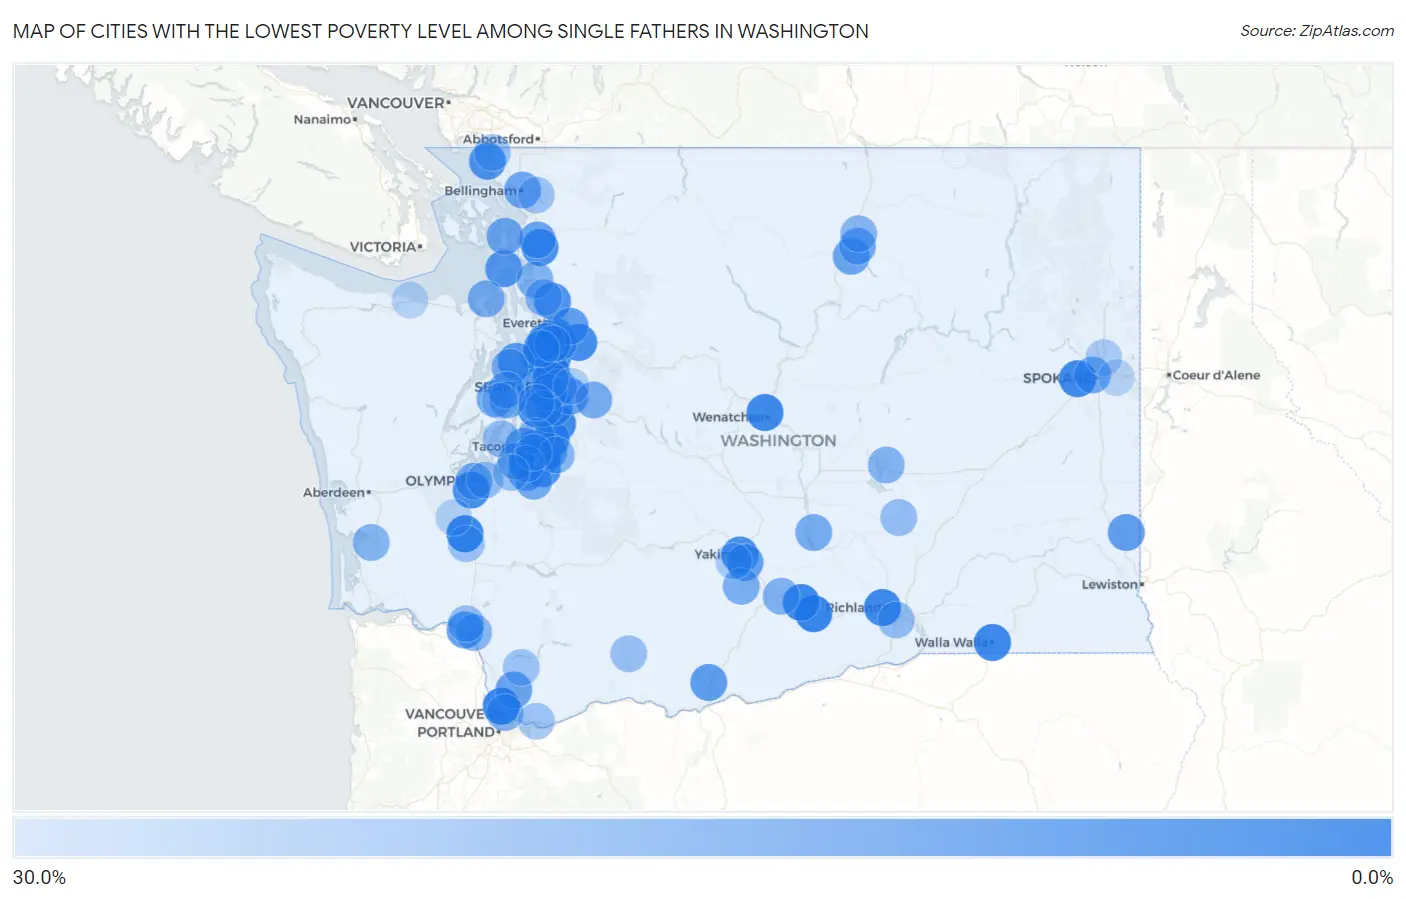
Map of Cities with the Lowest Poverty Level Among Single Fathers in Washington
30.0%
0.0%
Cities with the Lowest Poverty Level Among Single Fathers in Washington
| City | Single Father Poverty | vs State | vs National | |
| 1. | Hazel Dell | 0.95% | 10.6%(-9.61)#1 | 13.7%(-12.8)#17 |
| 2. | Grandview | 1.1% | 10.6%(-9.46)#2 | 13.7%(-12.6)#21 |
| 3. | Centralia | 1.4% | 10.6%(-9.17)#3 | 13.7%(-12.3)#36 |
| 4. | Walla Walla | 2.0% | 10.6%(-8.56)#4 | 13.7%(-11.7)#84 |
| 5. | Sunnyside | 2.0% | 10.6%(-8.55)#5 | 13.7%(-11.7)#86 |
| 6. | Kent | 2.0% | 10.6%(-8.52)#6 | 13.7%(-11.7)#88 |
| 7. | Richland | 2.2% | 10.6%(-8.39)#7 | 13.7%(-11.5)#102 |
| 8. | Wenatchee | 2.3% | 10.6%(-8.22)#8 | 13.7%(-11.4)#116 |
| 9. | Airway Heights | 2.5% | 10.6%(-8.04)#9 | 13.7%(-11.2)#135 |
| 10. | Burien | 3.1% | 10.6%(-7.48)#10 | 13.7%(-10.6)#200 |
| 11. | Bothell | 3.7% | 10.6%(-6.83)#11 | 13.7%(-9.99)#274 |
| 12. | Monroe | 3.8% | 10.6%(-6.75)#12 | 13.7%(-9.90)#285 |
| 13. | Tumwater | 4.0% | 10.6%(-6.51)#13 | 13.7%(-9.66)#307 |
| 14. | Kenmore | 4.4% | 10.6%(-6.14)#14 | 13.7%(-9.29)#361 |
| 15. | Mount Vernon | 4.5% | 10.6%(-6.06)#15 | 13.7%(-9.21)#373 |
| 16. | Yakima | 4.5% | 10.6%(-6.02)#16 | 13.7%(-9.18)#377 |
| 17. | North Lynnwood | 4.5% | 10.6%(-6.01)#17 | 13.7%(-9.17)#378 |
| 18. | Eastmont | 4.7% | 10.6%(-5.89)#18 | 13.7%(-9.05)#397 |
| 19. | South Hill | 4.9% | 10.6%(-5.61)#19 | 13.7%(-8.76)#435 |
| 20. | Marysville | 5.4% | 10.6%(-5.19)#20 | 13.7%(-8.35)#481 |
| 21. | Auburn | 5.5% | 10.6%(-5.05)#21 | 13.7%(-8.21)#504 |
| 22. | Birch Bay | 5.6% | 10.6%(-4.97)#22 | 13.7%(-8.13)#524 |
| 23. | Renton | 6.1% | 10.6%(-4.47)#23 | 13.7%(-7.63)#582 |
| 24. | Fairwood Cdp King County | 6.2% | 10.6%(-4.40)#24 | 13.7%(-7.56)#593 |
| 25. | Oak Harbor | 6.3% | 10.6%(-4.23)#25 | 13.7%(-7.38)#620 |
| 26. | Kirkland | 7.0% | 10.6%(-3.58)#26 | 13.7%(-6.73)#714 |
| 27. | Midland | 7.3% | 10.6%(-3.27)#27 | 13.7%(-6.42)#767 |
| 28. | Mountlake Terrace | 7.3% | 10.6%(-3.26)#28 | 13.7%(-6.41)#769 |
| 29. | Silver Firs | 7.6% | 10.6%(-2.94)#29 | 13.7%(-6.09)#824 |
| 30. | Indianola | 7.7% | 10.6%(-2.87)#30 | 13.7%(-6.02)#840 |
| 31. | Seattle | 8.3% | 10.6%(-2.30)#31 | 13.7%(-5.45)#943 |
| 32. | Fife | 8.3% | 10.6%(-2.23)#32 | 13.7%(-5.38)#948 |
| 33. | Longview | 8.5% | 10.6%(-2.08)#33 | 13.7%(-5.23)#972 |
| 34. | Goldendale | 8.6% | 10.6%(-1.96)#34 | 13.7%(-5.11)#1,001 |
| 35. | Puyallup | 8.8% | 10.6%(-1.80)#35 | 13.7%(-4.95)#1,027 |
| 36. | Everett | 8.9% | 10.6%(-1.67)#36 | 13.7%(-4.82)#1,047 |
| 37. | Pullman | 8.9% | 10.6%(-1.62)#37 | 13.7%(-4.77)#1,059 |
| 38. | Union Gap | 9.2% | 10.6%(-1.37)#38 | 13.7%(-4.52)#1,098 |
| 39. | Issaquah | 9.7% | 10.6%(-0.831)#39 | 13.7%(-3.98)#1,176 |
| 40. | Battle Ground | 10.6% | 10.6%(+0.080)#40 | 13.7%(-3.07)#1,326 |
| 41. | Spanaway | 10.7% | 10.6%(+0.156)#41 | 13.7%(-3.00)#1,338 |
| 42. | Burlington | 10.9% | 10.6%(+0.361)#42 | 13.7%(-2.79)#1,372 |
| 43. | Lake Stickney | 11.0% | 10.6%(+0.412)#43 | 13.7%(-2.74)#1,380 |
| 44. | Sumner | 11.1% | 10.6%(+0.553)#44 | 13.7%(-2.60)#1,403 |
| 45. | Okanogan | 11.1% | 10.6%(+0.553)#45 | 13.7%(-2.60)#1,407 |
| 46. | Tacoma | 11.1% | 10.6%(+0.557)#46 | 13.7%(-2.60)#1,429 |
| 47. | Suquamish | 11.8% | 10.6%(+1.21)#47 | 13.7%(-1.95)#1,493 |
| 48. | Anacortes | 11.8% | 10.6%(+1.26)#48 | 13.7%(-1.89)#1,508 |
| 49. | Omak | 12.0% | 10.6%(+1.44)#49 | 13.7%(-1.71)#1,535 |
| 50. | Bellingham | 12.2% | 10.6%(+1.61)#50 | 13.7%(-1.54)#1,562 |
| 51. | Bellevue | 12.4% | 10.6%(+1.85)#51 | 13.7%(-1.31)#1,600 |
| 52. | Bremerton | 12.6% | 10.6%(+2.07)#52 | 13.7%(-1.09)#1,652 |
| 53. | Spokane | 12.6% | 10.6%(+2.07)#53 | 13.7%(-1.08)#1,653 |
| 54. | Elk Plain | 13.0% | 10.6%(+2.42)#54 | 13.7%(-0.732)#1,695 |
| 55. | Olympia | 13.2% | 10.6%(+2.60)#55 | 13.7%(-0.558)#1,722 |
| 56. | Mattawa | 13.3% | 10.6%(+2.77)#56 | 13.7%(-0.379)#1,754 |
| 57. | Snoqualmie | 13.6% | 10.6%(+3.08)#57 | 13.7%(-0.076)#1,797 |
| 58. | Parkwood | 13.6% | 10.6%(+3.08)#58 | 13.7%(-0.076)#1,800 |
| 59. | Port Townsend | 13.7% | 10.6%(+3.17)#59 | 13.7%(+0.013)#1,824 |
| 60. | Lakewood | 13.8% | 10.6%(+3.27)#60 | 13.7%(+0.114)#1,837 |
| 61. | Mercer Island | 14.3% | 10.6%(+3.73)#61 | 13.7%(+0.573)#1,894 |
| 62. | Mill Creek | 14.3% | 10.6%(+3.73)#62 | 13.7%(+0.573)#1,895 |
| 63. | Harrah | 14.3% | 10.6%(+3.73)#63 | 13.7%(+0.573)#1,920 |
| 64. | Vancouver | 14.3% | 10.6%(+3.73)#64 | 13.7%(+0.580)#1,932 |
| 65. | Enetai | 14.8% | 10.6%(+4.26)#65 | 13.7%(+1.10)#1,993 |
| 66. | Granger | 15.0% | 10.6%(+4.44)#66 | 13.7%(+1.29)#2,012 |
| 67. | Stanwood | 16.0% | 10.6%(+5.41)#67 | 13.7%(+2.26)#2,151 |
| 68. | Moses Lake | 16.1% | 10.6%(+5.52)#68 | 13.7%(+2.36)#2,164 |
| 69. | Tukwila | 16.4% | 10.6%(+5.84)#69 | 13.7%(+2.69)#2,202 |
| 70. | South Bend | 16.5% | 10.6%(+5.90)#70 | 13.7%(+2.74)#2,207 |
| 71. | Riverside | 16.7% | 10.6%(+6.11)#71 | 13.7%(+2.95)#2,283 |
| 72. | Kelso | 16.8% | 10.6%(+6.23)#72 | 13.7%(+3.08)#2,302 |
| 73. | Lake Goodwin | 16.9% | 10.6%(+6.36)#73 | 13.7%(+3.21)#2,317 |
| 74. | Kitsap Lake | 17.0% | 10.6%(+6.46)#74 | 13.7%(+3.31)#2,330 |
| 75. | Federal Way | 17.1% | 10.6%(+6.51)#75 | 13.7%(+3.36)#2,332 |
| 76. | Bonney Lake | 17.3% | 10.6%(+6.78)#76 | 13.7%(+3.63)#2,356 |
| 77. | Yarrow Point | 18.2% | 10.6%(+7.62)#77 | 13.7%(+4.47)#2,468 |
| 78. | Kennewick | 18.7% | 10.6%(+8.09)#78 | 13.7%(+4.94)#2,532 |
| 79. | Artondale | 18.7% | 10.6%(+8.11)#79 | 13.7%(+4.95)#2,535 |
| 80. | Longview Heights | 19.2% | 10.6%(+8.63)#80 | 13.7%(+5.48)#2,604 |
| 81. | Othello | 19.3% | 10.6%(+8.74)#81 | 13.7%(+5.59)#2,617 |
| 82. | Lacey | 19.6% | 10.6%(+9.06)#82 | 13.7%(+5.91)#2,658 |
| 83. | Trout Lake | 20.0% | 10.6%(+9.44)#83 | 13.7%(+6.29)#2,735 |
| 84. | Parkland | 20.3% | 10.6%(+9.70)#84 | 13.7%(+6.55)#2,777 |
| 85. | Waller | 20.3% | 10.6%(+9.76)#85 | 13.7%(+6.61)#2,781 |
| 86. | Blaine | 20.3% | 10.6%(+9.78)#86 | 13.7%(+6.63)#2,784 |
| 87. | Lynnwood | 20.6% | 10.6%(+10.0)#87 | 13.7%(+6.86)#2,805 |
| 88. | Chehalis | 20.6% | 10.6%(+10.0)#88 | 13.7%(+6.88)#2,808 |
| 89. | Fort Lewis | 20.7% | 10.6%(+10.1)#89 | 13.7%(+6.94)#2,815 |
| 90. | Amboy | 20.7% | 10.6%(+10.1)#90 | 13.7%(+6.98)#2,819 |
| 91. | Sudden Valley | 20.8% | 10.6%(+10.2)#91 | 13.7%(+7.08)#2,835 |
| 92. | Washougal | 20.9% | 10.6%(+10.3)#92 | 13.7%(+7.15)#2,848 |
| 93. | White Center | 21.5% | 10.6%(+11.0)#93 | 13.7%(+7.80)#2,926 |
| 94. | Ahtanum | 23.0% | 10.6%(+12.4)#94 | 13.7%(+9.24)#3,087 |
| 95. | Mead | 23.3% | 10.6%(+12.7)#95 | 13.7%(+9.60)#3,132 |
| 96. | Rochester | 24.6% | 10.6%(+14.0)#96 | 13.7%(+10.9)#3,242 |
| 97. | Sammamish | 24.6% | 10.6%(+14.1)#97 | 13.7%(+10.9)#3,244 |
| 98. | Port Angeles | 25.5% | 10.6%(+14.9)#98 | 13.7%(+11.7)#3,361 |
| 99. | Port Orchard | 25.5% | 10.6%(+14.9)#99 | 13.7%(+11.8)#3,366 |
| 100. | Spokane Valley | 25.9% | 10.6%(+15.3)#100 | 13.7%(+12.2)#3,389 |
Common Questions
What are the Top 10 Cities with the Lowest Poverty Level Among Single Fathers in Washington?
Top 10 Cities with the Lowest Poverty Level Among Single Fathers in Washington are:
#1
0.95%
#2
1.1%
#3
1.4%
#4
2.0%
#5
2.0%
#6
2.0%
#7
2.2%
#8
2.3%
#9
2.5%
#10
3.1%
What city has the Lowest Poverty Level Among Single Fathers in Washington?
Hazel Dell has the Lowest Poverty Level Among Single Fathers in Washington with 0.95%.
What is the Poverty Level Among Single Fathers in the State of Washington?
Poverty Level Among Single Fathers in Washington is 10.6%.
What is the Poverty Level Among Single Fathers in the United States?
Poverty Level Among Single Fathers in the United States is 13.7%.