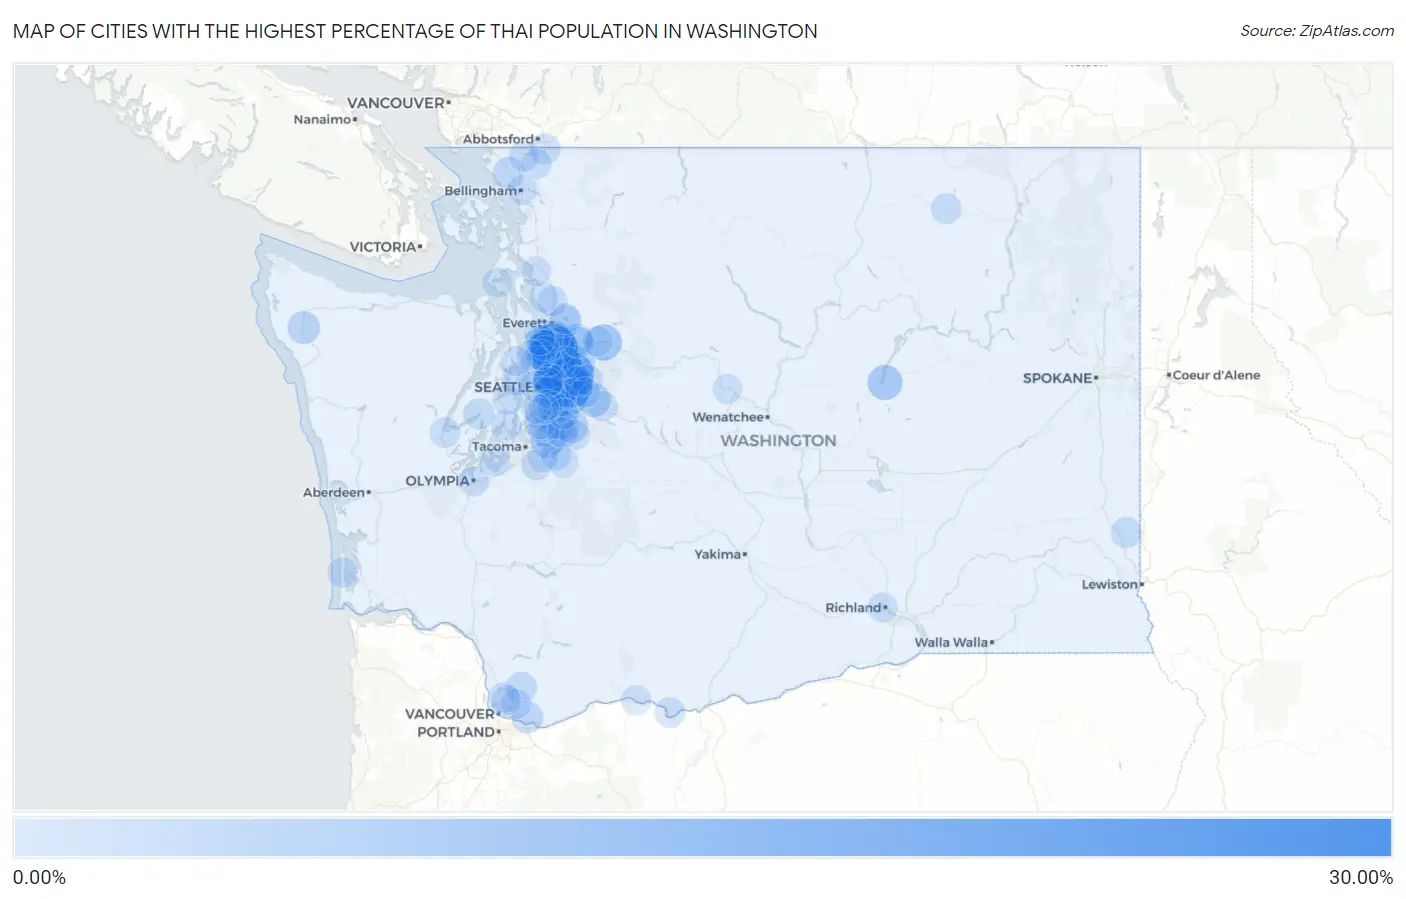
Cities with the Highest Percentage of Thai Population in Washington
RELATED REPORTS & OPTIONS
Thai
Washington
Compare Cities
Map of Cities with the Highest Percentage of Thai Population in Washington
0.00%
30.00%
Cities with the Highest Percentage of Thai Population in Washington
| City | Thai | vs State | vs National | |
| 1. | Bothell East | 28.33% | 2.01%(+26.3)#1 | 1.44%(+26.9)#38 |
| 2. | Mill Creek East | 24.52% | 2.01%(+22.5)#2 | 1.44%(+23.1)#48 |
| 3. | Redmond | 21.38% | 2.01%(+19.4)#3 | 1.44%(+19.9)#60 |
| 4. | Union Hill Novelty Hill | 18.28% | 2.01%(+16.3)#4 | 1.44%(+16.8)#80 |
| 5. | Sammamish | 17.69% | 2.01%(+15.7)#5 | 1.44%(+16.2)#88 |
| 6. | Bellevue | 13.64% | 2.01%(+11.6)#6 | 1.44%(+12.2)#134 |
| 7. | Issaquah | 10.06% | 2.01%(+8.05)#7 | 1.44%(+8.62)#224 |
| 8. | Clyde Hill | 9.81% | 2.01%(+7.80)#8 | 1.44%(+8.38)#232 |
| 9. | Startup | 9.37% | 2.01%(+7.36)#9 | 1.44%(+7.93)#246 |
| 10. | Newcastle | 8.36% | 2.01%(+6.35)#10 | 1.44%(+6.92)#297 |
| 11. | Bothell West | 8.05% | 2.01%(+6.03)#11 | 1.44%(+6.61)#318 |
| 12. | Bothell | 7.66% | 2.01%(+5.65)#12 | 1.44%(+6.23)#343 |
| 13. | Banks Lake South | 7.61% | 2.01%(+5.60)#13 | 1.44%(+6.18)#345 |
| 14. | Snoqualmie | 6.17% | 2.01%(+4.16)#14 | 1.44%(+4.73)#466 |
| 15. | Lake Stickney | 6.12% | 2.01%(+4.10)#15 | 1.44%(+4.68)#472 |
| 16. | Woodinville | 5.53% | 2.01%(+3.52)#16 | 1.44%(+4.10)#542 |
| 17. | Maple Valley | 5.46% | 2.01%(+3.45)#17 | 1.44%(+4.02)#549 |
| 18. | Algona | 4.96% | 2.01%(+2.95)#18 | 1.44%(+3.53)#618 |
| 19. | Kirkland | 4.95% | 2.01%(+2.94)#19 | 1.44%(+3.52)#621 |
| 20. | Duvall | 4.88% | 2.01%(+2.87)#20 | 1.44%(+3.45)#634 |
| 21. | Kent | 4.56% | 2.01%(+2.54)#21 | 1.44%(+3.12)#694 |
| 22. | Forks | 4.50% | 2.01%(+2.48)#22 | 1.44%(+3.06)#707 |
| 23. | Monroe North | 4.26% | 2.01%(+2.24)#23 | 1.44%(+2.82)#769 |
| 24. | Yarrow Point | 4.14% | 2.01%(+2.13)#24 | 1.44%(+2.70)#798 |
| 25. | Mill Creek | 4.10% | 2.01%(+2.09)#25 | 1.44%(+2.66)#810 |
| 26. | Martha Lake | 3.94% | 2.01%(+1.93)#26 | 1.44%(+2.51)#863 |
| 27. | Silver Firs | 3.72% | 2.01%(+1.71)#27 | 1.44%(+2.28)#931 |
| 28. | Larch Way | 3.48% | 2.01%(+1.46)#28 | 1.44%(+2.04)#1,001 |
| 29. | Clearview | 3.22% | 2.01%(+1.20)#29 | 1.44%(+1.78)#1,106 |
| 30. | Ferndale | 3.20% | 2.01%(+1.19)#30 | 1.44%(+1.76)#1,117 |
| 31. | Seattle | 3.20% | 2.01%(+1.19)#31 | 1.44%(+1.76)#1,118 |
| 32. | Seatac | 3.19% | 2.01%(+1.18)#32 | 1.44%(+1.76)#1,119 |
| 33. | Mercer Island | 3.12% | 2.01%(+1.11)#33 | 1.44%(+1.68)#1,152 |
| 34. | Camas | 2.99% | 2.01%(+0.981)#34 | 1.44%(+1.56)#1,214 |
| 35. | Renton | 2.96% | 2.01%(+0.947)#35 | 1.44%(+1.52)#1,230 |
| 36. | Cottage Lake | 2.84% | 2.01%(+0.823)#36 | 1.44%(+1.40)#1,290 |
| 37. | Fairwood Cdp Spokane County | 2.72% | 2.01%(+0.705)#37 | 1.44%(+1.28)#1,352 |
| 38. | Monroe | 2.71% | 2.01%(+0.702)#38 | 1.44%(+1.28)#1,355 |
| 39. | Cavalero | 2.68% | 2.01%(+0.664)#39 | 1.44%(+1.24)#1,372 |
| 40. | Venersborg | 2.59% | 2.01%(+0.575)#40 | 1.44%(+1.15)#1,425 |
| 41. | Lynnwood | 2.58% | 2.01%(+0.568)#41 | 1.44%(+1.14)#1,429 |
| 42. | Hunts Point | 2.48% | 2.01%(+0.464)#42 | 1.44%(+1.04)#1,483 |
| 43. | Auburn | 2.46% | 2.01%(+0.446)#43 | 1.44%(+1.02)#1,492 |
| 44. | Mukilteo | 2.42% | 2.01%(+0.411)#44 | 1.44%(+0.987)#1,510 |
| 45. | Covington | 2.40% | 2.01%(+0.384)#45 | 1.44%(+0.960)#1,525 |
| 46. | Fairwood Cdp King County | 2.38% | 2.01%(+0.367)#46 | 1.44%(+0.943)#1,536 |
| 47. | Lakeland North | 2.37% | 2.01%(+0.353)#47 | 1.44%(+0.929)#1,543 |
| 48. | Pullman | 2.36% | 2.01%(+0.345)#48 | 1.44%(+0.921)#1,551 |
| 49. | Sumas | 2.29% | 2.01%(+0.277)#49 | 1.44%(+0.853)#1,606 |
| 50. | Belfair | 2.08% | 2.01%(+0.071)#50 | 1.44%(+0.646)#1,727 |
| 51. | Eastmont | 2.05% | 2.01%(+0.041)#51 | 1.44%(+0.617)#1,753 |
| 52. | Carnation | 2.03% | 2.01%(+0.015)#52 | 1.44%(+0.590)#1,775 |
| 53. | Des Moines | 1.91% | 2.01%(-0.103)#53 | 1.44%(+0.473)#1,875 |
| 54. | Lake Morton Berrydale | 1.89% | 2.01%(-0.120)#54 | 1.44%(+0.456)#1,885 |
| 55. | Republic | 1.87% | 2.01%(-0.138)#55 | 1.44%(+0.438)#1,899 |
| 56. | Lake Stevens | 1.75% | 2.01%(-0.264)#56 | 1.44%(+0.312)#2,044 |
| 57. | Bainbridge Island | 1.69% | 2.01%(-0.320)#57 | 1.44%(+0.256)#2,107 |
| 58. | Kenmore | 1.69% | 2.01%(-0.323)#58 | 1.44%(+0.252)#2,110 |
| 59. | Maple Heights Lake Desire | 1.66% | 2.01%(-0.354)#59 | 1.44%(+0.221)#2,137 |
| 60. | Alderwood Manor | 1.64% | 2.01%(-0.369)#60 | 1.44%(+0.206)#2,150 |
| 61. | Black Diamond | 1.60% | 2.01%(-0.414)#61 | 1.44%(+0.162)#2,198 |
| 62. | Mount Vista | 1.59% | 2.01%(-0.426)#62 | 1.44%(+0.149)#2,213 |
| 63. | Canterwood | 1.57% | 2.01%(-0.442)#63 | 1.44%(+0.134)#2,241 |
| 64. | Skokomish | 1.55% | 2.01%(-0.460)#64 | 1.44%(+0.115)#2,263 |
| 65. | Dallesport | 1.54% | 2.01%(-0.470)#65 | 1.44%(+0.105)#2,277 |
| 66. | Summit View | 1.53% | 2.01%(-0.481)#66 | 1.44%(+0.094)#2,289 |
| 67. | Ocean Park | 1.47% | 2.01%(-0.544)#67 | 1.44%(+0.032)#2,366 |
| 68. | Ames Lake | 1.44% | 2.01%(-0.569)#68 | 1.44%(+0.007)#2,397 |
| 69. | Medina | 1.44% | 2.01%(-0.576)#69 | 1.44%(-0.001)#2,414 |
| 70. | Lynden | 1.40% | 2.01%(-0.614)#70 | 1.44%(-0.038)#2,476 |
| 71. | Anderson Island | 1.36% | 2.01%(-0.656)#71 | 1.44%(-0.080)#2,529 |
| 72. | Bonney Lake | 1.35% | 2.01%(-0.659)#72 | 1.44%(-0.083)#2,536 |
| 73. | Shoreline | 1.31% | 2.01%(-0.704)#73 | 1.44%(-0.128)#2,594 |
| 74. | Olympia | 1.31% | 2.01%(-0.708)#74 | 1.44%(-0.132)#2,604 |
| 75. | North Lynnwood | 1.30% | 2.01%(-0.709)#75 | 1.44%(-0.134)#2,606 |
| 76. | Bryn Mawr Skyway | 1.26% | 2.01%(-0.754)#76 | 1.44%(-0.179)#2,684 |
| 77. | Marysville | 1.26% | 2.01%(-0.756)#77 | 1.44%(-0.180)#2,687 |
| 78. | Orchards | 1.23% | 2.01%(-0.784)#78 | 1.44%(-0.209)#2,731 |
| 79. | Everson | 1.22% | 2.01%(-0.797)#79 | 1.44%(-0.221)#2,747 |
| 80. | Parkwood | 1.20% | 2.01%(-0.808)#80 | 1.44%(-0.232)#2,767 |
| 81. | North Bend | 1.18% | 2.01%(-0.834)#81 | 1.44%(-0.258)#2,818 |
| 82. | Tehaleh | 1.15% | 2.01%(-0.867)#82 | 1.44%(-0.291)#2,871 |
| 83. | Tukwila | 1.12% | 2.01%(-0.896)#83 | 1.44%(-0.320)#2,924 |
| 84. | Sultan | 1.12% | 2.01%(-0.896)#84 | 1.44%(-0.321)#2,926 |
| 85. | Lake Goodwin | 1.11% | 2.01%(-0.902)#85 | 1.44%(-0.327)#2,937 |
| 86. | Mountlake Terrace | 1.11% | 2.01%(-0.908)#86 | 1.44%(-0.332)#2,951 |
| 87. | Picnic Point | 1.10% | 2.01%(-0.918)#87 | 1.44%(-0.342)#2,972 |
| 88. | Puyallup | 1.08% | 2.01%(-0.936)#88 | 1.44%(-0.360)#3,010 |
| 89. | Woodway | 1.07% | 2.01%(-0.940)#89 | 1.44%(-0.364)#3,015 |
| 90. | Richland | 1.05% | 2.01%(-0.960)#90 | 1.44%(-0.384)#3,056 |
| 91. | Prairie Heights | 1.05% | 2.01%(-0.961)#91 | 1.44%(-0.385)#3,057 |
| 92. | Fall City | 1.04% | 2.01%(-0.973)#92 | 1.44%(-0.397)#3,083 |
| 93. | Barberton | 0.99% | 2.01%(-1.02)#93 | 1.44%(-0.443)#3,179 |
| 94. | Bellingham | 0.98% | 2.01%(-1.03)#94 | 1.44%(-0.457)#3,213 |
| 95. | Coupeville | 0.98% | 2.01%(-1.03)#95 | 1.44%(-0.457)#3,214 |
| 96. | Bingen | 0.96% | 2.01%(-1.05)#96 | 1.44%(-0.473)#3,245 |
| 97. | Burien | 0.96% | 2.01%(-1.05)#97 | 1.44%(-0.476)#3,248 |
| 98. | Indianola | 0.96% | 2.01%(-1.06)#98 | 1.44%(-0.481)#3,261 |
| 99. | Leavenworth | 0.95% | 2.01%(-1.06)#99 | 1.44%(-0.483)#3,269 |
| 100. | Lake Ketchum | 0.93% | 2.01%(-1.09)#100 | 1.44%(-0.510)#3,326 |
Common Questions
What are the Top 10 Cities with the Highest Percentage of Thai Population in Washington?
Top 10 Cities with the Highest Percentage of Thai Population in Washington are:
#1
28.33%
#2
24.52%
#3
21.38%
#4
18.28%
#5
17.69%
#6
13.64%
#7
10.06%
#8
9.81%
#9
9.37%
#10
8.36%
What city has the Highest Percentage of Thai Population in Washington?
Bothell East has the Highest Percentage of Thai Population in Washington with 28.33%.
What is the Percentage of Thai Population in the State of Washington?
Percentage of Thai Population in Washington is 2.01%.
What is the Percentage of Thai Population in the United States?
Percentage of Thai Population in the United States is 1.44%.