Cities with the Highest Percentage of Population Employed in Information in Washington
RELATED REPORTS & OPTIONS
Information & Technology
Washington
Compare Cities
Map of Cities with the Highest Percentage of Population Employed in Information in Washington
0.0%
25.0%
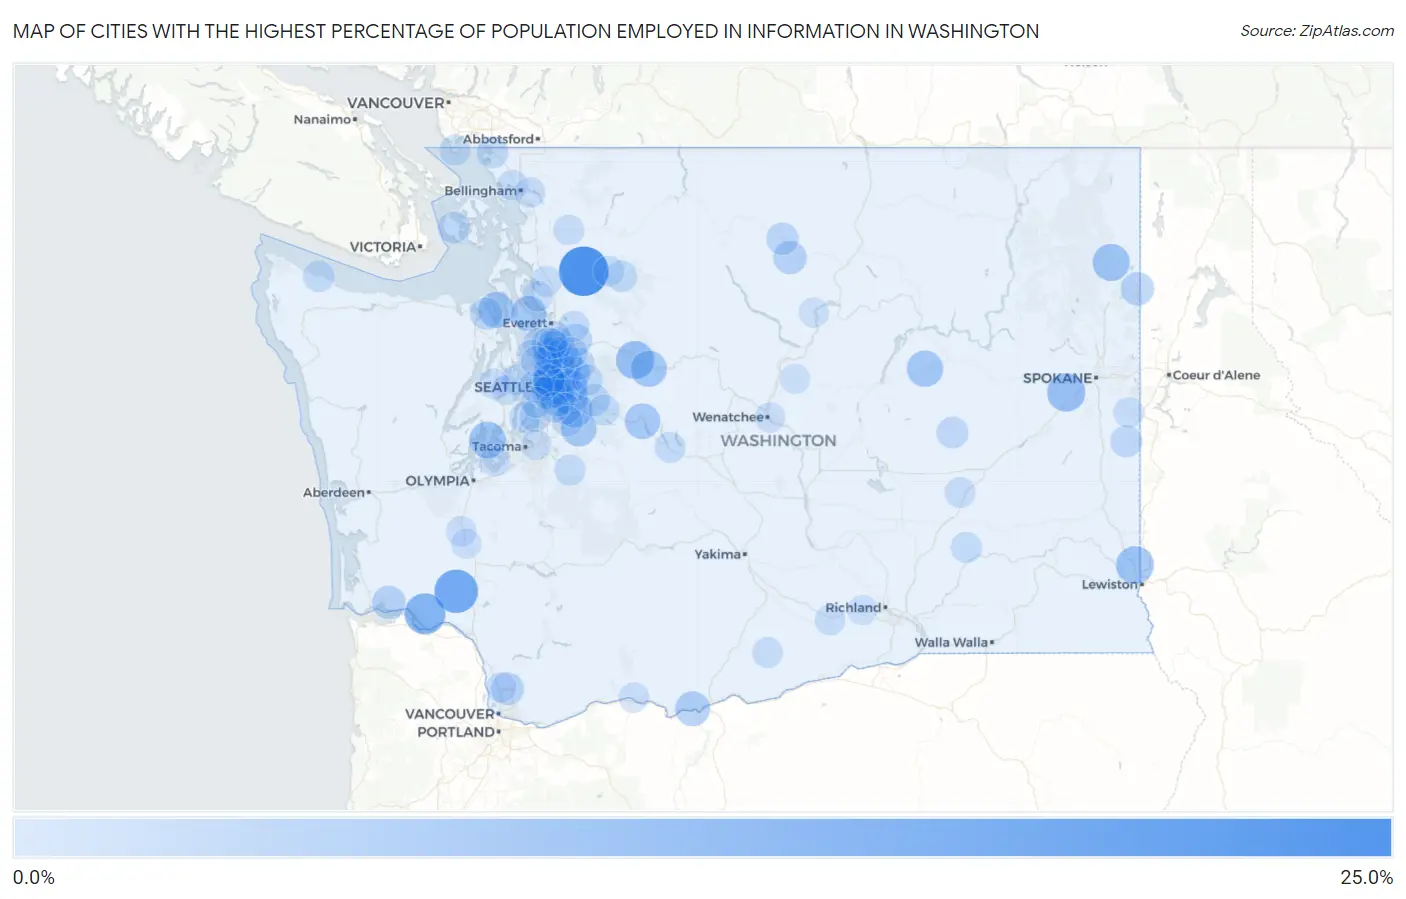
Cities with the Highest Percentage of Population Employed in Information in Washington
| City | % Employed | vs State | vs National | |
| 1. | Oso | 21.2% | 2.4%(+18.8)#1 | 1.9%(+19.3)#95 |
| 2. | Ryderwood | 15.3% | 2.4%(+12.9)#2 | 1.9%(+13.4)#184 |
| 3. | Upper Elochoman | 12.7% | 2.4%(+10.3)#3 | 1.9%(+10.8)#262 |
| 4. | Medical Lake | 10.1% | 2.4%(+7.74)#4 | 1.9%(+8.20)#384 |
| 5. | Baring | 10.0% | 2.4%(+7.64)#5 | 1.9%(+8.10)#393 |
| 6. | Uniontown | 9.5% | 2.4%(+7.16)#6 | 1.9%(+7.63)#437 |
| 7. | Cusick | 9.1% | 2.4%(+6.73)#7 | 1.9%(+7.19)#470 |
| 8. | Home | 8.7% | 2.4%(+6.36)#8 | 1.9%(+6.83)#508 |
| 9. | Almira | 8.3% | 2.4%(+5.97)#9 | 1.9%(+6.43)#536 |
| 10. | Skykomish | 8.3% | 2.4%(+5.97)#10 | 1.9%(+6.43)#539 |
| 11. | Marrowstone | 7.9% | 2.4%(+5.53)#11 | 1.9%(+6.00)#595 |
| 12. | Snoqualmie Pass | 7.7% | 2.4%(+5.33)#12 | 1.9%(+5.79)#619 |
| 13. | Langley | 7.6% | 2.4%(+5.26)#13 | 1.9%(+5.72)#633 |
| 14. | Issaquah | 7.5% | 2.4%(+5.19)#14 | 1.9%(+5.65)#648 |
| 15. | Ravensdale | 7.5% | 2.4%(+5.15)#15 | 1.9%(+5.61)#653 |
| 16. | Mirrormont | 7.3% | 2.4%(+4.95)#16 | 1.9%(+5.42)#699 |
| 17. | Beaux Arts Village | 7.2% | 2.4%(+4.88)#17 | 1.9%(+5.35)#708 |
| 18. | Union Hill Novelty Hill | 7.1% | 2.4%(+4.73)#18 | 1.9%(+5.20)#745 |
| 19. | Wishram | 7.0% | 2.4%(+4.67)#19 | 1.9%(+5.13)#764 |
| 20. | Medina | 6.9% | 2.4%(+4.57)#20 | 1.9%(+5.04)#787 |
| 21. | Newcastle | 6.8% | 2.4%(+4.42)#21 | 1.9%(+4.89)#817 |
| 22. | Martha Lake | 6.8% | 2.4%(+4.42)#22 | 1.9%(+4.89)#818 |
| 23. | Yarrow Point | 6.7% | 2.4%(+4.37)#23 | 1.9%(+4.83)#824 |
| 24. | Kirkland | 6.6% | 2.4%(+4.28)#24 | 1.9%(+4.75)#847 |
| 25. | Redmond | 6.3% | 2.4%(+3.97)#25 | 1.9%(+4.44)#922 |
| 26. | Bellevue | 6.0% | 2.4%(+3.64)#26 | 1.9%(+4.10)#1,032 |
| 27. | Rosburg | 5.7% | 2.4%(+3.35)#27 | 1.9%(+3.82)#1,132 |
| 28. | Clyde Hill | 5.7% | 2.4%(+3.31)#28 | 1.9%(+3.77)#1,150 |
| 29. | Mercer Island | 5.6% | 2.4%(+3.26)#29 | 1.9%(+3.73)#1,176 |
| 30. | Twisp | 5.6% | 2.4%(+3.23)#30 | 1.9%(+3.70)#1,189 |
| 31. | Newport | 5.6% | 2.4%(+3.23)#31 | 1.9%(+3.69)#1,192 |
| 32. | Seattle | 5.4% | 2.4%(+3.02)#32 | 1.9%(+3.48)#1,274 |
| 33. | Cottage Lake | 5.2% | 2.4%(+2.88)#33 | 1.9%(+3.35)#1,343 |
| 34. | Fairwood Cdp Spokane County | 5.1% | 2.4%(+2.69)#34 | 1.9%(+3.16)#1,437 |
| 35. | Sammamish | 5.1% | 2.4%(+2.69)#35 | 1.9%(+3.16)#1,438 |
| 36. | Woodinville | 5.0% | 2.4%(+2.67)#36 | 1.9%(+3.13)#1,452 |
| 37. | Dollars Corner | 5.0% | 2.4%(+2.67)#37 | 1.9%(+3.13)#1,453 |
| 38. | Mill Creek East | 5.0% | 2.4%(+2.63)#38 | 1.9%(+3.10)#1,477 |
| 39. | Port Hadlock Irondale | 4.7% | 2.4%(+2.30)#39 | 1.9%(+2.77)#1,663 |
| 40. | Bothell | 4.7% | 2.4%(+2.30)#40 | 1.9%(+2.76)#1,665 |
| 41. | Winthrop | 4.6% | 2.4%(+2.23)#41 | 1.9%(+2.69)#1,726 |
| 42. | Duvall | 4.5% | 2.4%(+2.14)#42 | 1.9%(+2.61)#1,773 |
| 43. | Snoqualmie | 4.5% | 2.4%(+2.14)#43 | 1.9%(+2.60)#1,780 |
| 44. | Bothell East | 4.4% | 2.4%(+1.99)#44 | 1.9%(+2.45)#1,906 |
| 45. | Bothell West | 4.3% | 2.4%(+1.96)#45 | 1.9%(+2.42)#1,928 |
| 46. | Monroe North | 4.3% | 2.4%(+1.95)#46 | 1.9%(+2.42)#1,932 |
| 47. | Friday Harbor | 4.3% | 2.4%(+1.89)#47 | 1.9%(+2.36)#1,978 |
| 48. | Latah | 4.3% | 2.4%(+1.89)#48 | 1.9%(+2.36)#1,985 |
| 49. | Odessa | 4.2% | 2.4%(+1.88)#49 | 1.9%(+2.35)#1,993 |
| 50. | East Renton Highlands | 4.1% | 2.4%(+1.76)#50 | 1.9%(+2.23)#2,107 |
| 51. | Blaine | 4.1% | 2.4%(+1.76)#51 | 1.9%(+2.22)#2,113 |
| 52. | Hunts Point | 4.1% | 2.4%(+1.73)#52 | 1.9%(+2.20)#2,127 |
| 53. | Meadowdale | 3.9% | 2.4%(+1.54)#53 | 1.9%(+2.01)#2,327 |
| 54. | Vashon | 3.9% | 2.4%(+1.51)#54 | 1.9%(+1.98)#2,375 |
| 55. | Erlands Point | 3.9% | 2.4%(+1.50)#55 | 1.9%(+1.96)#2,396 |
| 56. | Normandy Park | 3.8% | 2.4%(+1.46)#56 | 1.9%(+1.92)#2,430 |
| 57. | Clallam Bay | 3.8% | 2.4%(+1.44)#57 | 1.9%(+1.90)#2,446 |
| 58. | Clear Lake Cdp Skagit County | 3.7% | 2.4%(+1.36)#58 | 1.9%(+1.83)#2,543 |
| 59. | Darrington | 3.7% | 2.4%(+1.35)#59 | 1.9%(+1.81)#2,558 |
| 60. | Maltby | 3.7% | 2.4%(+1.29)#60 | 1.9%(+1.76)#2,646 |
| 61. | Carnation | 3.6% | 2.4%(+1.19)#61 | 1.9%(+1.66)#2,760 |
| 62. | Point Roberts | 3.5% | 2.4%(+1.11)#62 | 1.9%(+1.58)#2,864 |
| 63. | Snohomish | 3.5% | 2.4%(+1.11)#63 | 1.9%(+1.57)#2,870 |
| 64. | Wilkeson | 3.5% | 2.4%(+1.10)#64 | 1.9%(+1.57)#2,880 |
| 65. | Kahlotus | 3.4% | 2.4%(+1.03)#65 | 1.9%(+1.49)#2,978 |
| 66. | Bainbridge Island | 3.4% | 2.4%(+1.02)#66 | 1.9%(+1.48)#2,992 |
| 67. | Riverbend | 3.4% | 2.4%(+1.01)#67 | 1.9%(+1.48)#2,993 |
| 68. | Easton | 3.4% | 2.4%(+1.01)#68 | 1.9%(+1.48)#2,995 |
| 69. | Silver Firs | 3.4% | 2.4%(+1.01)#69 | 1.9%(+1.48)#3,001 |
| 70. | Lind | 3.4% | 2.4%(+0.994)#70 | 1.9%(+1.46)#3,025 |
| 71. | Sunday Lake | 3.4% | 2.4%(+0.987)#71 | 1.9%(+1.45)#3,037 |
| 72. | White Center | 3.3% | 2.4%(+0.963)#72 | 1.9%(+1.43)#3,082 |
| 73. | Lyman | 3.3% | 2.4%(+0.938)#73 | 1.9%(+1.40)#3,118 |
| 74. | Swede Heaven | 3.3% | 2.4%(+0.908)#74 | 1.9%(+1.37)#3,160 |
| 75. | Shadow Lake | 3.2% | 2.4%(+0.830)#75 | 1.9%(+1.30)#3,277 |
| 76. | Kenmore | 3.2% | 2.4%(+0.792)#76 | 1.9%(+1.26)#3,368 |
| 77. | Marietta Alderwood | 3.1% | 2.4%(+0.761)#77 | 1.9%(+1.23)#3,419 |
| 78. | Bickleton | 3.1% | 2.4%(+0.761)#78 | 1.9%(+1.23)#3,430 |
| 79. | Eastmont | 3.1% | 2.4%(+0.742)#79 | 1.9%(+1.21)#3,459 |
| 80. | Rockford | 3.1% | 2.4%(+0.729)#80 | 1.9%(+1.19)#3,479 |
| 81. | Prosser | 3.1% | 2.4%(+0.721)#81 | 1.9%(+1.19)#3,491 |
| 82. | Kayak Point | 3.1% | 2.4%(+0.713)#82 | 1.9%(+1.18)#3,503 |
| 83. | Fords Prairie | 3.0% | 2.4%(+0.666)#83 | 1.9%(+1.13)#3,593 |
| 84. | High Bridge | 3.0% | 2.4%(+0.664)#84 | 1.9%(+1.13)#3,611 |
| 85. | Woodway | 3.0% | 2.4%(+0.630)#85 | 1.9%(+1.10)#3,679 |
| 86. | Chico | 3.0% | 2.4%(+0.612)#86 | 1.9%(+1.08)#3,714 |
| 87. | White Salmon | 3.0% | 2.4%(+0.586)#87 | 1.9%(+1.05)#3,758 |
| 88. | Renton | 2.9% | 2.4%(+0.570)#88 | 1.9%(+1.04)#3,786 |
| 89. | Fife Heights | 2.9% | 2.4%(+0.564)#89 | 1.9%(+1.03)#3,797 |
| 90. | East Wenatchee | 2.9% | 2.4%(+0.525)#90 | 1.9%(+0.990)#3,883 |
| 91. | Shoreline | 2.8% | 2.4%(+0.478)#91 | 1.9%(+0.944)#3,997 |
| 92. | Geneva | 2.8% | 2.4%(+0.440)#92 | 1.9%(+0.905)#4,075 |
| 93. | Anderson Island | 2.8% | 2.4%(+0.419)#93 | 1.9%(+0.884)#4,129 |
| 94. | Duluth | 2.8% | 2.4%(+0.417)#94 | 1.9%(+0.883)#4,133 |
| 95. | Enetai | 2.7% | 2.4%(+0.353)#95 | 1.9%(+0.819)#4,301 |
| 96. | Mill Creek | 2.7% | 2.4%(+0.288)#96 | 1.9%(+0.754)#4,483 |
| 97. | Benton City | 2.6% | 2.4%(+0.270)#97 | 1.9%(+0.735)#4,521 |
| 98. | Chehalis | 2.6% | 2.4%(+0.259)#98 | 1.9%(+0.724)#4,550 |
| 99. | Pateros | 2.6% | 2.4%(+0.238)#99 | 1.9%(+0.704)#4,606 |
| 100. | Waterville | 2.6% | 2.4%(+0.229)#100 | 1.9%(+0.695)#4,632 |
Common Questions
What are the Top 10 Cities with the Highest Percentage of Population Employed in Information in Washington?
Top 10 Cities with the Highest Percentage of Population Employed in Information in Washington are:
#1
21.2%
#2
15.3%
#3
12.7%
#4
10.1%
#5
10.0%
#6
9.5%
#7
9.1%
#8
8.7%
#9
8.3%
#10
8.3%
What city has the Highest Percentage of Population Employed in Information in Washington?
Oso has the Highest Percentage of Population Employed in Information in Washington with 21.2%.
What is the Percentage of Population Employed in Information in the State of Washington?
Percentage of Population Employed in Information in Washington is 2.4%.
What is the Percentage of Population Employed in Information in the United States?
Percentage of Population Employed in Information in the United States is 1.9%.