Cities with the Highest Percentage of Immigrants from Honduras in Washington
RELATED REPORTS & OPTIONS
Honduras
Washington
Compare Cities
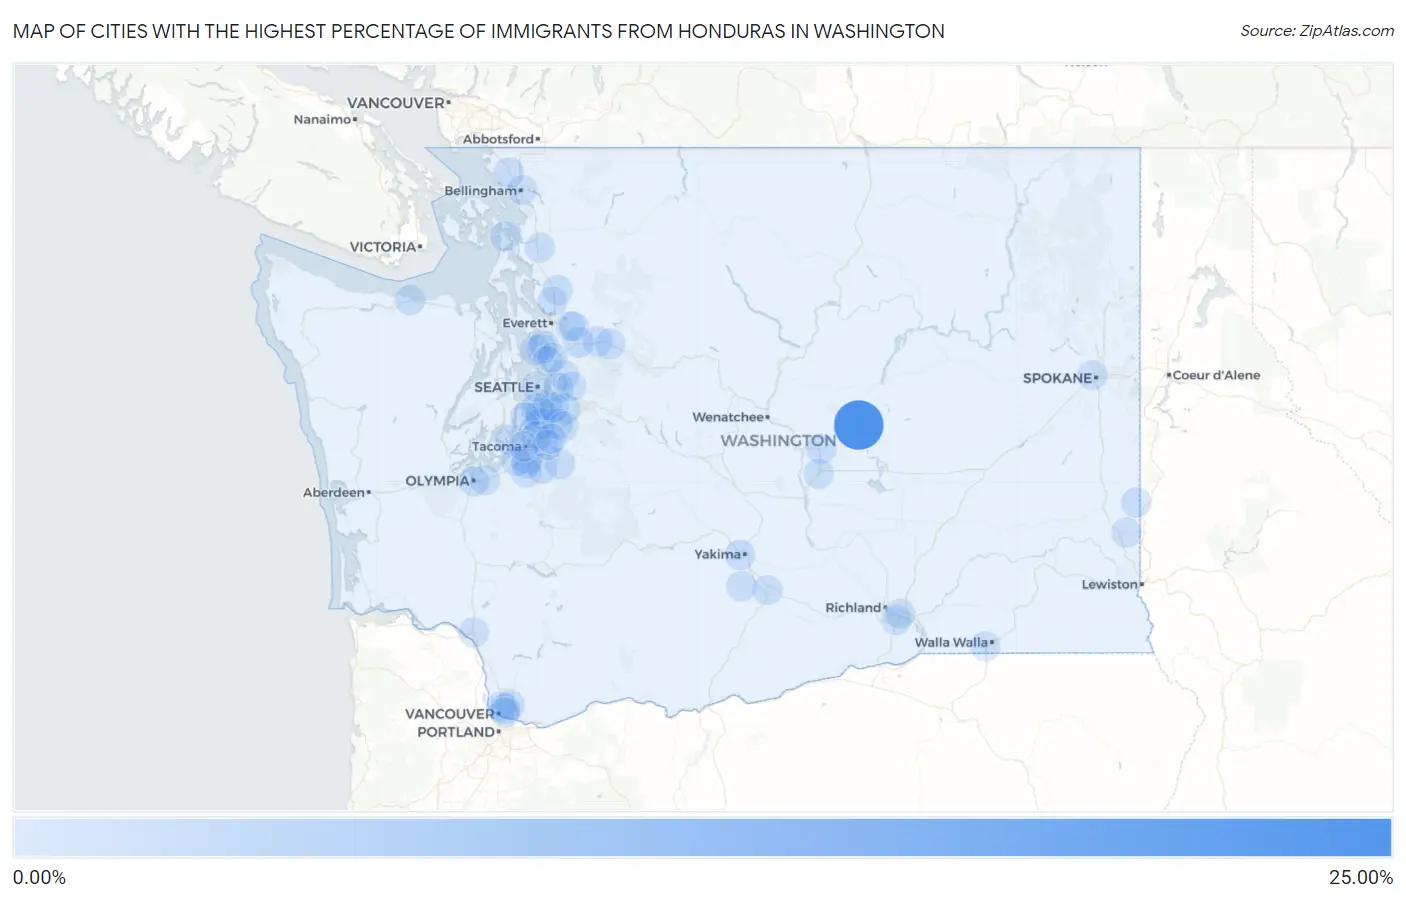
Map of Cities with the Highest Percentage of Immigrants from Honduras in Washington
0.00%
25.00%
Cities with the Highest Percentage of Immigrants from Honduras in Washington
| City | Honduras | vs State | vs National | |
| 1. | Lakeview | 25.00% | 0.085%(+24.9)#-1 | 0.22%(+24.8)#0 |
| 2. | Beverly | 12.99% | 0.085%(+12.9)#0 | 0.22%(+12.8)#1 |
| 3. | Burien | 1.60% | 0.085%(+1.51)#1 | 0.22%(+1.38)#2 |
| 4. | Seatac | 0.82% | 0.085%(+0.734)#2 | 0.22%(+0.598)#3 |
| 5. | Des Moines | 0.77% | 0.085%(+0.684)#3 | 0.22%(+0.549)#4 |
| 6. | Monroe | 0.75% | 0.085%(+0.664)#4 | 0.22%(+0.529)#5 |
| 7. | Midland | 0.74% | 0.085%(+0.653)#5 | 0.22%(+0.518)#6 |
| 8. | East Renton Highlands | 0.64% | 0.085%(+0.553)#6 | 0.22%(+0.418)#7 |
| 9. | Lakeland South | 0.59% | 0.085%(+0.502)#7 | 0.22%(+0.367)#8 |
| 10. | Wollochet | 0.58% | 0.085%(+0.493)#8 | 0.22%(+0.358)#9 |
| 11. | Vashon | 0.57% | 0.085%(+0.482)#9 | 0.22%(+0.347)#10 |
| 12. | Federal Way | 0.54% | 0.085%(+0.456)#10 | 0.22%(+0.320)#11 |
| 13. | Quincy | 0.53% | 0.085%(+0.444)#11 | 0.22%(+0.309)#12 |
| 14. | Ferndale | 0.52% | 0.085%(+0.438)#12 | 0.22%(+0.302)#13 |
| 15. | Sultan | 0.49% | 0.085%(+0.410)#13 | 0.22%(+0.275)#14 |
| 16. | Yakima | 0.41% | 0.085%(+0.324)#14 | 0.22%(+0.189)#15 |
| 17. | Palouse | 0.40% | 0.085%(+0.317)#15 | 0.22%(+0.182)#16 |
| 18. | Prairie Ridge | 0.39% | 0.085%(+0.301)#16 | 0.22%(+0.166)#17 |
| 19. | Minnehaha | 0.36% | 0.085%(+0.278)#17 | 0.22%(+0.143)#18 |
| 20. | Arlington | 0.33% | 0.085%(+0.241)#18 | 0.22%(+0.106)#19 |
| 21. | Bryn Mawr Skyway | 0.32% | 0.085%(+0.237)#19 | 0.22%(+0.102)#20 |
| 22. | Port Angeles | 0.31% | 0.085%(+0.230)#20 | 0.22%(+0.095)#21 |
| 23. | Harrah | 0.31% | 0.085%(+0.228)#21 | 0.22%(+0.093)#22 |
| 24. | Gold Bar | 0.30% | 0.085%(+0.215)#22 | 0.22%(+0.080)#23 |
| 25. | Redmond | 0.28% | 0.085%(+0.198)#23 | 0.22%(+0.062)#24 |
| 26. | Olympia | 0.26% | 0.085%(+0.178)#24 | 0.22%(+0.043)#25 |
| 27. | Edmonds | 0.23% | 0.085%(+0.145)#25 | 0.22%(+0.010)#26 |
| 28. | George | 0.22% | 0.085%(+0.140)#26 | 0.22%(+0.005)#27 |
| 29. | Kent | 0.19% | 0.085%(+0.106)#27 | 0.22%(-0.029)#28 |
| 30. | College Place | 0.17% | 0.085%(+0.089)#28 | 0.22%(-0.046)#29 |
| 31. | Lynnwood | 0.17% | 0.085%(+0.086)#29 | 0.22%(-0.049)#30 |
| 32. | Kelso | 0.17% | 0.085%(+0.081)#30 | 0.22%(-0.054)#31 |
| 33. | Spanaway | 0.16% | 0.085%(+0.080)#31 | 0.22%(-0.055)#32 |
| 34. | Lakewood | 0.16% | 0.085%(+0.072)#32 | 0.22%(-0.063)#33 |
| 35. | Everett | 0.15% | 0.085%(+0.067)#33 | 0.22%(-0.068)#34 |
| 36. | Pullman | 0.15% | 0.085%(+0.066)#34 | 0.22%(-0.070)#35 |
| 37. | South Hill | 0.14% | 0.085%(+0.058)#35 | 0.22%(-0.077)#36 |
| 38. | North Lynnwood | 0.14% | 0.085%(+0.056)#36 | 0.22%(-0.079)#37 |
| 39. | Fairwood Cdp King County | 0.13% | 0.085%(+0.044)#37 | 0.22%(-0.091)#38 |
| 40. | Parkland | 0.11% | 0.085%(+0.030)#38 | 0.22%(-0.105)#39 |
| 41. | Kennewick | 0.11% | 0.085%(+0.029)#39 | 0.22%(-0.106)#40 |
| 42. | Snohomish | 0.11% | 0.085%(+0.024)#40 | 0.22%(-0.111)#41 |
| 43. | Hazel Dell | 0.11% | 0.085%(+0.021)#41 | 0.22%(-0.114)#42 |
| 44. | Kenmore | 0.093% | 0.085%(+0.009)#42 | 0.22%(-0.126)#43 |
| 45. | Bellingham | 0.092% | 0.085%(+0.007)#43 | 0.22%(-0.128)#44 |
| 46. | Toppenish | 0.091% | 0.085%(+0.006)#44 | 0.22%(-0.129)#45 |
| 47. | Tacoma | 0.084% | 0.085%(-0.000)#45 | 0.22%(-0.135)#46 |
| 48. | Bellevue | 0.084% | 0.085%(-0.000)#46 | 0.22%(-0.135)#47 |
| 49. | Renton | 0.084% | 0.085%(-0.001)#47 | 0.22%(-0.136)#48 |
| 50. | Mount Vernon | 0.077% | 0.085%(-0.008)#48 | 0.22%(-0.143)#49 |
| 51. | Lacey | 0.073% | 0.085%(-0.012)#49 | 0.22%(-0.147)#50 |
| 52. | Five Corners | 0.072% | 0.085%(-0.013)#50 | 0.22%(-0.148)#51 |
| 53. | Marysville | 0.054% | 0.085%(-0.031)#51 | 0.22%(-0.166)#52 |
| 54. | Seattle | 0.053% | 0.085%(-0.032)#52 | 0.22%(-0.167)#286 |
| 55. | Pasco | 0.032% | 0.085%(-0.052)#53 | 0.22%(-0.187)#287 |
| 56. | Vancouver | 0.019% | 0.085%(-0.065)#54 | 0.22%(-0.200)#288 |
| 57. | Bothell | 0.019% | 0.085%(-0.066)#55 | 0.22%(-0.201)#289 |
| 58. | Sammamish | 0.015% | 0.085%(-0.070)#56 | 0.22%(-0.205)#290 |
| 59. | Covington | 0.014% | 0.085%(-0.070)#57 | 0.22%(-0.205)#291 |
| 60. | Pacific | 0.014% | 0.085%(-0.070)#58 | 0.22%(-0.206)#292 |
| 61. | Auburn | 0.014% | 0.085%(-0.071)#59 | 0.22%(-0.206)#293 |
| 62. | Anacortes | 0.011% | 0.085%(-0.073)#60 | 0.22%(-0.208)#294 |
| 63. | Spokane | 0.0013% | 0.085%(-0.083)#61 | 0.22%(-0.218)#295 |
Common Questions
What are the Top 10 Cities with the Highest Percentage of Immigrants from Honduras in Washington?
Top 10 Cities with the Highest Percentage of Immigrants from Honduras in Washington are:
#1
25.00%
#2
1.60%
#3
0.82%
#4
0.77%
#5
0.75%
#6
0.74%
#7
0.64%
#8
0.59%
#9
0.58%
#10
0.57%
What city has the Highest Percentage of Immigrants from Honduras in Washington?
Lakeview has the Highest Percentage of Immigrants from Honduras in Washington with 25.00%.
What is the Percentage of Immigrants from Honduras in the State of Washington?
Percentage of Immigrants from Honduras in Washington is 0.085%.
What is the Percentage of Immigrants from Honduras in the United States?
Percentage of Immigrants from Honduras in the United States is 0.22%.