Cities with the Highest Poverty Level Among Single Mothers in Washington
RELATED REPORTS & OPTIONS
Highest Poverty | Single Mother
Washington
Compare Cities
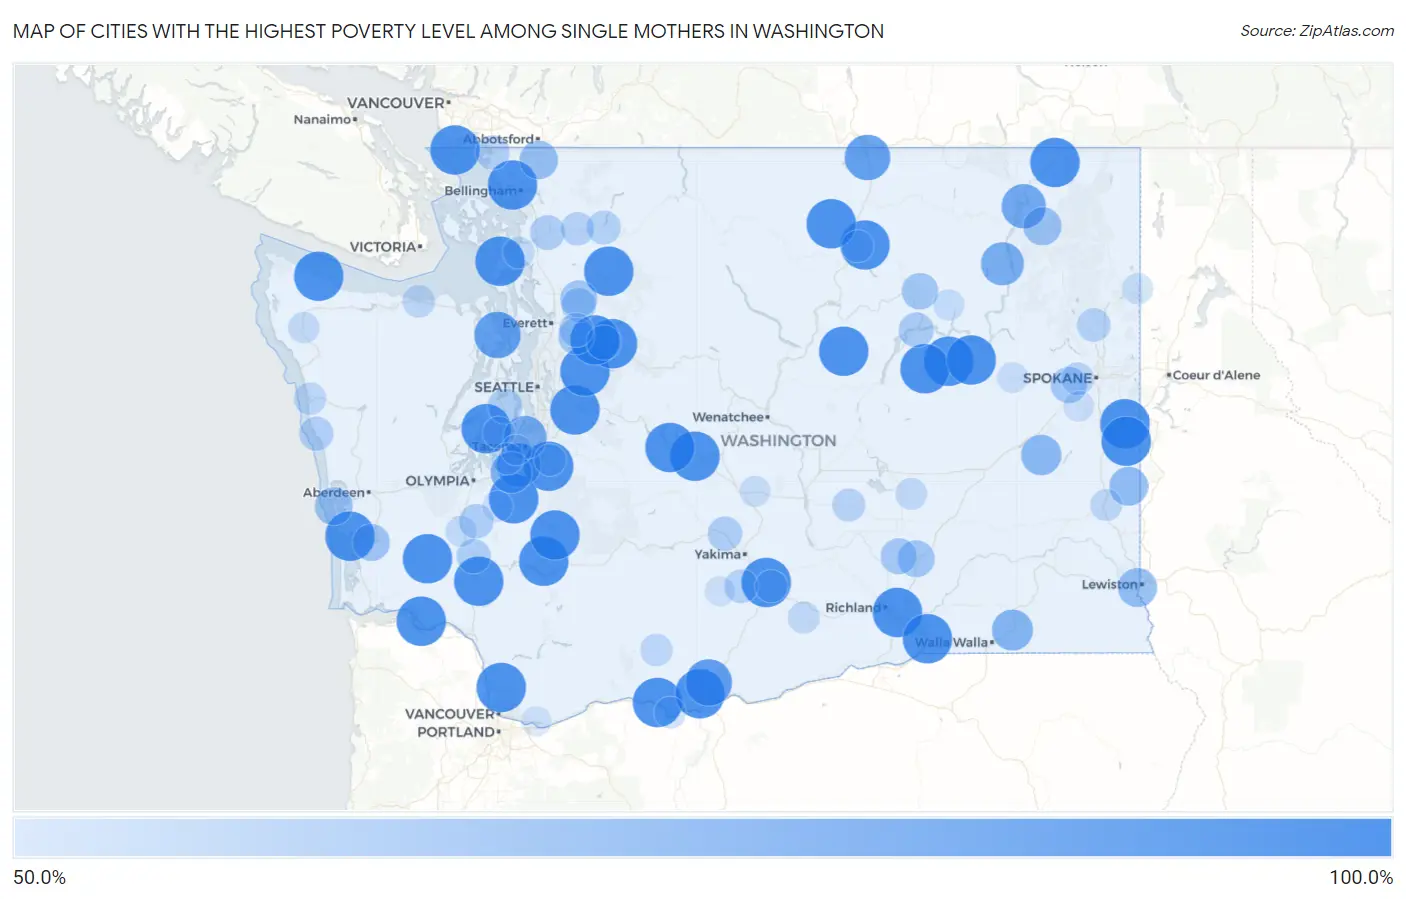
Map of Cities with the Highest Poverty Level Among Single Mothers in Washington
0.0%
100.0%
Cities with the Highest Poverty Level Among Single Mothers in Washington
| City | Single Mother Poverty | vs State | vs National | |
| 1. | Mirrormont | 100.0% | 28.2%(+71.8)#1 | 33.1%(+66.9)#36 |
| 2. | Marietta Alderwood | 100.0% | 28.2%(+71.8)#2 | 33.1%(+66.9)#59 |
| 3. | Whidbey Island Station | 100.0% | 28.2%(+71.8)#3 | 33.1%(+66.9)#119 |
| 4. | West Pasco | 100.0% | 28.2%(+71.8)#4 | 33.1%(+66.9)#171 |
| 5. | Duluth | 100.0% | 28.2%(+71.8)#5 | 33.1%(+66.9)#189 |
| 6. | Lake Marcel Stillwater | 100.0% | 28.2%(+71.8)#6 | 33.1%(+66.9)#254 |
| 7. | Morton | 100.0% | 28.2%(+71.8)#7 | 33.1%(+66.9)#270 |
| 8. | Vaughn | 100.0% | 28.2%(+71.8)#8 | 33.1%(+66.9)#280 |
| 9. | Point Roberts | 100.0% | 28.2%(+71.8)#9 | 33.1%(+66.9)#301 |
| 10. | Mcmillin | 100.0% | 28.2%(+71.8)#10 | 33.1%(+66.9)#323 |
| 11. | Swede Heaven | 100.0% | 28.2%(+71.8)#11 | 33.1%(+66.9)#357 |
| 12. | May Creek | 100.0% | 28.2%(+71.8)#12 | 33.1%(+66.9)#484 |
| 13. | Wilbur | 100.0% | 28.2%(+71.8)#13 | 33.1%(+66.9)#527 |
| 14. | Clallam Bay | 100.0% | 28.2%(+71.8)#14 | 33.1%(+66.9)#573 |
| 15. | South Cle Elum | 100.0% | 28.2%(+71.8)#15 | 33.1%(+66.9)#587 |
| 16. | East Cathlamet | 100.0% | 28.2%(+71.8)#16 | 33.1%(+66.9)#671 |
| 17. | Fairfield | 100.0% | 28.2%(+71.8)#17 | 33.1%(+66.9)#681 |
| 18. | Mckenna | 100.0% | 28.2%(+71.8)#18 | 33.1%(+66.9)#740 |
| 19. | Buena | 100.0% | 28.2%(+71.8)#19 | 33.1%(+66.9)#758 |
| 20. | Toledo | 100.0% | 28.2%(+71.8)#20 | 33.1%(+66.9)#785 |
| 21. | Pe Ell | 100.0% | 28.2%(+71.8)#21 | 33.1%(+66.9)#796 |
| 22. | North Omak | 100.0% | 28.2%(+71.8)#22 | 33.1%(+66.9)#961 |
| 23. | Almira | 100.0% | 28.2%(+71.8)#23 | 33.1%(+66.9)#1,022 |
| 24. | North Sultan | 100.0% | 28.2%(+71.8)#24 | 33.1%(+66.9)#1,068 |
| 25. | Easton | 100.0% | 28.2%(+71.8)#25 | 33.1%(+66.9)#1,081 |
| 26. | Mansfield | 100.0% | 28.2%(+71.8)#26 | 33.1%(+66.9)#1,085 |
| 27. | Beverly | 100.0% | 28.2%(+71.8)#27 | 33.1%(+66.9)#1,121 |
| 28. | Lyle | 100.0% | 28.2%(+71.8)#28 | 33.1%(+66.9)#1,252 |
| 29. | Northport | 100.0% | 28.2%(+71.8)#29 | 33.1%(+66.9)#1,316 |
| 30. | Creston | 100.0% | 28.2%(+71.8)#30 | 33.1%(+66.9)#1,388 |
| 31. | Conconully | 100.0% | 28.2%(+71.8)#31 | 33.1%(+66.9)#1,424 |
| 32. | Latah | 100.0% | 28.2%(+71.8)#32 | 33.1%(+66.9)#1,525 |
| 33. | Centerville | 100.0% | 28.2%(+71.8)#33 | 33.1%(+66.9)#1,710 |
| 34. | Tokeland | 100.0% | 28.2%(+71.8)#34 | 33.1%(+66.9)#1,749 |
| 35. | Wallula | 100.0% | 28.2%(+71.8)#35 | 33.1%(+66.9)#1,797 |
| 36. | Mineral | 100.0% | 28.2%(+71.8)#36 | 33.1%(+66.9)#1,853 |
| 37. | Goldendale | 93.2% | 28.2%(+65.0)#37 | 33.1%(+60.0)#2,063 |
| 38. | Port Ludlow | 92.5% | 28.2%(+64.3)#38 | 33.1%(+59.3)#2,077 |
| 39. | Oroville | 90.8% | 28.2%(+62.6)#39 | 33.1%(+57.6)#2,141 |
| 40. | Marcus | 87.5% | 28.2%(+59.3)#40 | 33.1%(+54.4)#2,298 |
| 41. | Mcchord Afb | 87.3% | 28.2%(+59.1)#41 | 33.1%(+54.2)#2,302 |
| 42. | Browns Point | 85.3% | 28.2%(+57.1)#42 | 33.1%(+52.2)#2,420 |
| 43. | Inchelium | 84.6% | 28.2%(+56.4)#43 | 33.1%(+51.5)#2,462 |
| 44. | Fort Lewis | 80.5% | 28.2%(+52.3)#44 | 33.1%(+47.3)#2,724 |
| 45. | Dixie | 80.0% | 28.2%(+51.8)#45 | 33.1%(+46.9)#2,787 |
| 46. | Lamont | 78.1% | 28.2%(+49.9)#46 | 33.1%(+45.0)#2,910 |
| 47. | West Clarkston Highland | 75.4% | 28.2%(+47.2)#47 | 33.1%(+42.2)#3,134 |
| 48. | Garfield | 75.0% | 28.2%(+46.8)#48 | 33.1%(+41.9)#3,191 |
| 49. | Nooksack | 73.9% | 28.2%(+45.7)#49 | 33.1%(+40.8)#3,306 |
| 50. | Colville | 72.9% | 28.2%(+44.8)#50 | 33.1%(+39.8)#3,394 |
| 51. | Westport | 72.6% | 28.2%(+44.4)#51 | 33.1%(+39.5)#3,459 |
| 52. | South Bend | 70.8% | 28.2%(+42.6)#52 | 33.1%(+37.7)#3,659 |
| 53. | Mesa | 70.3% | 28.2%(+42.1)#53 | 33.1%(+37.1)#3,703 |
| 54. | Canyon Creek | 70.1% | 28.2%(+42.0)#54 | 33.1%(+37.0)#3,715 |
| 55. | Nespelem | 69.2% | 28.2%(+41.0)#55 | 33.1%(+36.1)#3,833 |
| 56. | Chain Lake | 68.8% | 28.2%(+40.6)#56 | 33.1%(+35.6)#3,863 |
| 57. | Fairchild Afb | 68.8% | 28.2%(+40.6)#57 | 33.1%(+35.6)#3,864 |
| 58. | Basin City | 68.5% | 28.2%(+40.3)#58 | 33.1%(+35.4)#3,893 |
| 59. | Grand Coulee | 66.0% | 28.2%(+37.9)#59 | 33.1%(+32.9)#4,288 |
| 60. | Sedro Woolley | 65.7% | 28.2%(+37.5)#60 | 33.1%(+32.6)#4,314 |
| 61. | Bethel | 65.7% | 28.2%(+37.5)#61 | 33.1%(+32.5)#4,315 |
| 62. | Startup | 65.1% | 28.2%(+36.9)#62 | 33.1%(+32.0)#4,377 |
| 63. | Granite Falls | 65.0% | 28.2%(+36.8)#63 | 33.1%(+31.8)#4,402 |
| 64. | Naches | 64.9% | 28.2%(+36.7)#64 | 33.1%(+31.7)#4,415 |
| 65. | Bucoda | 64.9% | 28.2%(+36.7)#65 | 33.1%(+31.7)#4,416 |
| 66. | Napavine | 64.6% | 28.2%(+36.4)#66 | 33.1%(+31.4)#4,450 |
| 67. | Blaine | 64.3% | 28.2%(+36.2)#67 | 33.1%(+31.2)#4,472 |
| 68. | Taholah | 64.2% | 28.2%(+36.0)#68 | 33.1%(+31.1)#4,505 |
| 69. | Three Lakes | 64.2% | 28.2%(+36.0)#69 | 33.1%(+31.0)#4,509 |
| 70. | Concrete | 63.6% | 28.2%(+35.5)#70 | 33.1%(+30.5)#4,576 |
| 71. | Deer Park | 63.2% | 28.2%(+35.0)#71 | 33.1%(+30.1)#4,642 |
| 72. | Harrah | 63.2% | 28.2%(+35.0)#72 | 33.1%(+30.0)#4,653 |
| 73. | Hamilton | 62.5% | 28.2%(+34.3)#73 | 33.1%(+29.4)#4,757 |
| 74. | Royal City | 61.5% | 28.2%(+33.4)#74 | 33.1%(+28.4)#4,867 |
| 75. | Airway Heights | 60.8% | 28.2%(+32.6)#75 | 33.1%(+27.7)#4,982 |
| 76. | Port Angeles East | 60.5% | 28.2%(+32.3)#76 | 33.1%(+27.4)#5,018 |
| 77. | Clear Lake Cdp Skagit County | 60.4% | 28.2%(+32.2)#77 | 33.1%(+27.3)#5,030 |
| 78. | Glenwood | 60.0% | 28.2%(+31.8)#78 | 33.1%(+26.9)#5,156 |
| 79. | Queets | 60.0% | 28.2%(+31.8)#79 | 33.1%(+26.9)#5,177 |
| 80. | Zillah | 59.8% | 28.2%(+31.6)#80 | 33.1%(+26.7)#5,191 |
| 81. | Colfax | 59.2% | 28.2%(+31.0)#81 | 33.1%(+26.0)#5,257 |
| 82. | Mabton | 59.1% | 28.2%(+31.0)#82 | 33.1%(+26.0)#5,265 |
| 83. | Raft Island | 59.1% | 28.2%(+30.9)#83 | 33.1%(+26.0)#5,276 |
| 84. | Omak | 59.0% | 28.2%(+30.8)#84 | 33.1%(+25.8)#5,284 |
| 85. | Steilacoom | 58.7% | 28.2%(+30.5)#85 | 33.1%(+25.6)#5,318 |
| 86. | Alderton | 58.5% | 28.2%(+30.4)#86 | 33.1%(+25.4)#5,341 |
| 87. | Warden | 58.5% | 28.2%(+30.3)#87 | 33.1%(+25.4)#5,345 |
| 88. | Dallesport | 58.5% | 28.2%(+30.3)#88 | 33.1%(+25.4)#5,348 |
| 89. | La Conner | 58.3% | 28.2%(+30.2)#89 | 33.1%(+25.2)#5,376 |
| 90. | Forks | 58.2% | 28.2%(+30.0)#90 | 33.1%(+25.1)#5,418 |
| 91. | Fords Prairie | 58.0% | 28.2%(+29.8)#91 | 33.1%(+24.8)#5,441 |
| 92. | Newport | 57.1% | 28.2%(+29.0)#92 | 33.1%(+24.0)#5,542 |
| 93. | Keller | 57.1% | 28.2%(+29.0)#93 | 33.1%(+24.0)#5,599 |
| 94. | Kittitas | 56.6% | 28.2%(+28.4)#94 | 33.1%(+23.5)#5,676 |
| 95. | Davenport | 56.5% | 28.2%(+28.3)#95 | 33.1%(+23.4)#5,683 |
| 96. | Fircrest | 56.2% | 28.2%(+28.0)#96 | 33.1%(+23.0)#5,739 |
| 97. | Rainier | 56.1% | 28.2%(+27.9)#97 | 33.1%(+22.9)#5,750 |
| 98. | Cheney | 56.0% | 28.2%(+27.8)#98 | 33.1%(+22.9)#5,764 |
| 99. | White Swan | 55.3% | 28.2%(+27.1)#99 | 33.1%(+22.1)#5,879 |
| 100. | Washougal | 55.1% | 28.2%(+26.9)#100 | 33.1%(+21.9)#5,908 |
Common Questions
What are the Top 10 Cities with the Highest Poverty Level Among Single Mothers in Washington?
Top 10 Cities with the Highest Poverty Level Among Single Mothers in Washington are:
#1
100.0%
#2
100.0%
#3
100.0%
#4
100.0%
#5
100.0%
#6
100.0%
#7
100.0%
#8
100.0%
#9
100.0%
#10
100.0%
What city has the Highest Poverty Level Among Single Mothers in Washington?
Mirrormont has the Highest Poverty Level Among Single Mothers in Washington with 100.0%.
What is the Poverty Level Among Single Mothers in the State of Washington?
Poverty Level Among Single Mothers in Washington is 28.2%.
What is the Poverty Level Among Single Mothers in the United States?
Poverty Level Among Single Mothers in the United States is 33.1%.