Cities with the Lowest Poverty Level Among Single Females in Washington
RELATED REPORTS & OPTIONS
Lowest Poverty | Single Female
Washington
Compare Cities
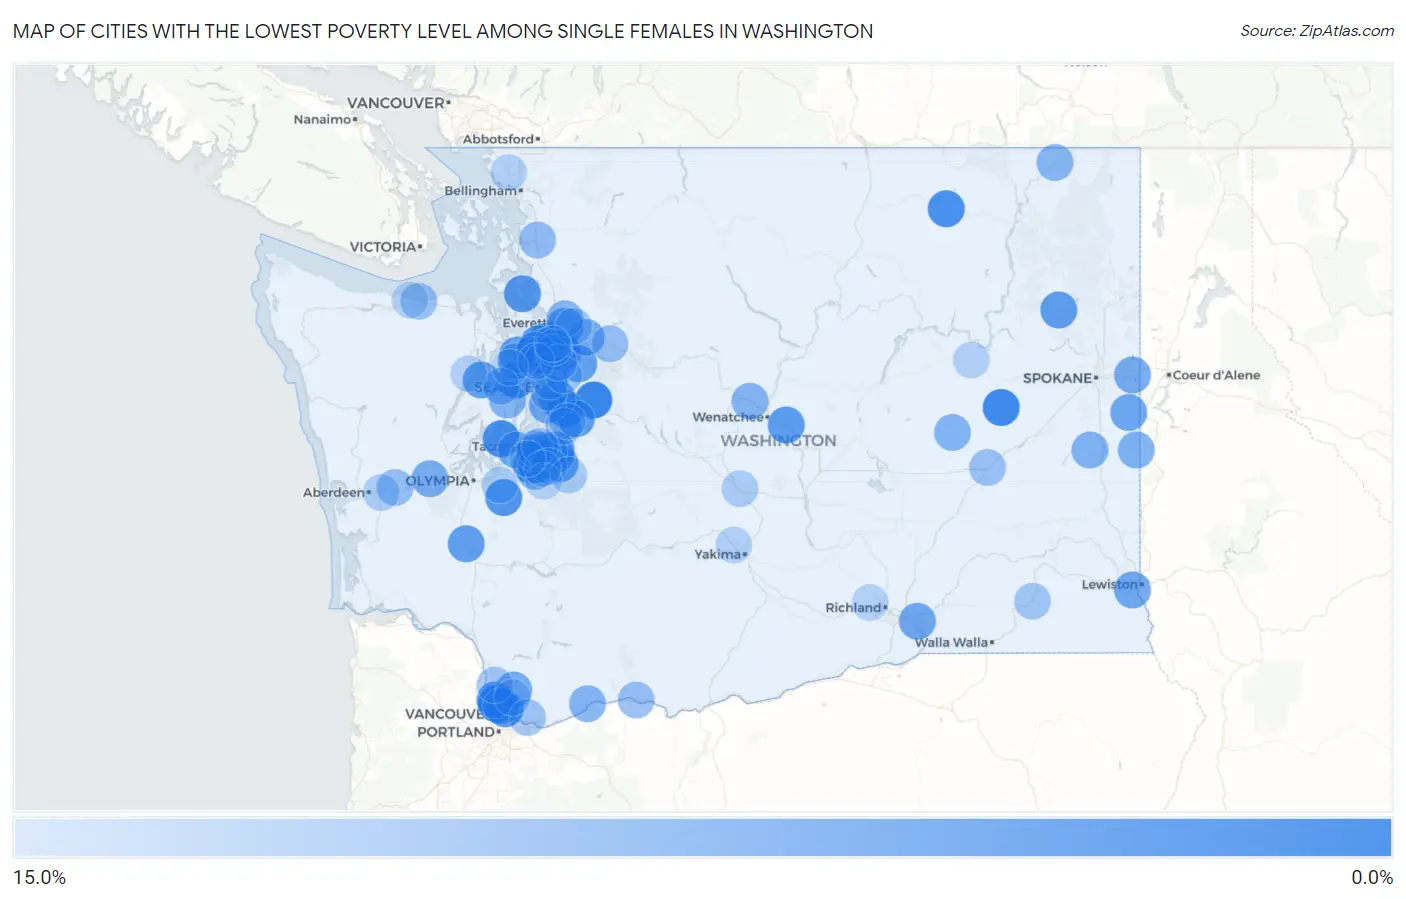
Map of Cities with the Lowest Poverty Level Among Single Females in Washington
15.0%
0.0%
Cities with the Lowest Poverty Level Among Single Females in Washington
| City | Single Female Poverty | vs State | vs National | |
| 1. | Snoqualmie | 1.7% | 20.7%(-19.0)#1 | 24.1%(-22.3)#62 |
| 2. | Lake Shore | 2.1% | 20.7%(-18.7)#2 | 24.1%(-22.0)#99 |
| 3. | Harrington | 2.3% | 20.7%(-18.5)#3 | 24.1%(-21.8)#129 |
| 4. | East Renton Highlands | 2.5% | 20.7%(-18.2)#4 | 24.1%(-21.5)#152 |
| 5. | Artondale | 3.0% | 20.7%(-17.7)#5 | 24.1%(-21.0)#238 |
| 6. | Alderwood Manor | 3.4% | 20.7%(-17.4)#6 | 24.1%(-20.7)#304 |
| 7. | Minnehaha | 3.5% | 20.7%(-17.2)#7 | 24.1%(-20.5)#345 |
| 8. | Clover Creek | 3.6% | 20.7%(-17.1)#8 | 24.1%(-20.5)#363 |
| 9. | Republic | 3.6% | 20.7%(-17.1)#9 | 24.1%(-20.5)#365 |
| 10. | Bainbridge Island | 3.9% | 20.7%(-16.9)#10 | 24.1%(-20.2)#423 |
| 11. | Lake Stickney | 4.1% | 20.7%(-16.6)#11 | 24.1%(-20.0)#467 |
| 12. | Maltby | 4.3% | 20.7%(-16.4)#12 | 24.1%(-19.7)#509 |
| 13. | Yelm | 4.3% | 20.7%(-16.4)#13 | 24.1%(-19.7)#512 |
| 14. | Meadowdale | 4.4% | 20.7%(-16.3)#14 | 24.1%(-19.7)#539 |
| 15. | Camano | 4.7% | 20.7%(-16.0)#15 | 24.1%(-19.3)#622 |
| 16. | Lake Tapps | 4.8% | 20.7%(-16.0)#16 | 24.1%(-19.3)#650 |
| 17. | Hobart | 5.1% | 20.7%(-15.7)#17 | 24.1%(-19.0)#726 |
| 18. | Rock Island | 5.4% | 20.7%(-15.4)#18 | 24.1%(-18.7)#809 |
| 19. | Clearview | 5.5% | 20.7%(-15.2)#19 | 24.1%(-18.6)#844 |
| 20. | Springdale | 5.6% | 20.7%(-15.2)#20 | 24.1%(-18.5)#863 |
| 21. | Brier | 5.8% | 20.7%(-14.9)#21 | 24.1%(-18.3)#934 |
| 22. | Chehalis | 5.8% | 20.7%(-14.9)#22 | 24.1%(-18.3)#936 |
| 23. | Kingston | 6.0% | 20.7%(-14.8)#23 | 24.1%(-18.1)#999 |
| 24. | Duvall | 6.0% | 20.7%(-14.7)#24 | 24.1%(-18.1)#1,003 |
| 25. | Prairie Ridge | 6.1% | 20.7%(-14.6)#25 | 24.1%(-18.0)#1,039 |
| 26. | Seabeck | 6.1% | 20.7%(-14.6)#26 | 24.1%(-18.0)#1,043 |
| 27. | Larch Way | 6.3% | 20.7%(-14.4)#27 | 24.1%(-17.8)#1,112 |
| 28. | Woodway | 6.4% | 20.7%(-14.4)#28 | 24.1%(-17.7)#1,133 |
| 29. | Felida | 6.5% | 20.7%(-14.3)#29 | 24.1%(-17.6)#1,156 |
| 30. | Mountlake Terrace | 6.5% | 20.7%(-14.3)#30 | 24.1%(-17.6)#1,159 |
| 31. | Summit | 6.6% | 20.7%(-14.2)#31 | 24.1%(-17.5)#1,179 |
| 32. | Bunk Foss | 6.7% | 20.7%(-14.1)#32 | 24.1%(-17.4)#1,210 |
| 33. | Newcastle | 6.9% | 20.7%(-13.9)#33 | 24.1%(-17.2)#1,280 |
| 34. | Bryn Mawr Skyway | 7.1% | 20.7%(-13.6)#34 | 24.1%(-16.9)#1,354 |
| 35. | Rockford | 7.1% | 20.7%(-13.6)#35 | 24.1%(-16.9)#1,385 |
| 36. | Clarkston Heights Vineland | 7.4% | 20.7%(-13.4)#36 | 24.1%(-16.7)#1,455 |
| 37. | Burbank | 7.4% | 20.7%(-13.3)#37 | 24.1%(-16.7)#1,464 |
| 38. | Liberty Lake | 7.9% | 20.7%(-12.9)#38 | 24.1%(-16.2)#1,659 |
| 39. | Fircrest | 7.9% | 20.7%(-12.8)#39 | 24.1%(-16.2)#1,670 |
| 40. | Battle Ground | 8.1% | 20.7%(-12.7)#40 | 24.1%(-16.0)#1,725 |
| 41. | Woods Creek | 8.1% | 20.7%(-12.6)#41 | 24.1%(-16.0)#1,737 |
| 42. | Indianola | 8.3% | 20.7%(-12.5)#42 | 24.1%(-15.8)#1,782 |
| 43. | Edmonds | 8.3% | 20.7%(-12.4)#43 | 24.1%(-15.7)#1,790 |
| 44. | Mccleary | 8.3% | 20.7%(-12.4)#44 | 24.1%(-15.7)#1,797 |
| 45. | Frederickson | 8.7% | 20.7%(-12.0)#45 | 24.1%(-15.4)#1,928 |
| 46. | Summit View | 8.7% | 20.7%(-12.0)#46 | 24.1%(-15.4)#1,952 |
| 47. | Bonney Lake | 8.8% | 20.7%(-11.9)#47 | 24.1%(-15.2)#1,986 |
| 48. | Tekoa | 8.9% | 20.7%(-11.9)#48 | 24.1%(-15.2)#2,005 |
| 49. | Malden | 9.1% | 20.7%(-11.6)#49 | 24.1%(-15.0)#2,099 |
| 50. | Sumner | 9.2% | 20.7%(-11.5)#50 | 24.1%(-14.9)#2,129 |
| 51. | Kirkland | 9.3% | 20.7%(-11.4)#51 | 24.1%(-14.8)#2,174 |
| 52. | Parkwood | 9.4% | 20.7%(-11.4)#52 | 24.1%(-14.7)#2,189 |
| 53. | Cashmere | 9.5% | 20.7%(-11.2)#53 | 24.1%(-14.6)#2,234 |
| 54. | Odessa | 9.5% | 20.7%(-11.2)#54 | 24.1%(-14.6)#2,237 |
| 55. | Stevenson | 9.6% | 20.7%(-11.1)#55 | 24.1%(-14.5)#2,266 |
| 56. | Lake Stevens | 9.9% | 20.7%(-10.8)#56 | 24.1%(-14.2)#2,382 |
| 57. | Northport | 10.0% | 20.7%(-10.7)#57 | 24.1%(-14.1)#2,459 |
| 58. | Edgewood | 10.2% | 20.7%(-10.5)#58 | 24.1%(-13.8)#2,523 |
| 59. | Tracyton | 10.3% | 20.7%(-10.4)#59 | 24.1%(-13.8)#2,546 |
| 60. | Burlington | 10.7% | 20.7%(-10.0)#60 | 24.1%(-13.4)#2,725 |
| 61. | Lake Forest Park | 10.7% | 20.7%(-10.0)#61 | 24.1%(-13.4)#2,728 |
| 62. | Hazel Dell | 10.7% | 20.7%(-10.0)#62 | 24.1%(-13.4)#2,744 |
| 63. | Mercer Island | 10.7% | 20.7%(-10.00)#63 | 24.1%(-13.3)#2,749 |
| 64. | Clyde Hill | 11.1% | 20.7%(-9.63)#64 | 24.1%(-13.0)#2,859 |
| 65. | Gold Bar | 11.1% | 20.7%(-9.63)#65 | 24.1%(-13.0)#2,861 |
| 66. | Bingen | 11.1% | 20.7%(-9.63)#66 | 24.1%(-13.0)#2,877 |
| 67. | Montesano | 11.2% | 20.7%(-9.59)#67 | 24.1%(-12.9)#2,931 |
| 68. | Bothell East | 11.2% | 20.7%(-9.56)#68 | 24.1%(-12.9)#2,933 |
| 69. | Covington | 11.5% | 20.7%(-9.20)#69 | 24.1%(-12.5)#3,036 |
| 70. | Ritzville | 11.5% | 20.7%(-9.20)#70 | 24.1%(-12.5)#3,040 |
| 71. | Waller | 11.7% | 20.7%(-9.07)#71 | 24.1%(-12.4)#3,090 |
| 72. | Fife | 11.7% | 20.7%(-9.03)#72 | 24.1%(-12.4)#3,107 |
| 73. | Port Angeles East | 11.8% | 20.7%(-8.94)#73 | 24.1%(-12.3)#3,158 |
| 74. | Camas | 12.4% | 20.7%(-8.36)#74 | 24.1%(-11.7)#3,352 |
| 75. | Ridgefield | 12.5% | 20.7%(-8.28)#75 | 24.1%(-11.6)#3,377 |
| 76. | Dayton | 12.5% | 20.7%(-8.24)#76 | 24.1%(-11.6)#3,385 |
| 77. | Redmond | 12.6% | 20.7%(-8.16)#77 | 24.1%(-11.5)#3,473 |
| 78. | Milton | 12.6% | 20.7%(-8.09)#78 | 24.1%(-11.4)#3,494 |
| 79. | Snohomish | 12.8% | 20.7%(-7.93)#79 | 24.1%(-11.3)#3,551 |
| 80. | Woodinville | 12.8% | 20.7%(-7.92)#80 | 24.1%(-11.3)#3,552 |
| 81. | Mill Creek East | 12.9% | 20.7%(-7.80)#81 | 24.1%(-11.1)#3,599 |
| 82. | Mcmillin | 13.0% | 20.7%(-7.78)#82 | 24.1%(-11.1)#3,613 |
| 83. | Shoreline | 13.0% | 20.7%(-7.70)#83 | 24.1%(-11.0)#3,630 |
| 84. | Nisqually Indian Community | 13.5% | 20.7%(-7.23)#84 | 24.1%(-10.6)#3,844 |
| 85. | Ellensburg | 13.5% | 20.7%(-7.22)#85 | 24.1%(-10.6)#3,848 |
| 86. | Shadow Lake | 13.6% | 20.7%(-7.16)#86 | 24.1%(-10.5)#3,869 |
| 87. | Carbonado | 13.6% | 20.7%(-7.10)#87 | 24.1%(-10.4)#3,897 |
| 88. | Central Park | 13.8% | 20.7%(-6.92)#88 | 24.1%(-10.3)#3,958 |
| 89. | Brush Prairie | 14.0% | 20.7%(-6.74)#89 | 24.1%(-10.1)#4,025 |
| 90. | Gleed | 14.2% | 20.7%(-6.55)#90 | 24.1%(-9.88)#4,082 |
| 91. | Ferndale | 14.3% | 20.7%(-6.45)#91 | 24.1%(-9.79)#4,101 |
| 92. | Brinnon | 14.3% | 20.7%(-6.45)#92 | 24.1%(-9.79)#4,135 |
| 93. | Creston | 14.3% | 20.7%(-6.45)#93 | 24.1%(-9.79)#4,195 |
| 94. | Mill Creek | 14.3% | 20.7%(-6.43)#94 | 24.1%(-9.77)#4,214 |
| 95. | West Richland | 14.4% | 20.7%(-6.36)#95 | 24.1%(-9.70)#4,226 |
| 96. | Suquamish | 14.4% | 20.7%(-6.31)#96 | 24.1%(-9.65)#4,237 |
| 97. | Graham | 14.5% | 20.7%(-6.24)#97 | 24.1%(-9.57)#4,257 |
| 98. | South Hill | 14.6% | 20.7%(-6.17)#98 | 24.1%(-9.51)#4,281 |
| 99. | Midland | 14.6% | 20.7%(-6.13)#99 | 24.1%(-9.47)#4,299 |
| 100. | Port Angeles | 14.7% | 20.7%(-6.09)#100 | 24.1%(-9.43)#4,326 |
Common Questions
What are the Top 10 Cities with the Lowest Poverty Level Among Single Females in Washington?
Top 10 Cities with the Lowest Poverty Level Among Single Females in Washington are:
#1
1.7%
#2
2.1%
#3
2.3%
#4
2.5%
#5
3.0%
#6
3.4%
#7
3.5%
#8
3.6%
#9
3.6%
#10
3.9%
What city has the Lowest Poverty Level Among Single Females in Washington?
Snoqualmie has the Lowest Poverty Level Among Single Females in Washington with 1.7%.
What is the Poverty Level Among Single Females in the State of Washington?
Poverty Level Among Single Females in Washington is 20.7%.
What is the Poverty Level Among Single Females in the United States?
Poverty Level Among Single Females in the United States is 24.1%.