Colfax, WA Map & Demographics
Colfax Map
Colfax Overview
$35,330
PER CAPITA INCOME
$77,750
AVG FAMILY INCOME
$54,659
AVG HOUSEHOLD INCOME
41.1%
WAGE / INCOME GAP [ % ]
58.9¢/ $1
WAGE / INCOME GAP [ $ ]
0.51
INEQUALITY / GINI INDEX
2,799
TOTAL POPULATION
1,333
MALE POPULATION
1,466
FEMALE POPULATION
90.93
MALES / 100 FEMALES
109.98
FEMALES / 100 MALES
45.8
MEDIAN AGE
3.1
AVG FAMILY SIZE
2.3
AVG HOUSEHOLD SIZE
1,343
LABOR FORCE [ PEOPLE ]
56.9%
PERCENT IN LABOR FORCE
3.7%
UNEMPLOYMENT RATE
Colfax Zip Codes
Colfax Area Codes
Income in Colfax
Income Overview in Colfax
Per Capita Income in Colfax is $35,330, while median incomes of families and households are $77,750 and $54,659 respectively.
| Characteristic | Number | Measure |
| Per Capita Income | 2,799 | $35,330 |
| Median Family Income | 549 | $77,750 |
| Mean Family Income | 549 | $88,911 |
| Median Household Income | 1,166 | $54,659 |
| Mean Household Income | 1,166 | $79,343 |
| Income Deficit | 549 | $0 |
| Wage / Income Gap (%) | 2,799 | 41.14% |
| Wage / Income Gap ($) | 2,799 | 58.86¢ per $1 |
| Gini / Inequality Index | 2,799 | 0.51 |
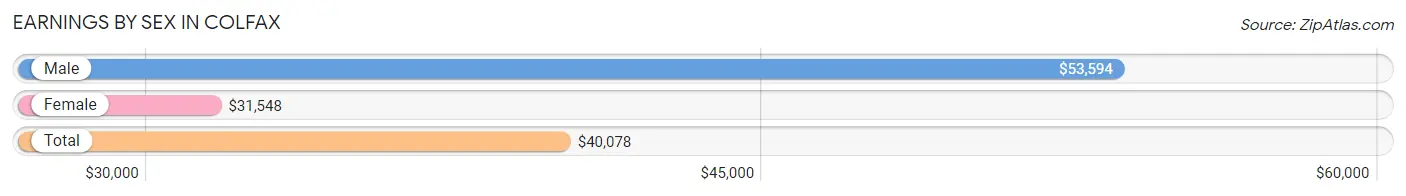
Earnings by Sex in Colfax
Average Earnings in Colfax are $40,078, $53,594 for men and $31,548 for women, a difference of 41.1%.
| Sex | Number | Average Earnings |
| Male | 749 (50.6%) | $53,594 |
| Female | 730 (49.4%) | $31,548 |
| Total | 1,479 (100.0%) | $40,078 |
Earnings by Sex by Income Bracket in Colfax
The most common earnings brackets in Colfax are $100,000+ for men (149 | 19.9%) and $30,000 to $34,999 for women (104 | 14.2%).
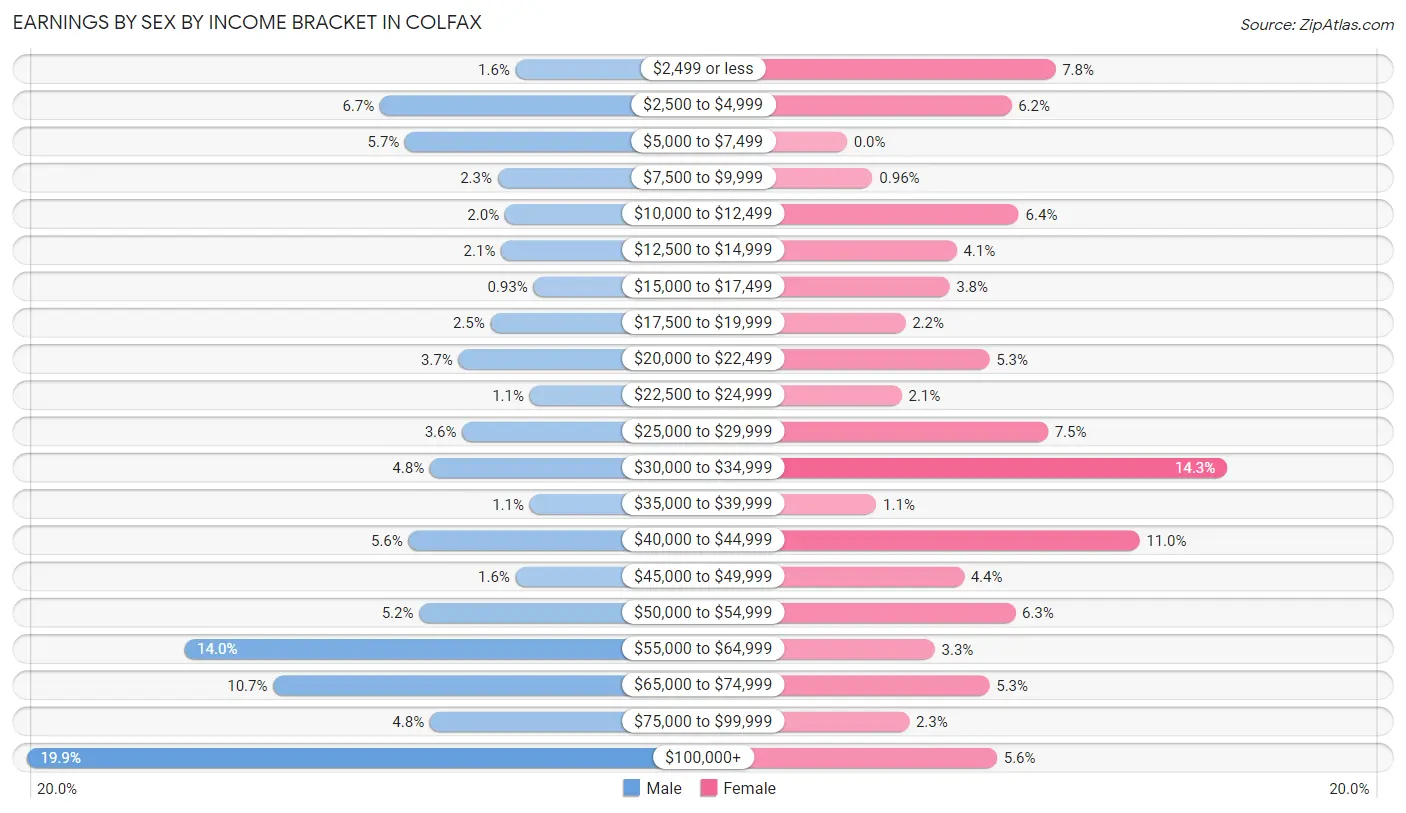
| Income | Male | Female |
| $2,499 or less | 12 (1.6%) | 57 (7.8%) |
| $2,500 to $4,999 | 50 (6.7%) | 45 (6.2%) |
| $5,000 to $7,499 | 43 (5.7%) | 0 (0.0%) |
| $7,500 to $9,999 | 17 (2.3%) | 7 (1.0%) |
| $10,000 to $12,499 | 15 (2.0%) | 47 (6.4%) |
| $12,500 to $14,999 | 16 (2.1%) | 30 (4.1%) |
| $15,000 to $17,499 | 7 (0.9%) | 28 (3.8%) |
| $17,500 to $19,999 | 19 (2.5%) | 16 (2.2%) |
| $20,000 to $22,499 | 28 (3.7%) | 39 (5.3%) |
| $22,500 to $24,999 | 8 (1.1%) | 15 (2.1%) |
| $25,000 to $29,999 | 27 (3.6%) | 55 (7.5%) |
| $30,000 to $34,999 | 36 (4.8%) | 104 (14.2%) |
| $35,000 to $39,999 | 8 (1.1%) | 8 (1.1%) |
| $40,000 to $44,999 | 42 (5.6%) | 80 (11.0%) |
| $45,000 to $49,999 | 12 (1.6%) | 32 (4.4%) |
| $50,000 to $54,999 | 39 (5.2%) | 46 (6.3%) |
| $55,000 to $64,999 | 105 (14.0%) | 24 (3.3%) |
| $65,000 to $74,999 | 80 (10.7%) | 39 (5.3%) |
| $75,000 to $99,999 | 36 (4.8%) | 17 (2.3%) |
| $100,000+ | 149 (19.9%) | 41 (5.6%) |
| Total | 749 (100.0%) | 730 (100.0%) |
Earnings by Sex by Educational Attainment in Colfax
Average earnings in Colfax are $57,500 for men and $32,863 for women, a difference of 42.8%. Men with an educational attainment of bachelor's degree enjoy the highest average annual earnings of $89,167, while those with high school diploma education earn the least with $33,011. Women with an educational attainment of graduate degree earn the most with the average annual earnings of $61,250, while those with college or associate's degree education have the smallest earnings of $30,822.
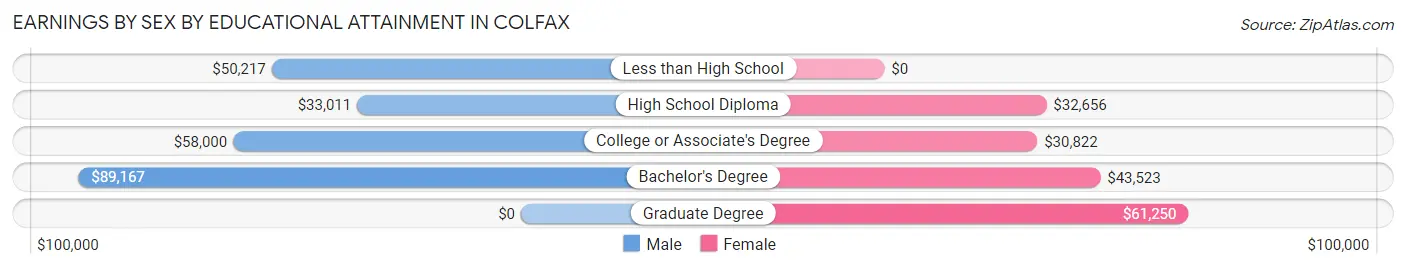
| Educational Attainment | Male Income | Female Income |
| Less than High School | $50,217 | $0 |
| High School Diploma | $33,011 | $32,656 |
| College or Associate's Degree | $58,000 | $30,822 |
| Bachelor's Degree | $89,167 | $43,523 |
| Graduate Degree | - | - |
| Total | $57,500 | $32,863 |
Family Income in Colfax
Family Income Brackets in Colfax
According to the Colfax family income data, there are 134 families falling into the $100,000 to $149,999 income range, which is the most common income bracket and makes up 24.4% of all families.
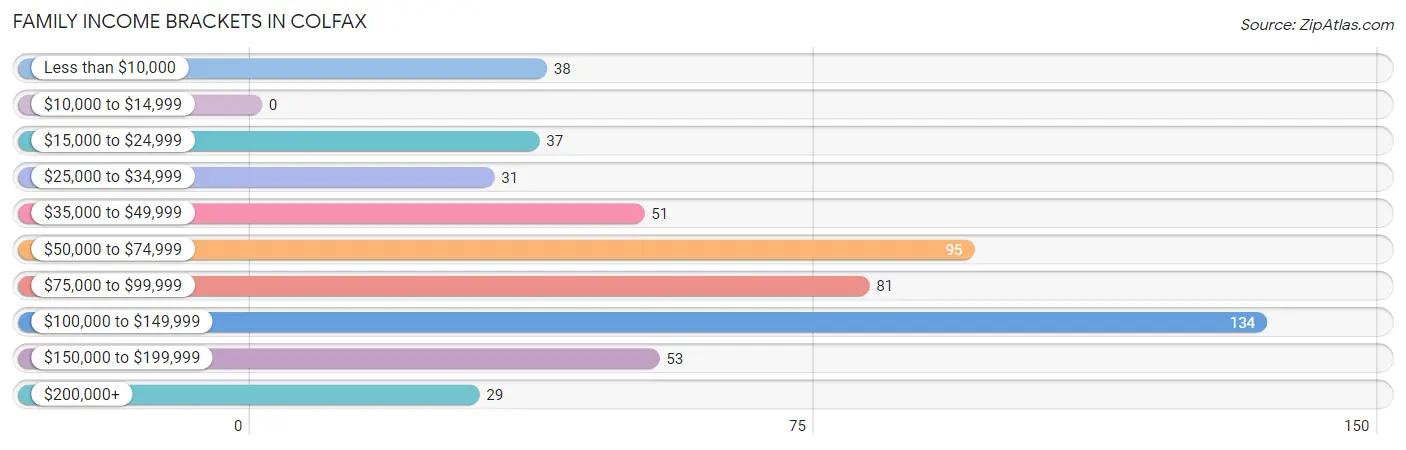
| Income Bracket | # Families | % Families |
| Less than $10,000 | 38 | 6.9% |
| $10,000 to $14,999 | 0 | 0.0% |
| $15,000 to $24,999 | 37 | 6.7% |
| $25,000 to $34,999 | 31 | 5.6% |
| $35,000 to $49,999 | 51 | 9.3% |
| $50,000 to $74,999 | 95 | 17.3% |
| $75,000 to $99,999 | 81 | 14.8% |
| $100,000 to $149,999 | 134 | 24.4% |
| $150,000 to $199,999 | 53 | 9.7% |
| $200,000+ | 29 | 5.3% |
Family Income by Famaliy Size in Colfax
4-person families (90 | 16.4%) account for the highest median family income in Colfax with $133,333 per family, while 3-person families (64 | 11.7%) have the highest median income of $36,343 per family member.
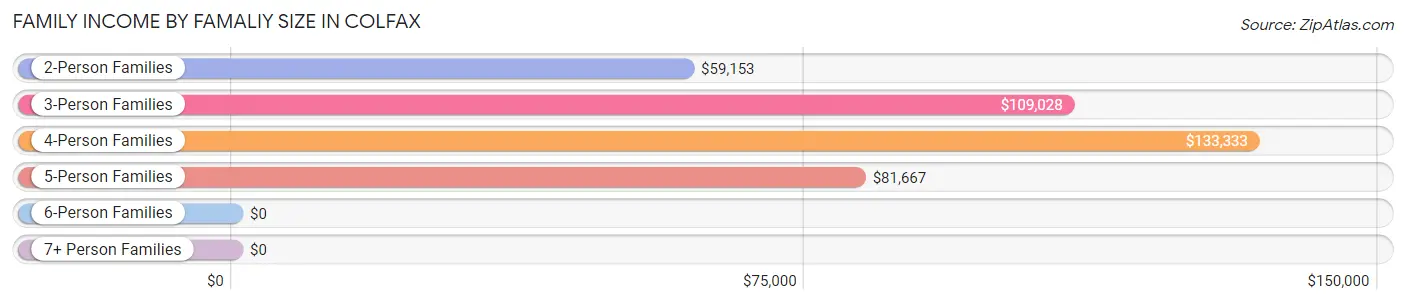
| Income Bracket | # Families | Median Income |
| 2-Person Families | 351 (63.9%) | $59,153 |
| 3-Person Families | 64 (11.7%) | $109,028 |
| 4-Person Families | 90 (16.4%) | $133,333 |
| 5-Person Families | 34 (6.2%) | $81,667 |
| 6-Person Families | 4 (0.7%) | $0 |
| 7+ Person Families | 6 (1.1%) | $0 |
| Total | 549 (100.0%) | $77,750 |
Family Income by Number of Earners in Colfax
The median family income in Colfax is $77,750, with families comprising 2 earners (208) having the highest median family income of $116,250, while families with 1 earner (216) have the lowest median family income of $37,171, accounting for 37.9% and 39.3% of families, respectively.
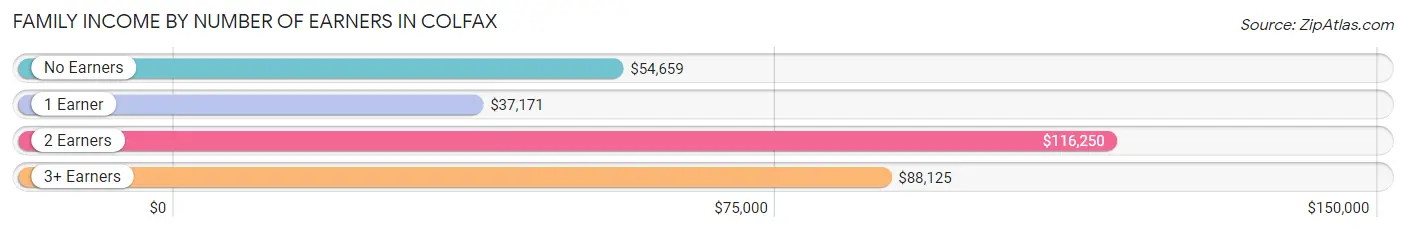
| Number of Earners | # Families | Median Income |
| No Earners | 81 (14.7%) | $54,659 |
| 1 Earner | 216 (39.3%) | $37,171 |
| 2 Earners | 208 (37.9%) | $116,250 |
| 3+ Earners | 44 (8.0%) | $88,125 |
| Total | 549 (100.0%) | $77,750 |
Household Income in Colfax
Household Income Brackets in Colfax
With 224 households falling in the category, the $50,000 to $74,999 income range is the most frequent in Colfax, accounting for 19.2% of all households. In contrast, only 31 households (2.7%) fall into the $10,000 to $14,999 income bracket, making it the least populous group.
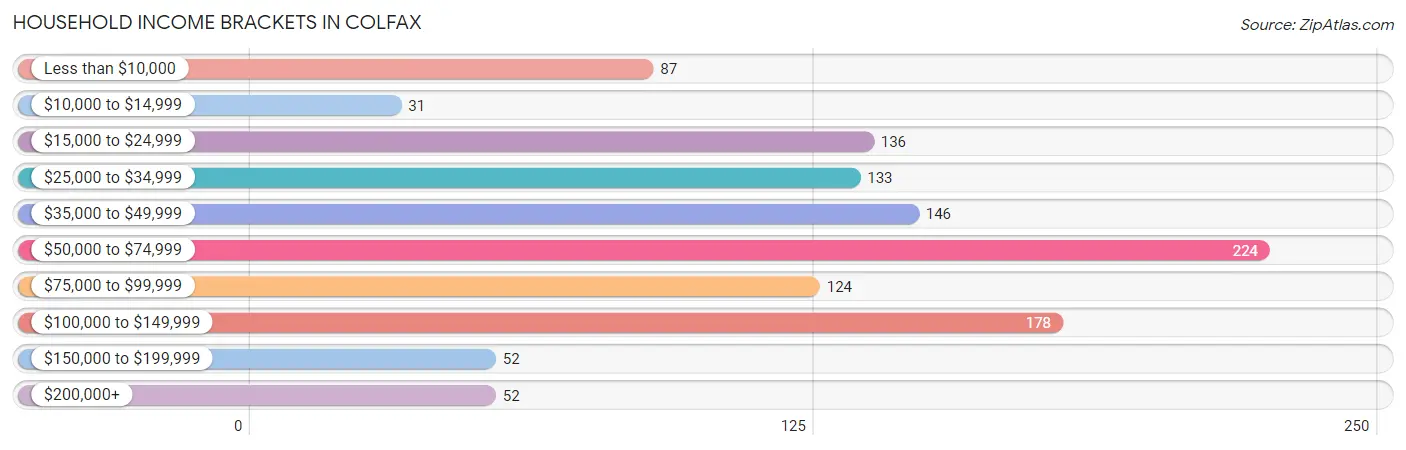
| Income Bracket | # Households | % Households |
| Less than $10,000 | 87 | 7.5% |
| $10,000 to $14,999 | 31 | 2.7% |
| $15,000 to $24,999 | 136 | 11.7% |
| $25,000 to $34,999 | 133 | 11.4% |
| $35,000 to $49,999 | 146 | 12.5% |
| $50,000 to $74,999 | 224 | 19.2% |
| $75,000 to $99,999 | 124 | 10.6% |
| $100,000 to $149,999 | 178 | 15.3% |
| $150,000 to $199,999 | 52 | 4.5% |
| $200,000+ | 52 | 4.5% |
Household Income by Householder Age in Colfax
The median household income in Colfax is $54,659, with the highest median household income of $87,250 found in the 25 to 44 years age bracket for the primary householder. A total of 318 households (27.3%) fall into this category. Meanwhile, the 15 to 24 years age bracket for the primary householder has the lowest median household income of $0, with 21 households (1.8%) in this group.
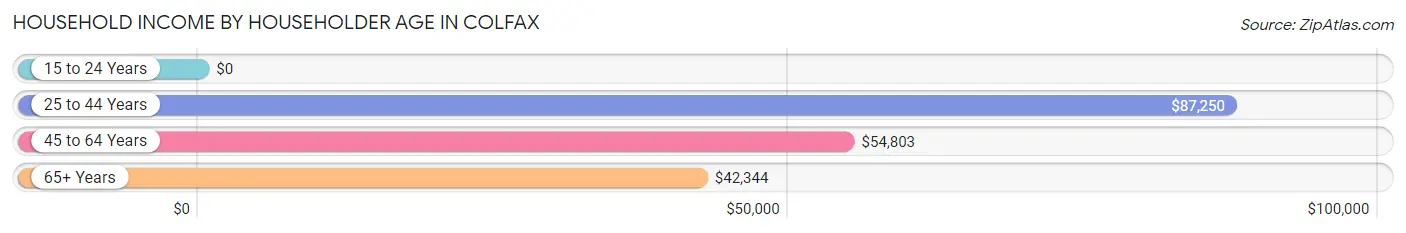
| Income Bracket | # Households | Median Income |
| 15 to 24 Years | 21 (1.8%) | $0 |
| 25 to 44 Years | 318 (27.3%) | $87,250 |
| 45 to 64 Years | 374 (32.1%) | $54,803 |
| 65+ Years | 453 (38.9%) | $42,344 |
| Total | 1,166 (100.0%) | $54,659 |
Poverty in Colfax
Income Below Poverty by Sex and Age in Colfax
With 14.5% poverty level for males and 11.4% for females among the residents of Colfax, 18 to 24 year old males and under 5 year old females are the most vulnerable to poverty, with 43 males (37.4%) and 74 females (74.8%) in their respective age groups living below the poverty level.
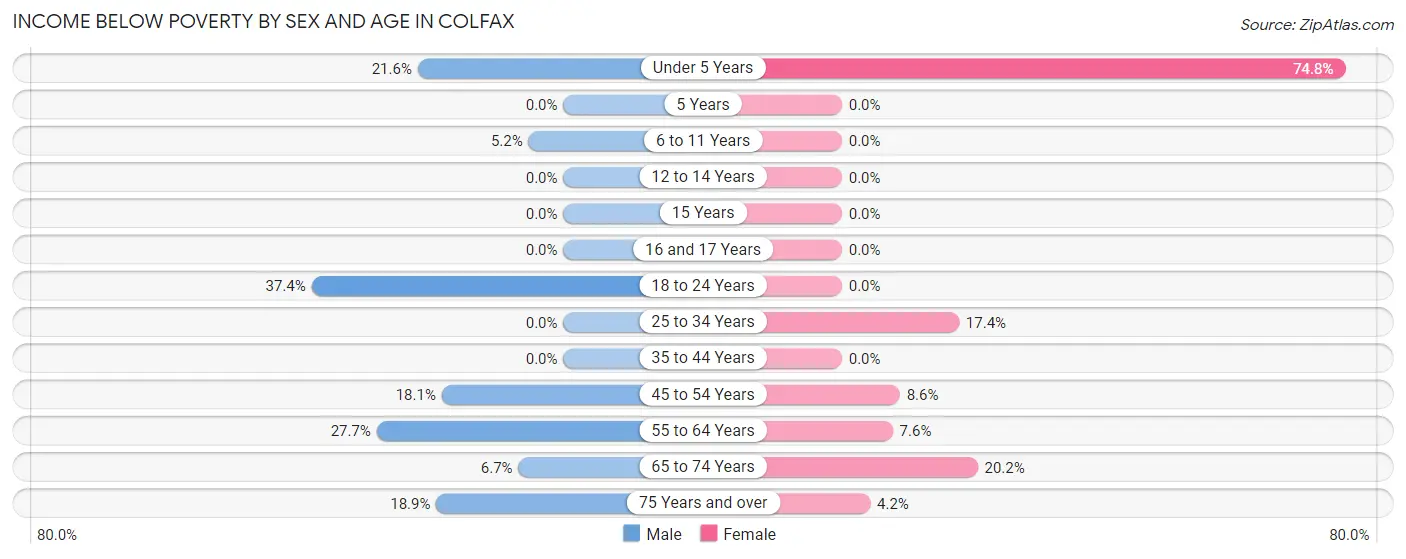
| Age Bracket | Male | Female |
| Under 5 Years | 8 (21.6%) | 74 (74.8%) |
| 5 Years | 0 (0.0%) | 0 (0.0%) |
| 6 to 11 Years | 6 (5.2%) | 0 (0.0%) |
| 12 to 14 Years | 0 (0.0%) | 0 (0.0%) |
| 15 Years | 0 (0.0%) | 0 (0.0%) |
| 16 and 17 Years | 0 (0.0%) | 0 (0.0%) |
| 18 to 24 Years | 43 (37.4%) | 0 (0.0%) |
| 25 to 34 Years | 0 (0.0%) | 24 (17.4%) |
| 35 to 44 Years | 0 (0.0%) | 0 (0.0%) |
| 45 to 54 Years | 26 (18.1%) | 8 (8.6%) |
| 55 to 64 Years | 84 (27.7%) | 21 (7.5%) |
| 65 to 74 Years | 10 (6.7%) | 26 (20.2%) |
| 75 Years and over | 10 (18.9%) | 10 (4.2%) |
| Total | 187 (14.5%) | 163 (11.4%) |
Income Above Poverty by Sex and Age in Colfax
According to the poverty statistics in Colfax, males aged 12 to 14 years and females aged 5 years are the age groups that are most secure financially, with 100.0% of males and 100.0% of females in these age groups living above the poverty line.
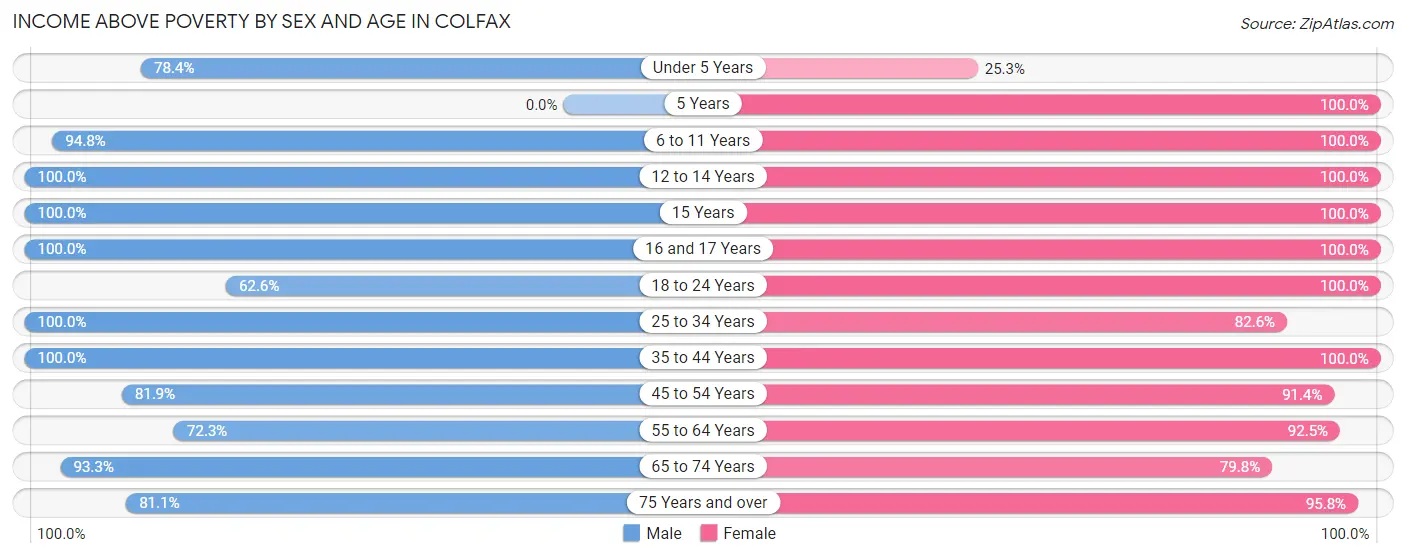
| Age Bracket | Male | Female |
| Under 5 Years | 29 (78.4%) | 25 (25.3%) |
| 5 Years | 0 (0.0%) | 14 (100.0%) |
| 6 to 11 Years | 110 (94.8%) | 105 (100.0%) |
| 12 to 14 Years | 20 (100.0%) | 36 (100.0%) |
| 15 Years | 5 (100.0%) | 7 (100.0%) |
| 16 and 17 Years | 28 (100.0%) | 40 (100.0%) |
| 18 to 24 Years | 72 (62.6%) | 34 (100.0%) |
| 25 to 34 Years | 122 (100.0%) | 114 (82.6%) |
| 35 to 44 Years | 195 (100.0%) | 223 (100.0%) |
| 45 to 54 Years | 118 (81.9%) | 85 (91.4%) |
| 55 to 64 Years | 219 (72.3%) | 257 (92.4%) |
| 65 to 74 Years | 140 (93.3%) | 103 (79.8%) |
| 75 Years and over | 43 (81.1%) | 228 (95.8%) |
| Total | 1,101 (85.5%) | 1,271 (88.6%) |
Income Below Poverty Among Married-Couple Families in Colfax
The poverty statistics for married-couple families in Colfax show that 4.9% or 20 of the total 408 families live below the poverty line. Families with no children have the highest poverty rate of 8.0%, comprising of 20 families. On the other hand, families with 1 or 2 children have the lowest poverty rate of 0.0%, which includes 0 families.
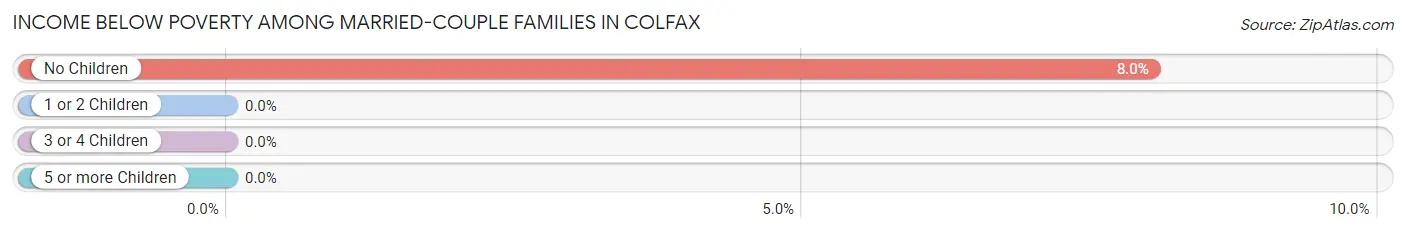
| Children | Above Poverty | Below Poverty |
| No Children | 229 (92.0%) | 20 (8.0%) |
| 1 or 2 Children | 136 (100.0%) | 0 (0.0%) |
| 3 or 4 Children | 23 (100.0%) | 0 (0.0%) |
| 5 or more Children | 0 (0.0%) | 0 (0.0%) |
| Total | 388 (95.1%) | 20 (4.9%) |
Income Below Poverty Among Single-Parent Households in Colfax
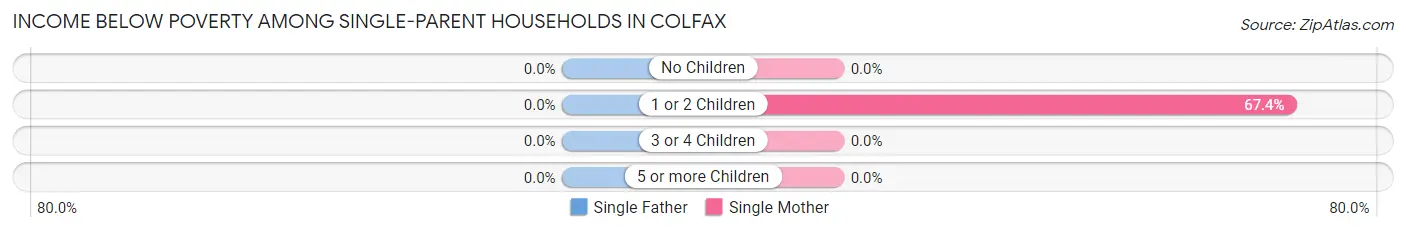
| Children | Single Father | Single Mother |
| No Children | 0 (0.0%) | 0 (0.0%) |
| 1 or 2 Children | 0 (0.0%) | 29 (67.4%) |
| 3 or 4 Children | 0 (0.0%) | 0 (0.0%) |
| 5 or more Children | 0 (0.0%) | 0 (0.0%) |
| Total | 0 (0.0%) | 29 (25.9%) |
Income Below Poverty Among Married-Couple vs Single-Parent Households in Colfax
The poverty data for Colfax shows that 20 of the married-couple family households (4.9%) and 29 of the single-parent households (20.6%) are living below the poverty level. Within the married-couple family households, those with no children have the highest poverty rate, with 20 households (8.0%) falling below the poverty line. Among the single-parent households, those with 1 or 2 children have the highest poverty rate, with 29 household (52.7%) living below poverty.
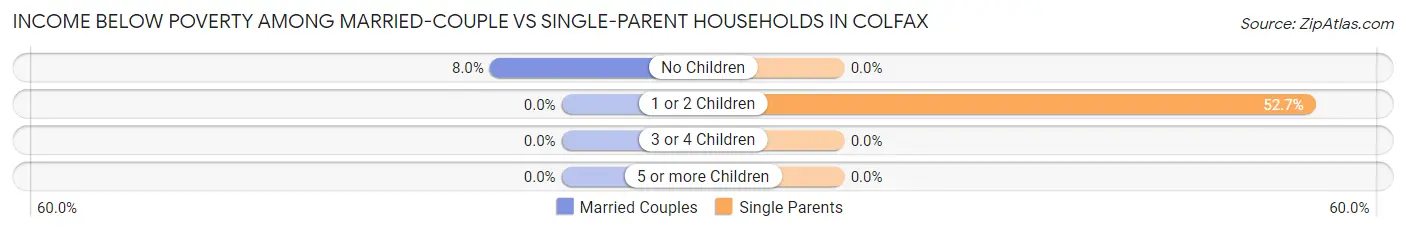
| Children | Married-Couple Families | Single-Parent Households |
| No Children | 20 (8.0%) | 0 (0.0%) |
| 1 or 2 Children | 0 (0.0%) | 29 (52.7%) |
| 3 or 4 Children | 0 (0.0%) | 0 (0.0%) |
| 5 or more Children | 0 (0.0%) | 0 (0.0%) |
| Total | 20 (4.9%) | 29 (20.6%) |
Race in Colfax
The most populous races in Colfax are White / Caucasian (2,432 | 86.9%), Two or more Races (229 | 8.2%), and Hispanic or Latino (222 | 7.9%).
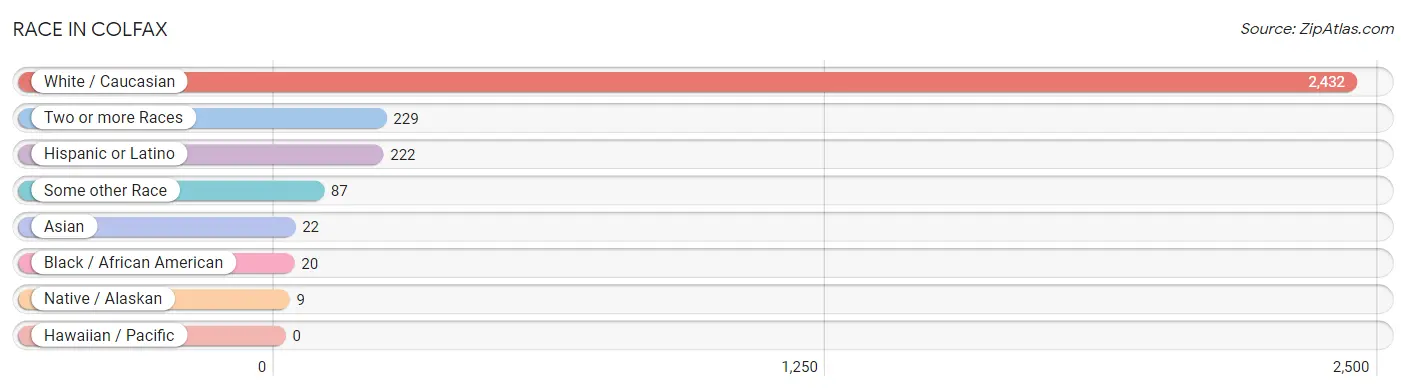
| Race | # Population | % Population |
| Asian | 22 | 0.8% |
| Black / African American | 20 | 0.7% |
| Hawaiian / Pacific | 0 | 0.0% |
| Hispanic or Latino | 222 | 7.9% |
| Native / Alaskan | 9 | 0.3% |
| White / Caucasian | 2,432 | 86.9% |
| Two or more Races | 229 | 8.2% |
| Some other Race | 87 | 3.1% |
| Total | 2,799 | 100.0% |
Ancestry in Colfax
The most populous ancestries reported in Colfax are German (701 | 25.0%), Irish (260 | 9.3%), English (236 | 8.4%), Norwegian (150 | 5.4%), and Korean (142 | 5.1%), together accounting for 53.2% of all Colfax residents.
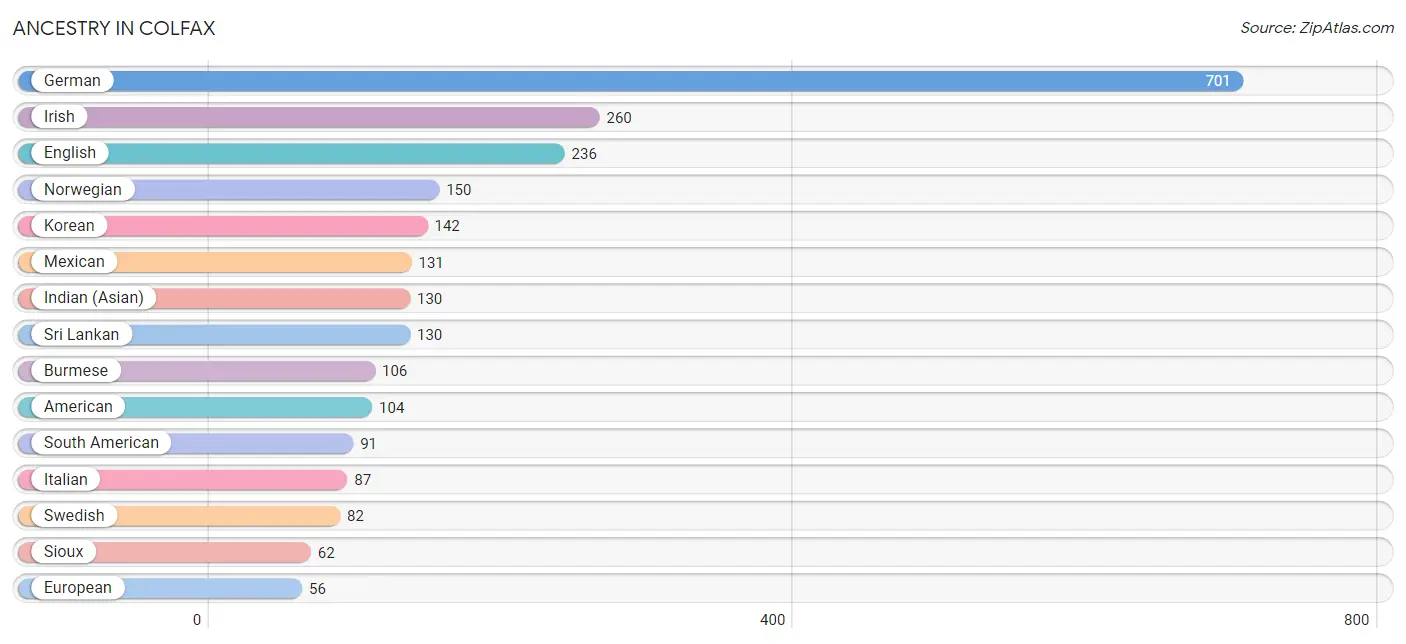
| Ancestry | # Population | % Population |
| American | 104 | 3.7% |
| Apache | 34 | 1.2% |
| Argentinean | 22 | 0.8% |
| Bhutanese | 46 | 1.6% |
| Bolivian | 35 | 1.3% |
| British | 16 | 0.6% |
| Burmese | 106 | 3.8% |
| Chilean | 34 | 1.2% |
| Croatian | 20 | 0.7% |
| Czechoslovakian | 3 | 0.1% |
| Danish | 37 | 1.3% |
| Dutch | 35 | 1.3% |
| English | 236 | 8.4% |
| European | 56 | 2.0% |
| Finnish | 29 | 1.0% |
| French | 36 | 1.3% |
| French American Indian | 5 | 0.2% |
| French Canadian | 10 | 0.4% |
| German | 701 | 25.0% |
| Hopi | 12 | 0.4% |
| Indian (Asian) | 130 | 4.6% |
| Irish | 260 | 9.3% |
| Italian | 87 | 3.1% |
| Japanese | 39 | 1.4% |
| Korean | 142 | 5.1% |
| Mexican | 131 | 4.7% |
| Native Hawaiian | 22 | 0.8% |
| Northern European | 6 | 0.2% |
| Norwegian | 150 | 5.4% |
| Pakistani | 10 | 0.4% |
| Polish | 12 | 0.4% |
| Portuguese | 17 | 0.6% |
| Pueblo | 22 | 0.8% |
| Russian | 27 | 1.0% |
| Scandinavian | 8 | 0.3% |
| Scotch-Irish | 40 | 1.4% |
| Scottish | 48 | 1.7% |
| Serbian | 7 | 0.3% |
| Sioux | 62 | 2.2% |
| South American | 91 | 3.3% |
| Sri Lankan | 130 | 4.6% |
| Swedish | 82 | 2.9% |
| Swiss | 10 | 0.4% |
| Thai | 23 | 0.8% |
| Welsh | 53 | 1.9% | View All 45 Rows |
Immigrants in Colfax
The most numerous immigrant groups reported in Colfax came from Asia (78 | 2.8%), Eastern Asia (56 | 2.0%), Japan (56 | 2.0%), South Eastern Asia (22 | 0.8%), and Europe (14 | 0.5%), together accounting for 8.1% of all Colfax residents.
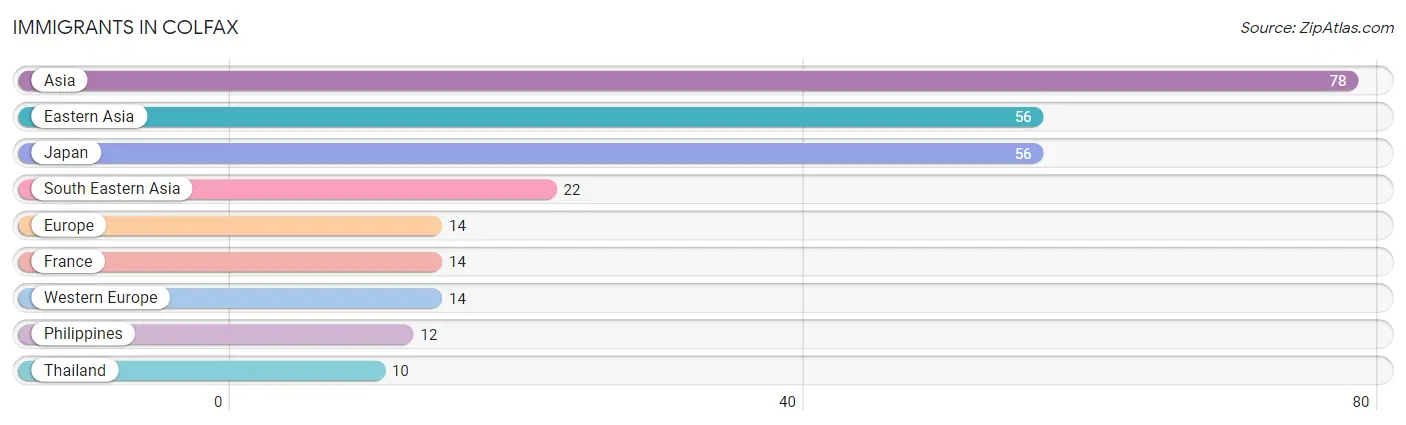
| Immigration Origin | # Population | % Population |
| Asia | 78 | 2.8% |
| Eastern Asia | 56 | 2.0% |
| Europe | 14 | 0.5% |
| France | 14 | 0.5% |
| Japan | 56 | 2.0% |
| Philippines | 12 | 0.4% |
| South Eastern Asia | 22 | 0.8% |
| Thailand | 10 | 0.4% |
| Western Europe | 14 | 0.5% | View All 9 Rows |
Sex and Age in Colfax
Sex and Age in Colfax
The most populous age groups in Colfax are 60 to 64 Years (171 | 12.8%) for men and 60 to 64 Years (195 | 13.3%) for women.
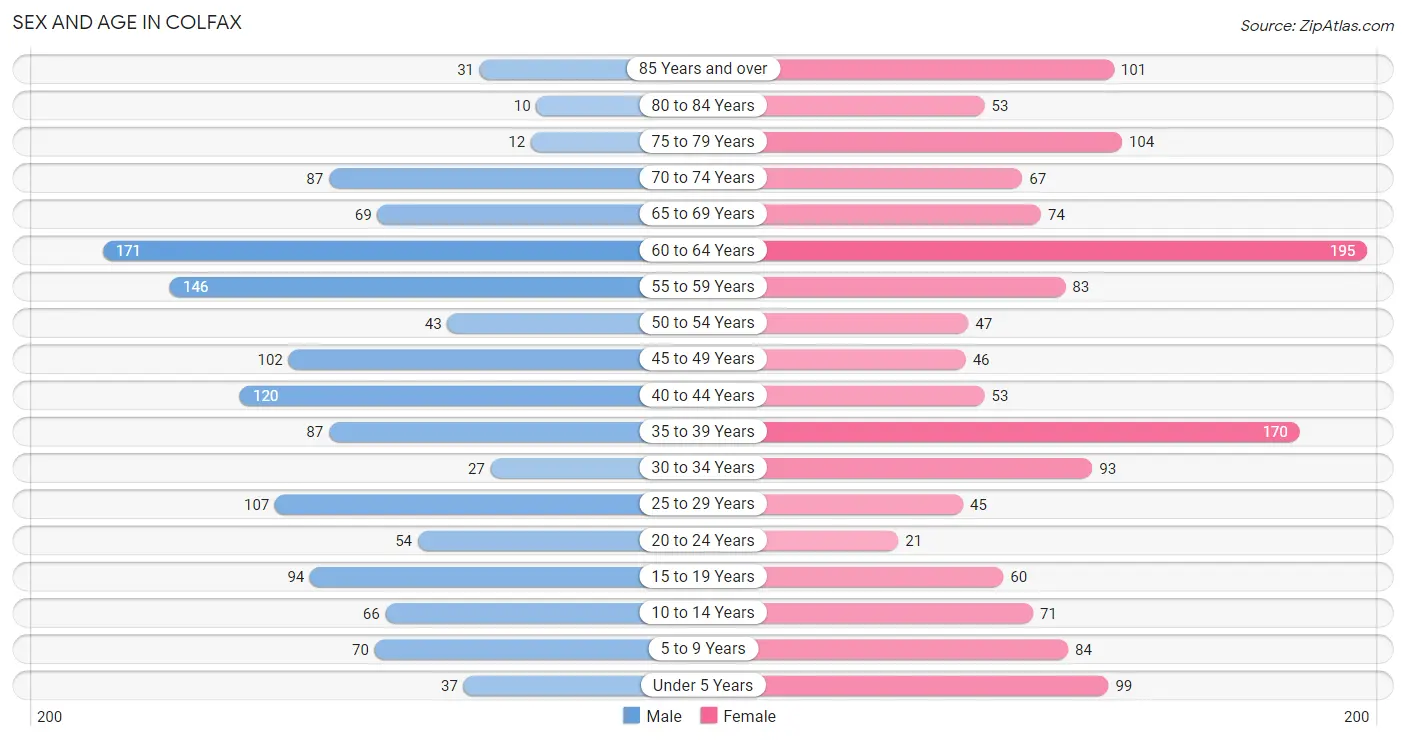
| Age Bracket | Male | Female |
| Under 5 Years | 37 (2.8%) | 99 (6.8%) |
| 5 to 9 Years | 70 (5.2%) | 84 (5.7%) |
| 10 to 14 Years | 66 (5.0%) | 71 (4.8%) |
| 15 to 19 Years | 94 (7.0%) | 60 (4.1%) |
| 20 to 24 Years | 54 (4.1%) | 21 (1.4%) |
| 25 to 29 Years | 107 (8.0%) | 45 (3.1%) |
| 30 to 34 Years | 27 (2.0%) | 93 (6.3%) |
| 35 to 39 Years | 87 (6.5%) | 170 (11.6%) |
| 40 to 44 Years | 120 (9.0%) | 53 (3.6%) |
| 45 to 49 Years | 102 (7.6%) | 46 (3.1%) |
| 50 to 54 Years | 43 (3.2%) | 47 (3.2%) |
| 55 to 59 Years | 146 (11.0%) | 83 (5.7%) |
| 60 to 64 Years | 171 (12.8%) | 195 (13.3%) |
| 65 to 69 Years | 69 (5.2%) | 74 (5.1%) |
| 70 to 74 Years | 87 (6.5%) | 67 (4.6%) |
| 75 to 79 Years | 12 (0.9%) | 104 (7.1%) |
| 80 to 84 Years | 10 (0.7%) | 53 (3.6%) |
| 85 Years and over | 31 (2.3%) | 101 (6.9%) |
| Total | 1,333 (100.0%) | 1,466 (100.0%) |
Families and Households in Colfax
Median Family Size in Colfax
The median family size in Colfax is 3.09 persons per family, with single female/mother families (112 | 20.4%) accounting for the largest median family size of 3.17 persons per family. On the other hand, single male/father families (29 | 5.3%) represent the smallest median family size with 2.21 persons per family.
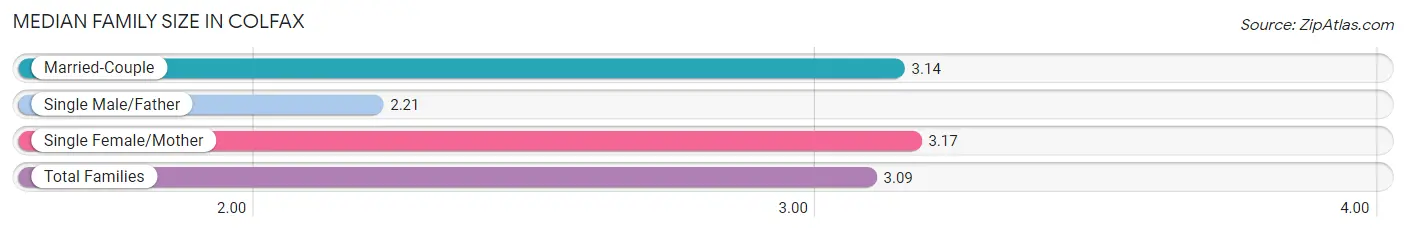
| Family Type | # Families | Family Size |
| Married-Couple | 408 (74.3%) | 3.14 |
| Single Male/Father | 29 (5.3%) | 2.21 |
| Single Female/Mother | 112 (20.4%) | 3.17 |
| Total Families | 549 (100.0%) | 3.09 |
Median Household Size in Colfax
The median household size in Colfax is 2.33 persons per household, with single female/mother households (112 | 9.6%) accounting for the largest median household size of 3.25 persons per household. non-family households (617 | 52.9%) represent the smallest median household size with 1.61 persons per household.
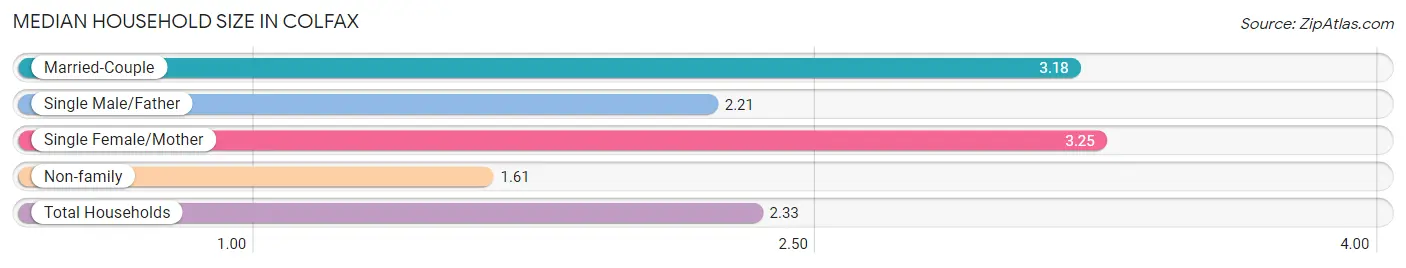
| Household Type | # Households | Household Size |
| Married-Couple | 408 (35.0%) | 3.18 |
| Single Male/Father | 29 (2.5%) | 2.21 |
| Single Female/Mother | 112 (9.6%) | 3.25 |
| Non-family | 617 (52.9%) | 1.61 |
| Total Households | 1,166 (100.0%) | 2.33 |
Household Size by Marriage Status in Colfax
Out of a total of 1,166 households in Colfax, 549 (47.1%) are family households, while 617 (52.9%) are nonfamily households. The most numerous type of family households are 2-person households, comprising 340, and the most common type of nonfamily households are 1-person households, comprising 548.
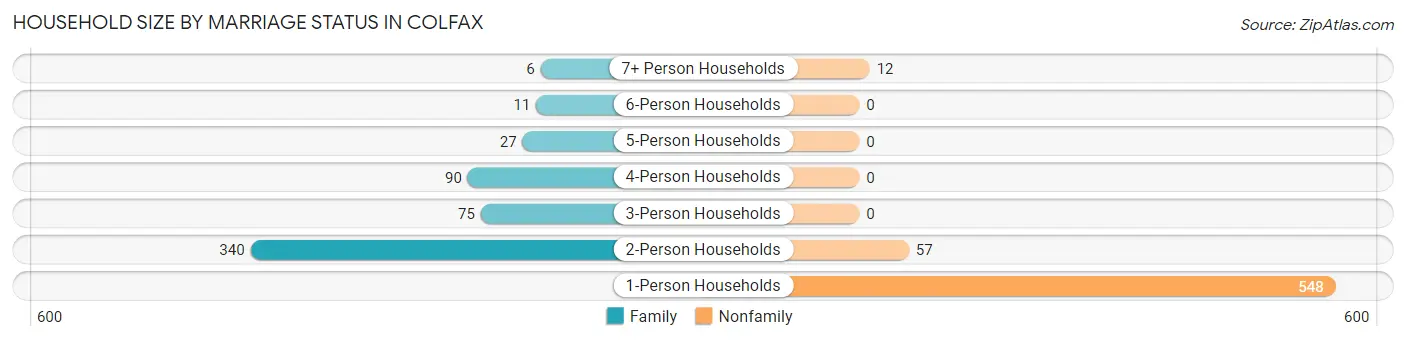
| Household Size | Family Households | Nonfamily Households |
| 1-Person Households | - | 548 (47.0%) |
| 2-Person Households | 340 (29.2%) | 57 (4.9%) |
| 3-Person Households | 75 (6.4%) | 0 (0.0%) |
| 4-Person Households | 90 (7.7%) | 0 (0.0%) |
| 5-Person Households | 27 (2.3%) | 0 (0.0%) |
| 6-Person Households | 11 (0.9%) | 0 (0.0%) |
| 7+ Person Households | 6 (0.5%) | 12 (1.0%) |
| Total | 549 (47.1%) | 617 (52.9%) |
Female Fertility in Colfax
Fertility by Age in Colfax
Average fertility rate in Colfax is 22.0 births per 1,000 women. Women in the age bracket of 20 to 34 years have the highest fertility rate with 63.0 births per 1,000 women. Women in the age bracket of 20 to 34 years acount for 90.9% of all women with births.
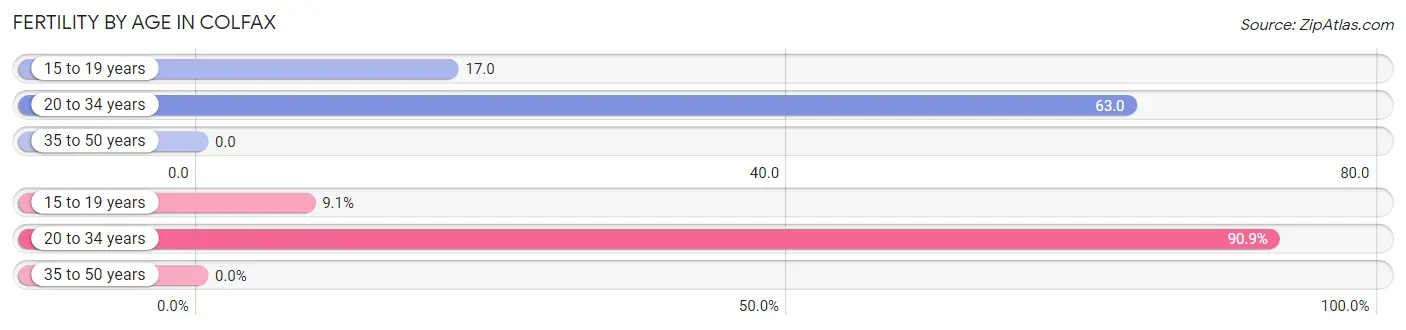
| Age Bracket | Women with Births | Births / 1,000 Women |
| 15 to 19 years | 1 (9.1%) | 17.0 |
| 20 to 34 years | 10 (90.9%) | 63.0 |
| 35 to 50 years | 0 (0.0%) | 0.0 |
| Total | 11 (100.0%) | 22.0 |
Fertility by Age by Marriage Status in Colfax
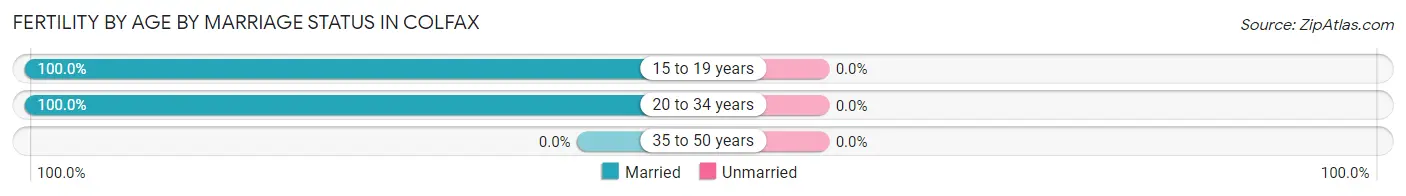
| Age Bracket | Married | Unmarried |
| 15 to 19 years | 1 (100.0%) | 0 (0.0%) |
| 20 to 34 years | 10 (100.0%) | 0 (0.0%) |
| 35 to 50 years | 0 (0.0%) | 0 (0.0%) |
| Total | 11 (100.0%) | 0 (0.0%) |
Fertility by Education in Colfax
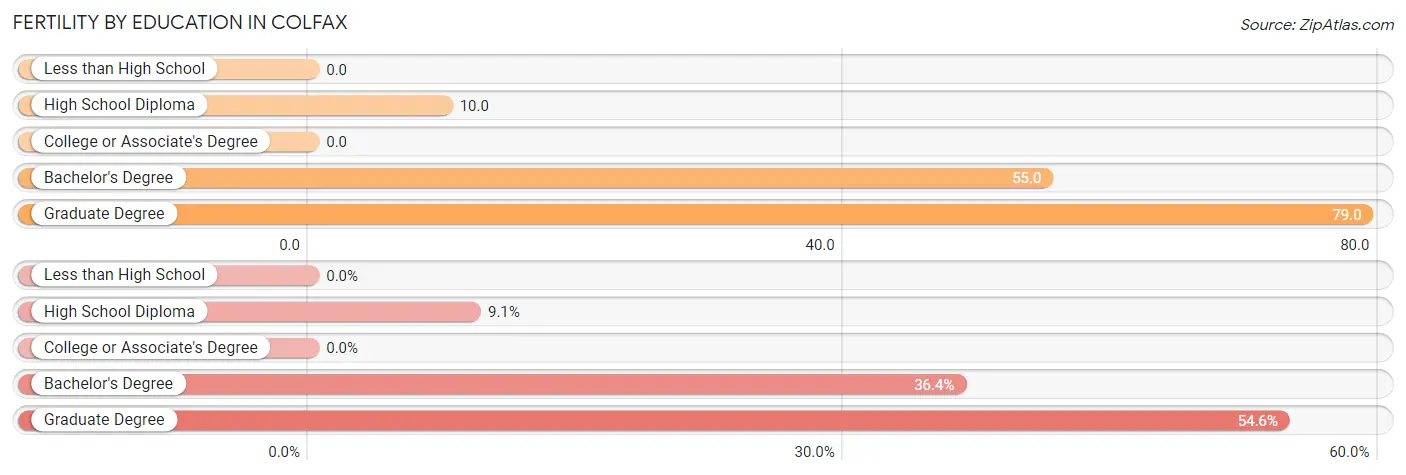
| Educational Attainment | Women with Births | Births / 1,000 Women |
| Less than High School | 0 (0.0%) | 0.0 |
| High School Diploma | 1 (9.1%) | 10.0 |
| College or Associate's Degree | 0 (0.0%) | 0.0 |
| Bachelor's Degree | 4 (36.4%) | 55.0 |
| Graduate Degree | 6 (54.5%) | 79.0 |
| Total | 11 (100.0%) | 22.0 |
Fertility by Education by Marriage Status in Colfax
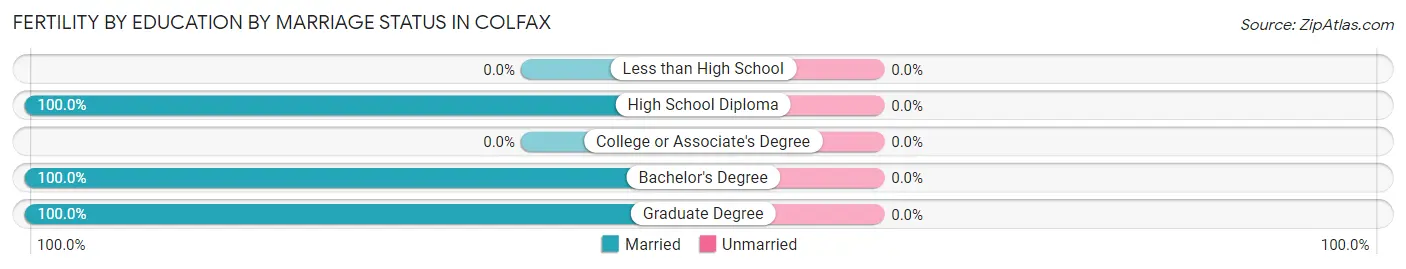
| Educational Attainment | Married | Unmarried |
| Less than High School | 0 (0.0%) | 0 (0.0%) |
| High School Diploma | 1 (100.0%) | 0 (0.0%) |
| College or Associate's Degree | 0 (0.0%) | 0 (0.0%) |
| Bachelor's Degree | 4 (100.0%) | 0 (0.0%) |
| Graduate Degree | 6 (100.0%) | 0 (0.0%) |
| Total | 11 (100.0%) | 0 (0.0%) |
Employment Characteristics in Colfax
Employment by Class of Employer in Colfax
Among the 1,259 employed individuals in Colfax, private company employees (671 | 53.3%), state government employees (180 | 14.3%), and not-for-profit organizations (163 | 13.0%) make up the most common classes of employment.
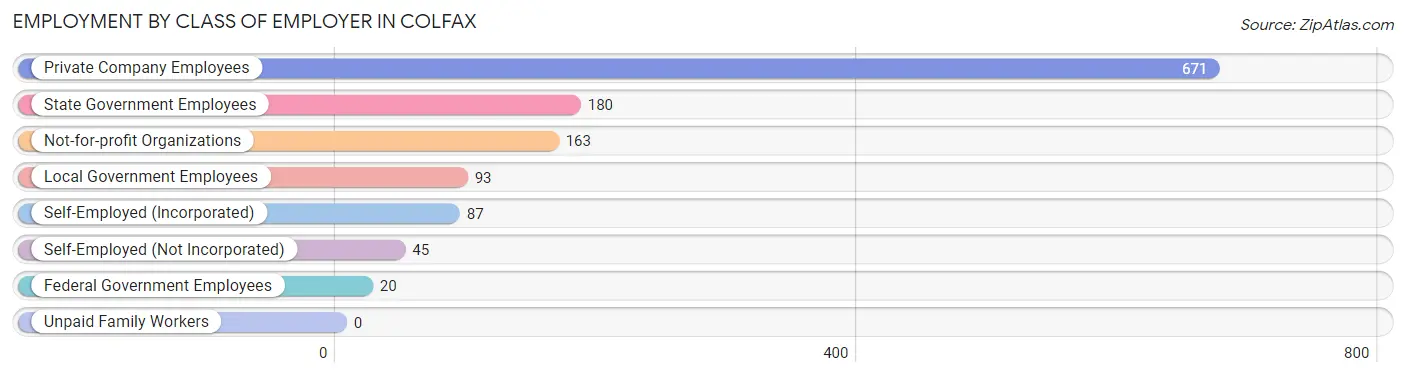
| Employer Class | # Employees | % Employees |
| Private Company Employees | 671 | 53.3% |
| Self-Employed (Incorporated) | 87 | 6.9% |
| Self-Employed (Not Incorporated) | 45 | 3.6% |
| Not-for-profit Organizations | 163 | 13.0% |
| Local Government Employees | 93 | 7.4% |
| State Government Employees | 180 | 14.3% |
| Federal Government Employees | 20 | 1.6% |
| Unpaid Family Workers | 0 | 0.0% |
| Total | 1,259 | 100.0% |
Employment Status by Age in Colfax
According to the labor force statistics for Colfax, out of the total population over 16 years of age (2,360), 56.9% or 1,343 individuals are in the labor force, with 3.7% or 50 of them unemployed. The age group with the highest labor force participation rate is 25 to 29 years, with 92.8% or 141 individuals in the labor force. Within the labor force, the 65 to 74 years age range has the highest percentage of unemployed individuals, with 26.3% or 15 of them being unemployed.
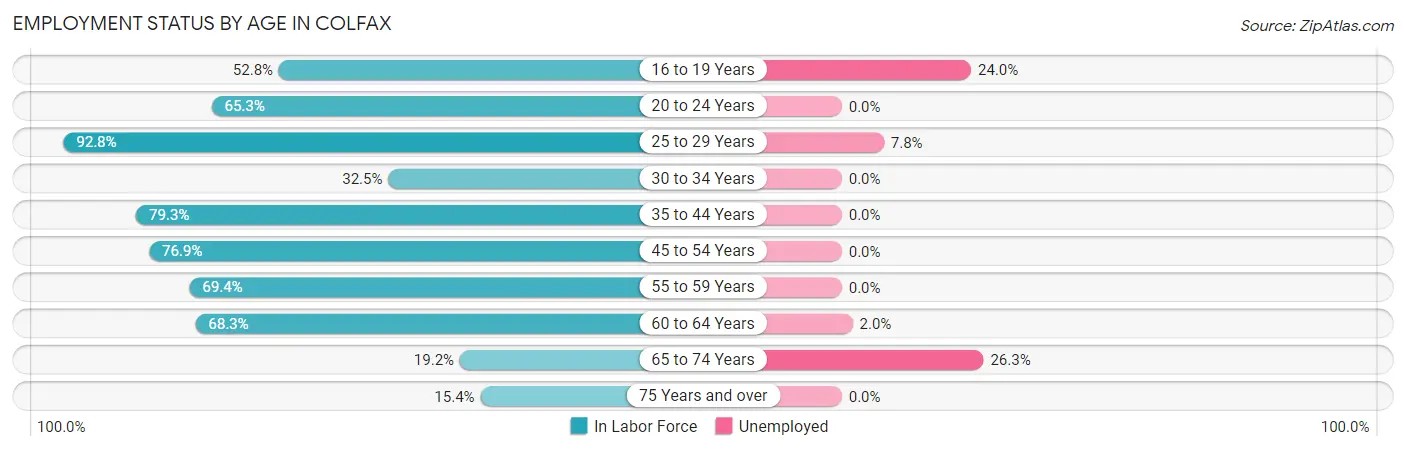
| Age Bracket | In Labor Force | Unemployed |
| 16 to 19 Years | 75 (52.8%) | 18 (24.0%) |
| 20 to 24 Years | 49 (65.3%) | 0 (0.0%) |
| 25 to 29 Years | 141 (92.8%) | 11 (7.8%) |
| 30 to 34 Years | 39 (32.5%) | 0 (0.0%) |
| 35 to 44 Years | 341 (79.3%) | 0 (0.0%) |
| 45 to 54 Years | 183 (76.9%) | 0 (0.0%) |
| 55 to 59 Years | 159 (69.4%) | 0 (0.0%) |
| 60 to 64 Years | 250 (68.3%) | 5 (2.0%) |
| 65 to 74 Years | 57 (19.2%) | 15 (26.3%) |
| 75 Years and over | 48 (15.4%) | 0 (0.0%) |
| Total | 1,343 (56.9%) | 50 (3.7%) |
Employment Status by Educational Attainment in Colfax
According to labor force statistics for Colfax, 72.5% of individuals (1,113) out of the total population between 25 and 64 years of age (1,535) are in the labor force, with 1.4% or 16 of them being unemployed. The group with the highest labor force participation rate are those with the educational attainment of bachelor's degree or higher, with 84.6% or 416 individuals in the labor force. Within the labor force, individuals with bachelor's degree or higher education have the highest percentage of unemployment, with 2.6% or 11 of them being unemployed.
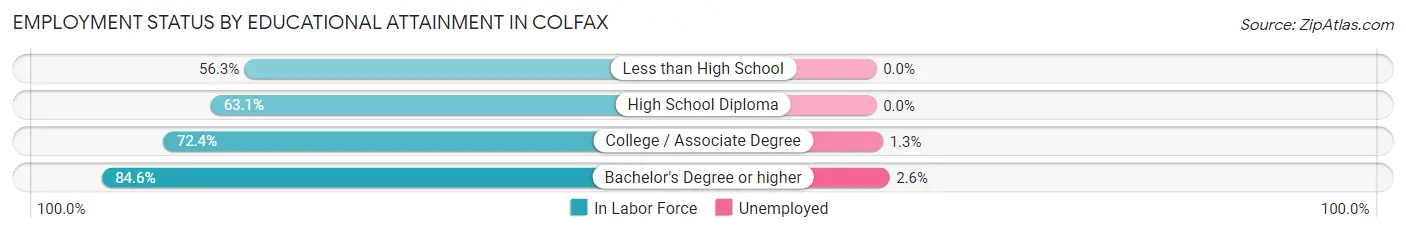
| Educational Attainment | In Labor Force | Unemployed |
| Less than High School | 72 (56.3%) | 0 (0.0%) |
| High School Diploma | 253 (63.1%) | 0 (0.0%) |
| College / Associate Degree | 372 (72.4%) | 7 (1.3%) |
| Bachelor's Degree or higher | 416 (84.6%) | 13 (2.6%) |
| Total | 1,113 (72.5%) | 21 (1.4%) |
Employment Occupations by Sex in Colfax
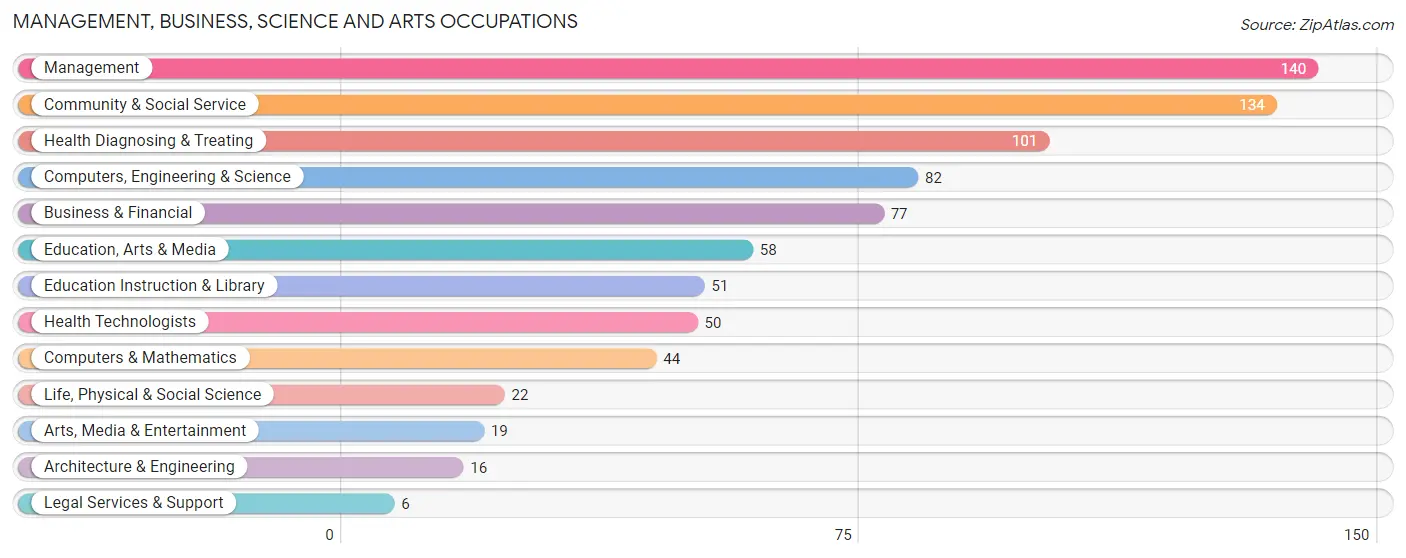
Management, Business, Science and Arts Occupations
The most common Management, Business, Science and Arts occupations in Colfax are Management (140 | 10.8%), Community & Social Service (134 | 10.4%), Health Diagnosing & Treating (101 | 7.8%), Computers, Engineering & Science (82 | 6.3%), and Business & Financial (77 | 6.0%).
Management, Business, Science and Arts Occupations by Sex
Within the Management, Business, Science and Arts occupations in Colfax, the most male-oriented occupations are Architecture & Engineering (100.0%), Life, Physical & Social Science (100.0%), and Computers, Engineering & Science (91.5%), while the most female-oriented occupations are Legal Services & Support (100.0%), Education Instruction & Library (92.2%), and Health Diagnosing & Treating (88.1%).
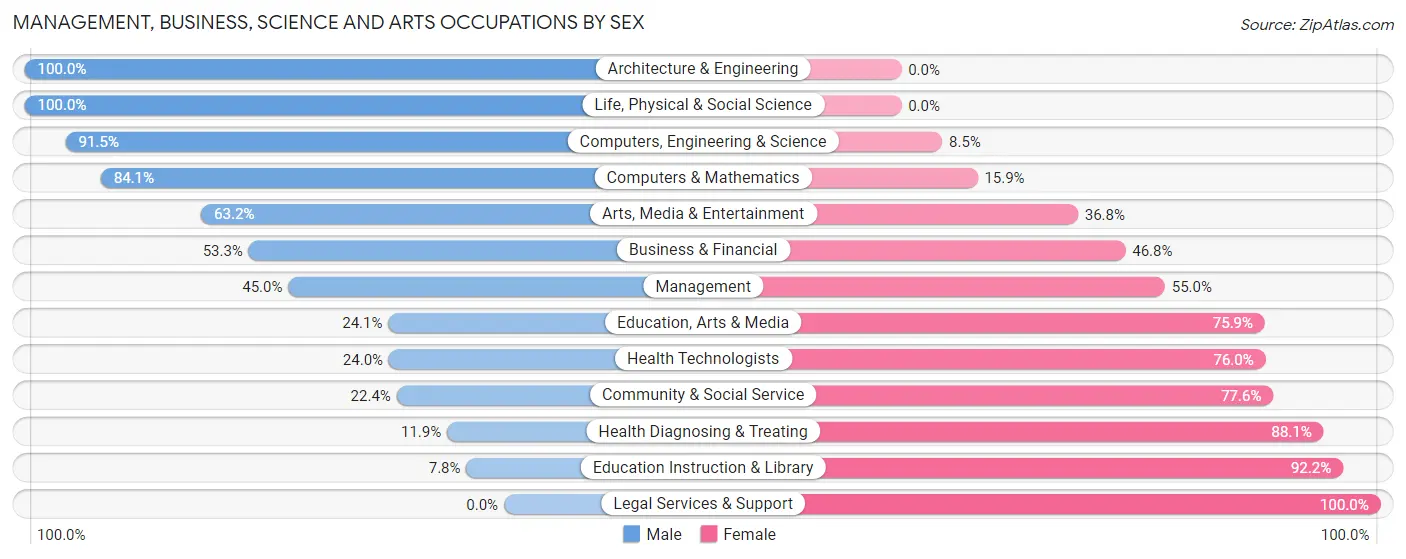
| Occupation | Male | Female |
| Management | 63 (45.0%) | 77 (55.0%) |
| Business & Financial | 41 (53.2%) | 36 (46.8%) |
| Computers, Engineering & Science | 75 (91.5%) | 7 (8.5%) |
| Computers & Mathematics | 37 (84.1%) | 7 (15.9%) |
| Architecture & Engineering | 16 (100.0%) | 0 (0.0%) |
| Life, Physical & Social Science | 22 (100.0%) | 0 (0.0%) |
| Community & Social Service | 30 (22.4%) | 104 (77.6%) |
| Education, Arts & Media | 14 (24.1%) | 44 (75.9%) |
| Legal Services & Support | 0 (0.0%) | 6 (100.0%) |
| Education Instruction & Library | 4 (7.8%) | 47 (92.2%) |
| Arts, Media & Entertainment | 12 (63.2%) | 7 (36.8%) |
| Health Diagnosing & Treating | 12 (11.9%) | 89 (88.1%) |
| Health Technologists | 12 (24.0%) | 38 (76.0%) |
| Total (Category) | 221 (41.4%) | 313 (58.6%) |
| Total (Overall) | 651 (50.3%) | 642 (49.6%) |
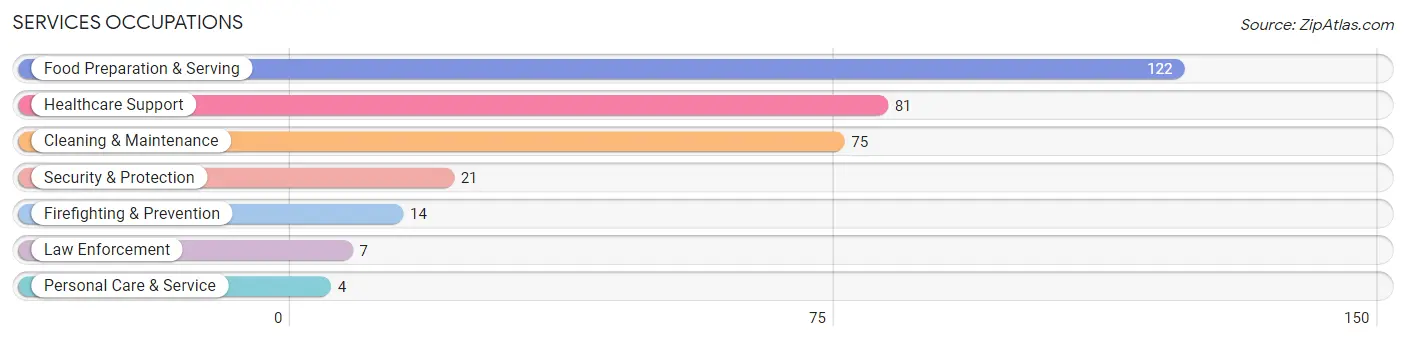
Services Occupations
The most common Services occupations in Colfax are Food Preparation & Serving (122 | 9.4%), Healthcare Support (81 | 6.3%), Cleaning & Maintenance (75 | 5.8%), Security & Protection (21 | 1.6%), and Firefighting & Prevention (14 | 1.1%).
Services Occupations by Sex
Within the Services occupations in Colfax, the most male-oriented occupations are Law Enforcement (100.0%), Security & Protection (57.1%), and Food Preparation & Serving (50.0%), while the most female-oriented occupations are Healthcare Support (100.0%), Personal Care & Service (100.0%), and Cleaning & Maintenance (72.0%).
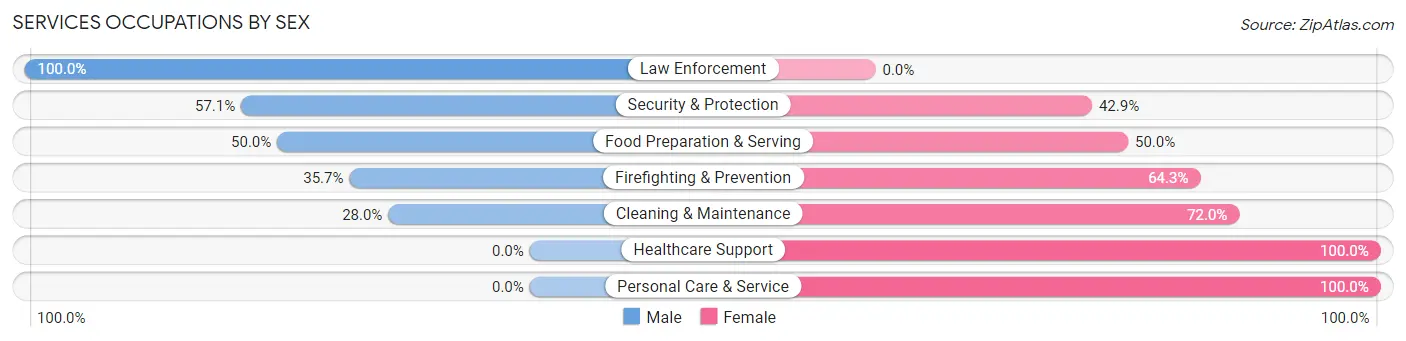
| Occupation | Male | Female |
| Healthcare Support | 0 (0.0%) | 81 (100.0%) |
| Security & Protection | 12 (57.1%) | 9 (42.9%) |
| Firefighting & Prevention | 5 (35.7%) | 9 (64.3%) |
| Law Enforcement | 7 (100.0%) | 0 (0.0%) |
| Food Preparation & Serving | 61 (50.0%) | 61 (50.0%) |
| Cleaning & Maintenance | 21 (28.0%) | 54 (72.0%) |
| Personal Care & Service | 0 (0.0%) | 4 (100.0%) |
| Total (Category) | 94 (31.0%) | 209 (69.0%) |
| Total (Overall) | 651 (50.3%) | 642 (49.6%) |
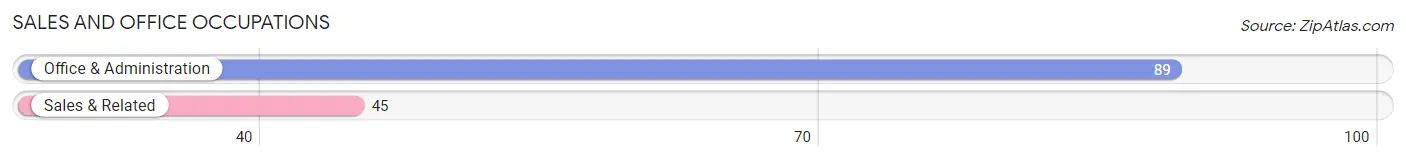
Sales and Office Occupations
The most common Sales and Office occupations in Colfax are Office & Administration (89 | 6.9%), and Sales & Related (45 | 3.5%).
Sales and Office Occupations by Sex
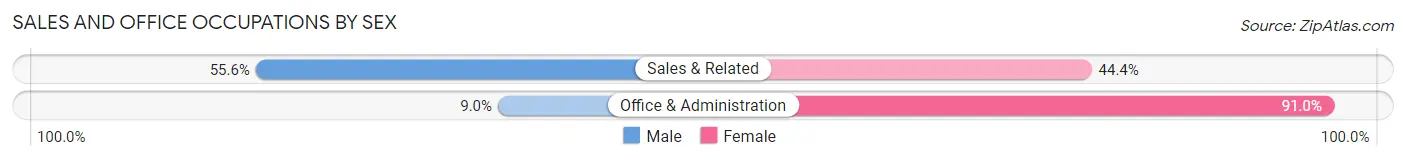
| Occupation | Male | Female |
| Sales & Related | 25 (55.6%) | 20 (44.4%) |
| Office & Administration | 8 (9.0%) | 81 (91.0%) |
| Total (Category) | 33 (24.6%) | 101 (75.4%) |
| Total (Overall) | 651 (50.3%) | 642 (49.6%) |
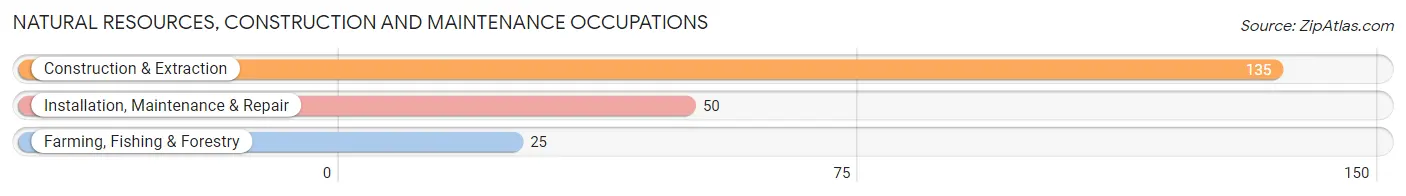
Natural Resources, Construction and Maintenance Occupations
The most common Natural Resources, Construction and Maintenance occupations in Colfax are Construction & Extraction (135 | 10.4%), Installation, Maintenance & Repair (50 | 3.9%), and Farming, Fishing & Forestry (25 | 1.9%).
Natural Resources, Construction and Maintenance Occupations by Sex
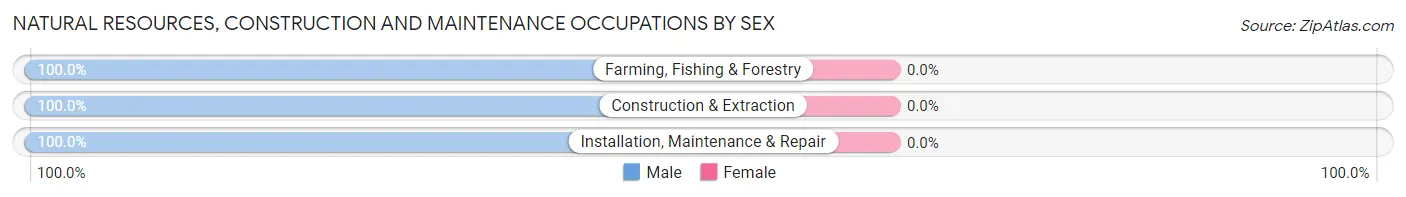
| Occupation | Male | Female |
| Farming, Fishing & Forestry | 25 (100.0%) | 0 (0.0%) |
| Construction & Extraction | 135 (100.0%) | 0 (0.0%) |
| Installation, Maintenance & Repair | 50 (100.0%) | 0 (0.0%) |
| Total (Category) | 210 (100.0%) | 0 (0.0%) |
| Total (Overall) | 651 (50.3%) | 642 (49.6%) |
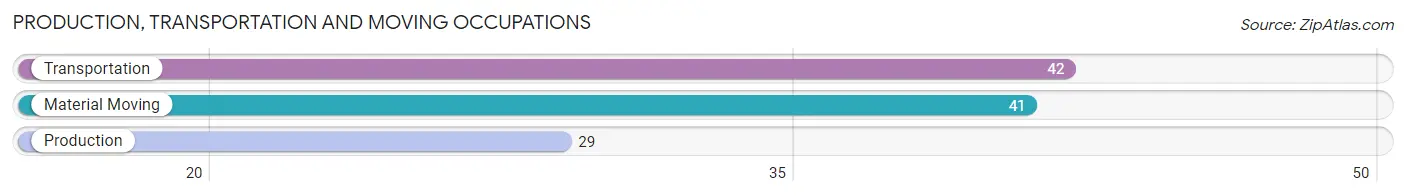
Production, Transportation and Moving Occupations
The most common Production, Transportation and Moving occupations in Colfax are Transportation (42 | 3.3%), Material Moving (41 | 3.2%), and Production (29 | 2.2%).
Production, Transportation and Moving Occupations by Sex
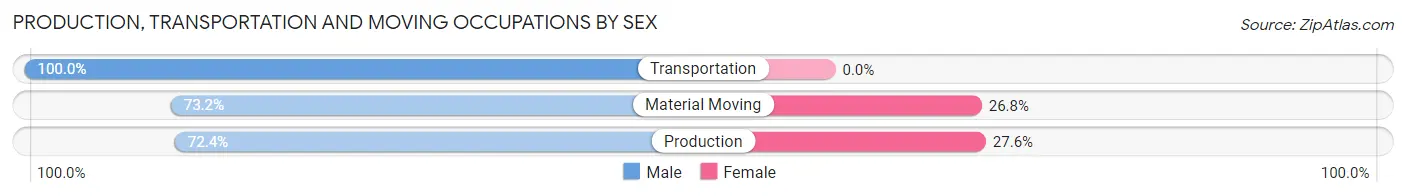
| Occupation | Male | Female |
| Production | 21 (72.4%) | 8 (27.6%) |
| Transportation | 42 (100.0%) | 0 (0.0%) |
| Material Moving | 30 (73.2%) | 11 (26.8%) |
| Total (Category) | 93 (83.0%) | 19 (17.0%) |
| Total (Overall) | 651 (50.3%) | 642 (49.6%) |
Employment Industries by Sex in Colfax
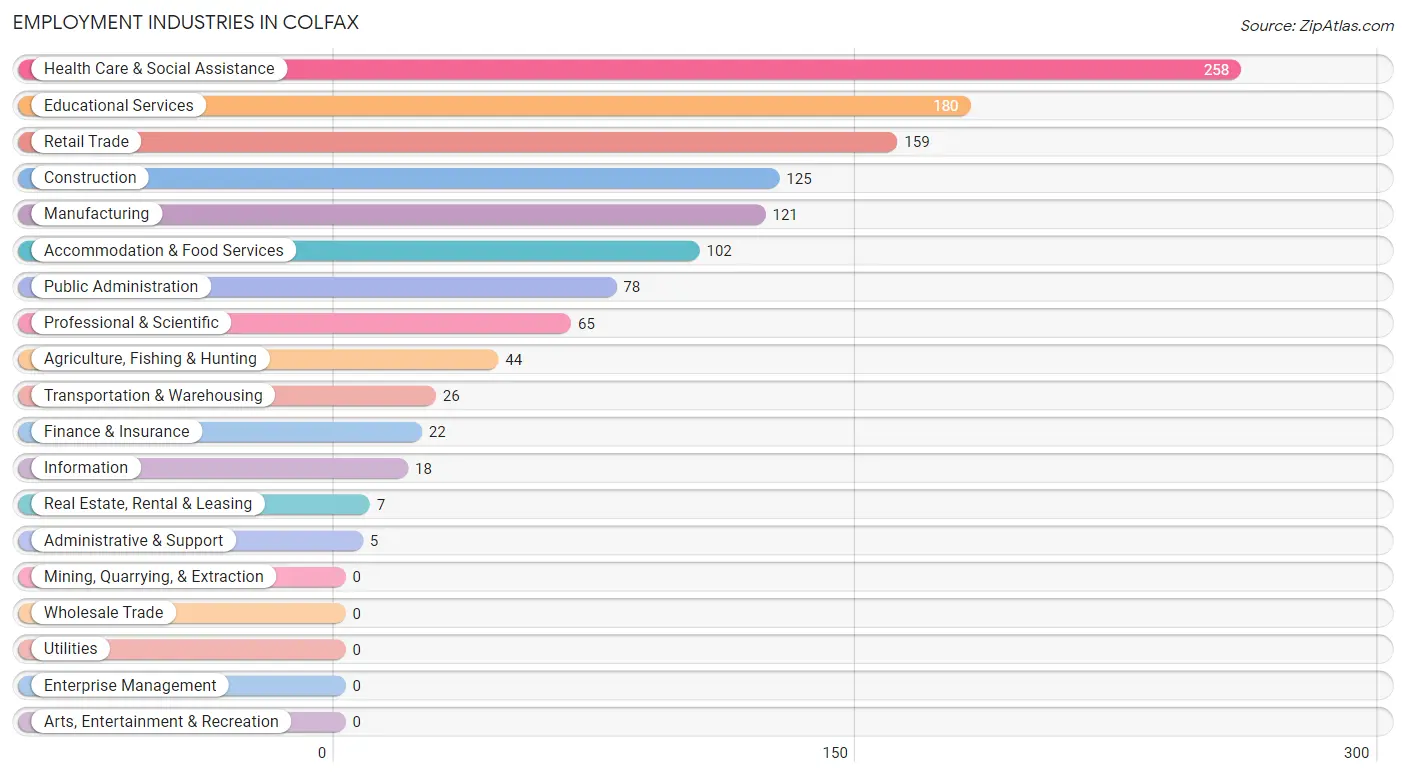
Employment Industries in Colfax
The major employment industries in Colfax include Health Care & Social Assistance (258 | 20.0%), Educational Services (180 | 13.9%), Retail Trade (159 | 12.3%), Construction (125 | 9.7%), and Manufacturing (121 | 9.4%).
Employment Industries by Sex in Colfax
The Colfax industries that see more men than women are Agriculture, Fishing & Hunting (100.0%), Finance & Insurance (100.0%), and Administrative & Support (100.0%), whereas the industries that tend to have a higher number of women are Real Estate, Rental & Leasing (100.0%), Public Administration (91.0%), and Health Care & Social Assistance (77.5%).
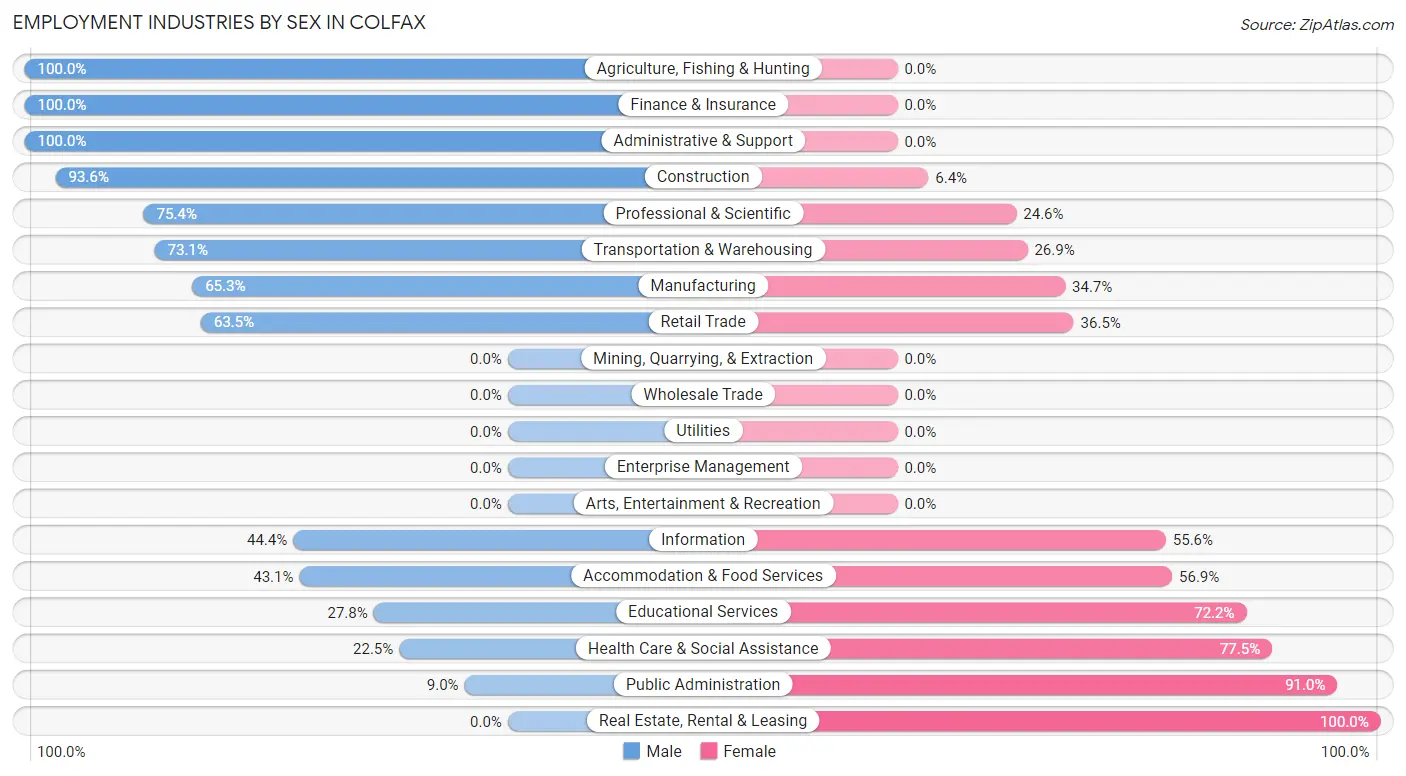
| Industry | Male | Female |
| Agriculture, Fishing & Hunting | 44 (100.0%) | 0 (0.0%) |
| Mining, Quarrying, & Extraction | 0 (0.0%) | 0 (0.0%) |
| Construction | 117 (93.6%) | 8 (6.4%) |
| Manufacturing | 79 (65.3%) | 42 (34.7%) |
| Wholesale Trade | 0 (0.0%) | 0 (0.0%) |
| Retail Trade | 101 (63.5%) | 58 (36.5%) |
| Transportation & Warehousing | 19 (73.1%) | 7 (26.9%) |
| Utilities | 0 (0.0%) | 0 (0.0%) |
| Information | 8 (44.4%) | 10 (55.6%) |
| Finance & Insurance | 22 (100.0%) | 0 (0.0%) |
| Real Estate, Rental & Leasing | 0 (0.0%) | 7 (100.0%) |
| Professional & Scientific | 49 (75.4%) | 16 (24.6%) |
| Enterprise Management | 0 (0.0%) | 0 (0.0%) |
| Administrative & Support | 5 (100.0%) | 0 (0.0%) |
| Educational Services | 50 (27.8%) | 130 (72.2%) |
| Health Care & Social Assistance | 58 (22.5%) | 200 (77.5%) |
| Arts, Entertainment & Recreation | 0 (0.0%) | 0 (0.0%) |
| Accommodation & Food Services | 44 (43.1%) | 58 (56.9%) |
| Public Administration | 7 (9.0%) | 71 (91.0%) |
| Total | 651 (50.3%) | 642 (49.6%) |
Education in Colfax
School Enrollment in Colfax
The most common levels of schooling among the 485 students in Colfax are middle school (137 | 28.2%), elementary school (86 | 17.7%), and college / undergraduate (84 | 17.3%).
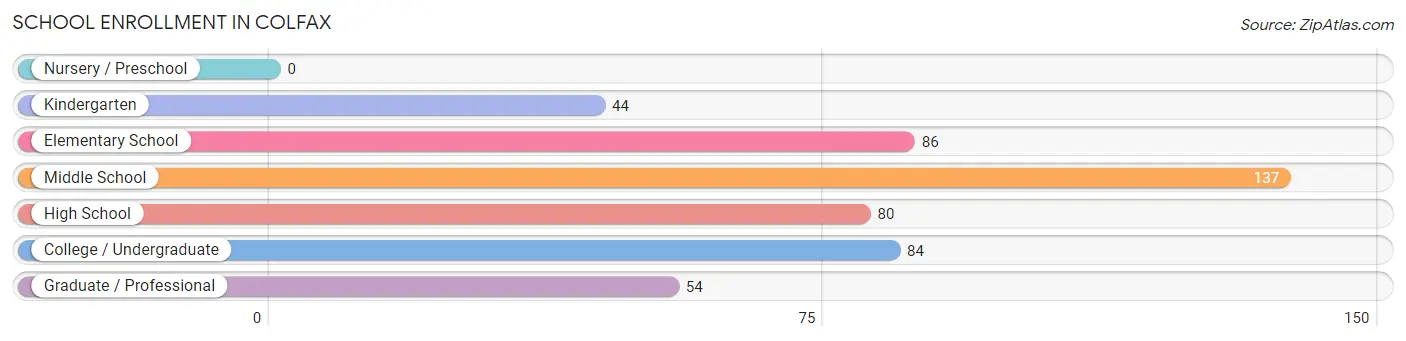
| School Level | # Students | % Students |
| Nursery / Preschool | 0 | 0.0% |
| Kindergarten | 44 | 9.1% |
| Elementary School | 86 | 17.7% |
| Middle School | 137 | 28.2% |
| High School | 80 | 16.5% |
| College / Undergraduate | 84 | 17.3% |
| Graduate / Professional | 54 | 11.1% |
| Total | 485 | 100.0% |
School Enrollment by Age by Funding Source in Colfax
Out of a total of 485 students who are enrolled in schools in Colfax, 112 (23.1%) attend a private institution, while the remaining 373 (76.9%) are enrolled in public schools. The age group of 35 years and over has the highest likelihood of being enrolled in private schools, with 32 (100.0% in the age bracket) enrolled. Conversely, the age group of 20 to 24 year olds has the lowest likelihood of being enrolled in a private school, with 21 (100.0% in the age bracket) attending a public institution.
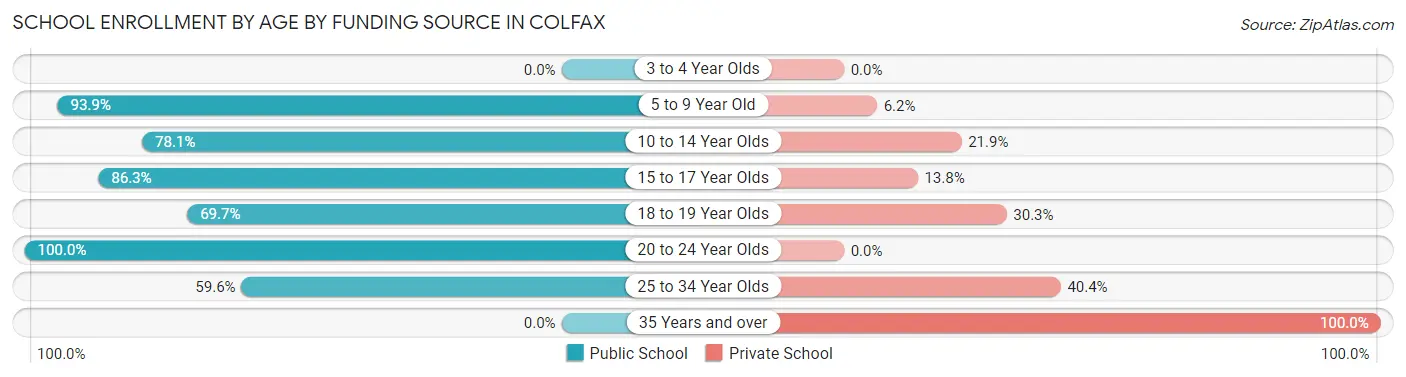
| Age Bracket | Public School | Private School |
| 3 to 4 Year Olds | 0 (0.0%) | 0 (0.0%) |
| 5 to 9 Year Old | 122 (93.9%) | 8 (6.1%) |
| 10 to 14 Year Olds | 107 (78.1%) | 30 (21.9%) |
| 15 to 17 Year Olds | 69 (86.3%) | 11 (13.8%) |
| 18 to 19 Year Olds | 23 (69.7%) | 10 (30.3%) |
| 20 to 24 Year Olds | 21 (100.0%) | 0 (0.0%) |
| 25 to 34 Year Olds | 31 (59.6%) | 21 (40.4%) |
| 35 Years and over | 0 (0.0%) | 32 (100.0%) |
| Total | 373 (76.9%) | 112 (23.1%) |
Educational Attainment by Field of Study in Colfax
Business (130 | 17.7%), education (108 | 14.7%), bio, nature & agricultural (90 | 12.3%), science & technology (62 | 8.5%), and engineering (46 | 6.3%) are the most common fields of study among 734 individuals in Colfax who have obtained a bachelor's degree or higher.
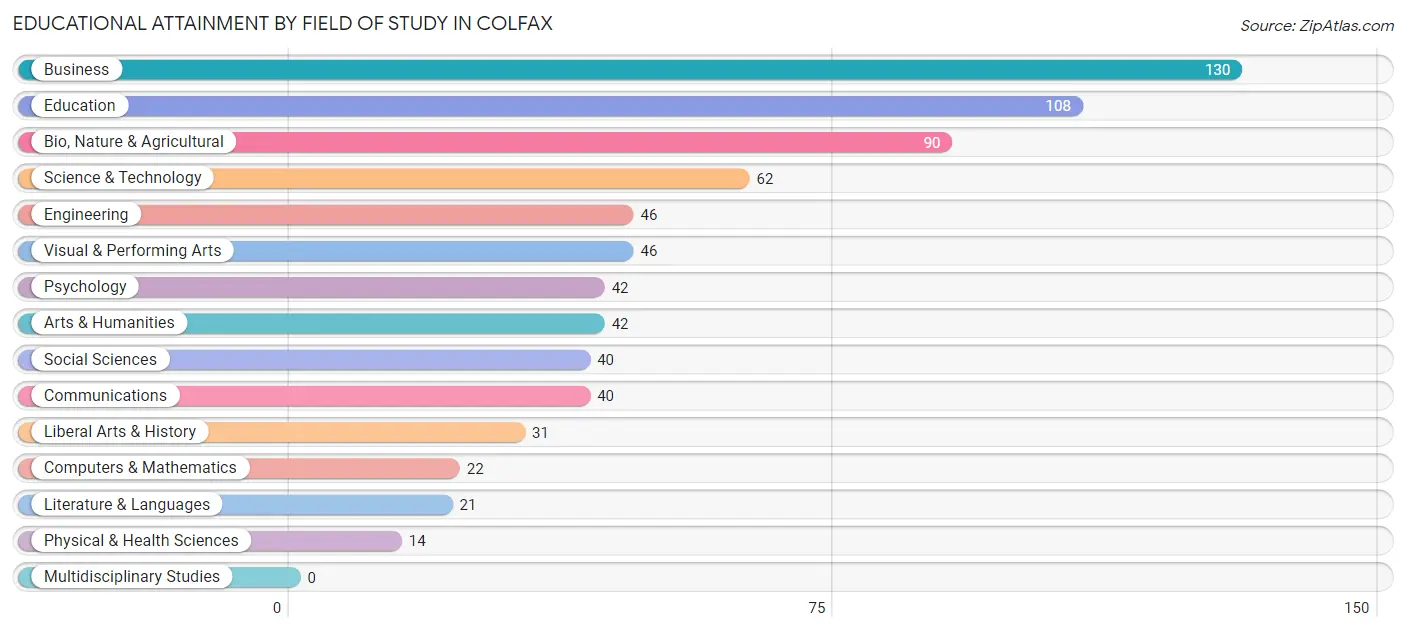
| Field of Study | # Graduates | % Graduates |
| Computers & Mathematics | 22 | 3.0% |
| Bio, Nature & Agricultural | 90 | 12.3% |
| Physical & Health Sciences | 14 | 1.9% |
| Psychology | 42 | 5.7% |
| Social Sciences | 40 | 5.4% |
| Engineering | 46 | 6.3% |
| Multidisciplinary Studies | 0 | 0.0% |
| Science & Technology | 62 | 8.5% |
| Business | 130 | 17.7% |
| Education | 108 | 14.7% |
| Literature & Languages | 21 | 2.9% |
| Liberal Arts & History | 31 | 4.2% |
| Visual & Performing Arts | 46 | 6.3% |
| Communications | 40 | 5.4% |
| Arts & Humanities | 42 | 5.7% |
| Total | 734 | 100.0% |
Transportation & Commute in Colfax
Vehicle Availability by Sex in Colfax
The most prevalent vehicle ownership categories in Colfax are males with 2 vehicles (258, accounting for 40.9%) and females with 2 vehicles (131, making up 41.1%).
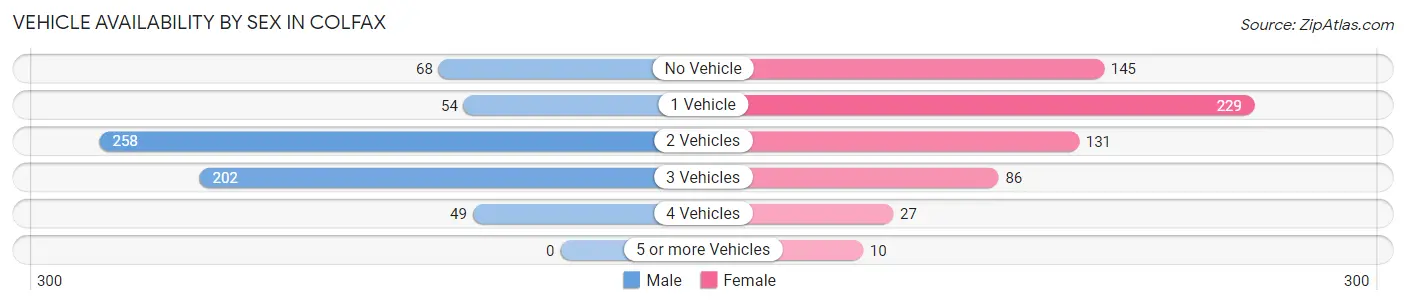
| Vehicles Available | Male | Female |
| No Vehicle | 68 (10.8%) | 145 (23.1%) |
| 1 Vehicle | 54 (8.6%) | 229 (36.5%) |
| 2 Vehicles | 258 (40.9%) | 131 (20.9%) |
| 3 Vehicles | 202 (32.0%) | 86 (13.7%) |
| 4 Vehicles | 49 (7.8%) | 27 (4.3%) |
| 5 or more Vehicles | 0 (0.0%) | 10 (1.6%) |
| Total | 631 (100.0%) | 628 (100.0%) |
Commute Time in Colfax
The most frequently occuring commute durations in Colfax are 30 to 34 minutes (220 commuters, 17.8%), 25 to 29 minutes (200 commuters, 16.2%), and 5 to 9 minutes (197 commuters, 15.9%).
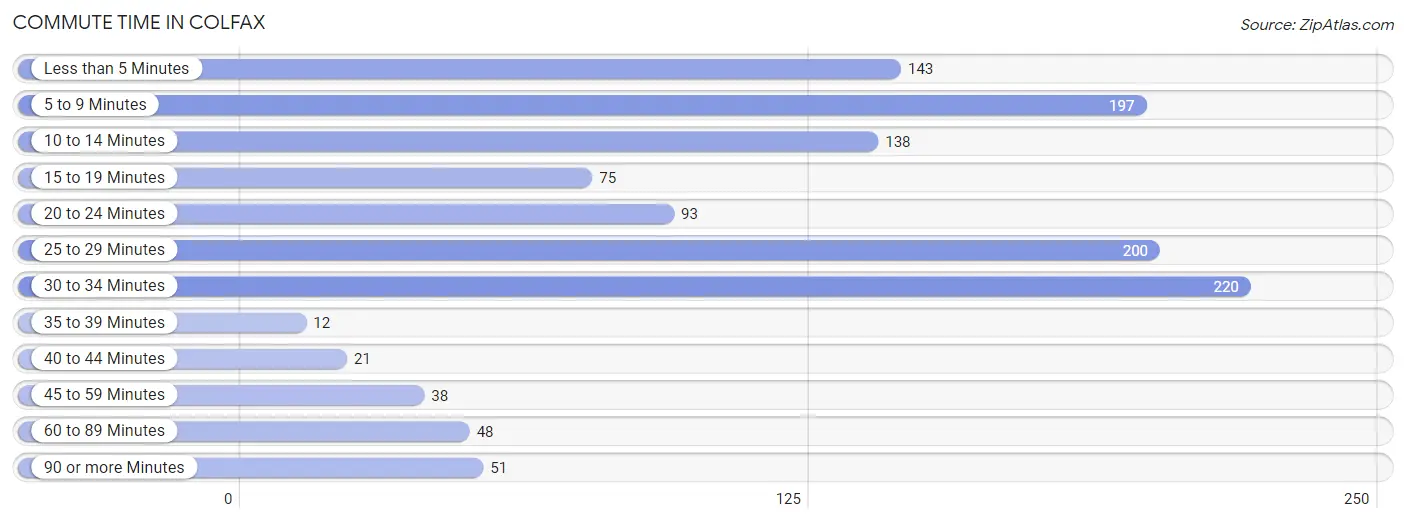
| Commute Time | # Commuters | % Commuters |
| Less than 5 Minutes | 143 | 11.6% |
| 5 to 9 Minutes | 197 | 15.9% |
| 10 to 14 Minutes | 138 | 11.2% |
| 15 to 19 Minutes | 75 | 6.1% |
| 20 to 24 Minutes | 93 | 7.5% |
| 25 to 29 Minutes | 200 | 16.2% |
| 30 to 34 Minutes | 220 | 17.8% |
| 35 to 39 Minutes | 12 | 1.0% |
| 40 to 44 Minutes | 21 | 1.7% |
| 45 to 59 Minutes | 38 | 3.1% |
| 60 to 89 Minutes | 48 | 3.9% |
| 90 or more Minutes | 51 | 4.1% |
Commute Time by Sex in Colfax
The most common commute times in Colfax are 30 to 34 minutes (110 commuters, 17.6%) for males and 5 to 9 minutes (162 commuters, 26.5%) for females.
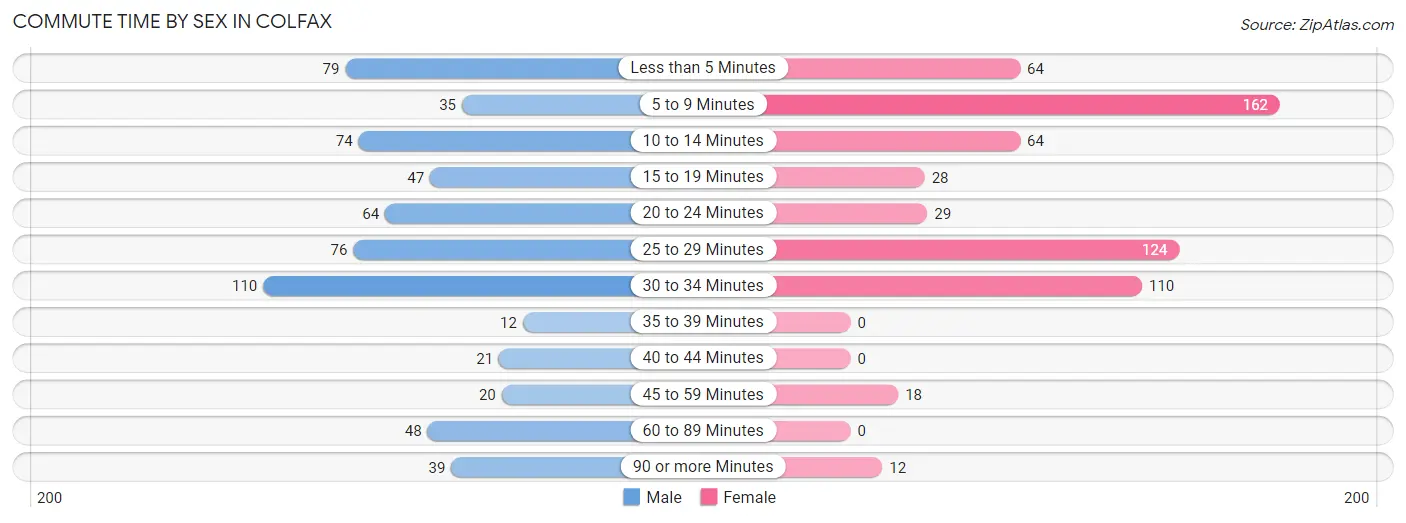
| Commute Time | Male | Female |
| Less than 5 Minutes | 79 (12.6%) | 64 (10.5%) |
| 5 to 9 Minutes | 35 (5.6%) | 162 (26.5%) |
| 10 to 14 Minutes | 74 (11.8%) | 64 (10.5%) |
| 15 to 19 Minutes | 47 (7.5%) | 28 (4.6%) |
| 20 to 24 Minutes | 64 (10.2%) | 29 (4.8%) |
| 25 to 29 Minutes | 76 (12.2%) | 124 (20.3%) |
| 30 to 34 Minutes | 110 (17.6%) | 110 (18.0%) |
| 35 to 39 Minutes | 12 (1.9%) | 0 (0.0%) |
| 40 to 44 Minutes | 21 (3.4%) | 0 (0.0%) |
| 45 to 59 Minutes | 20 (3.2%) | 18 (2.9%) |
| 60 to 89 Minutes | 48 (7.7%) | 0 (0.0%) |
| 90 or more Minutes | 39 (6.2%) | 12 (2.0%) |
Time of Departure to Work by Sex in Colfax
The most frequent times of departure to work in Colfax are 8:00 AM to 8:29 AM (138, 22.1%) for males and 7:30 AM to 7:59 AM (159, 26.0%) for females.
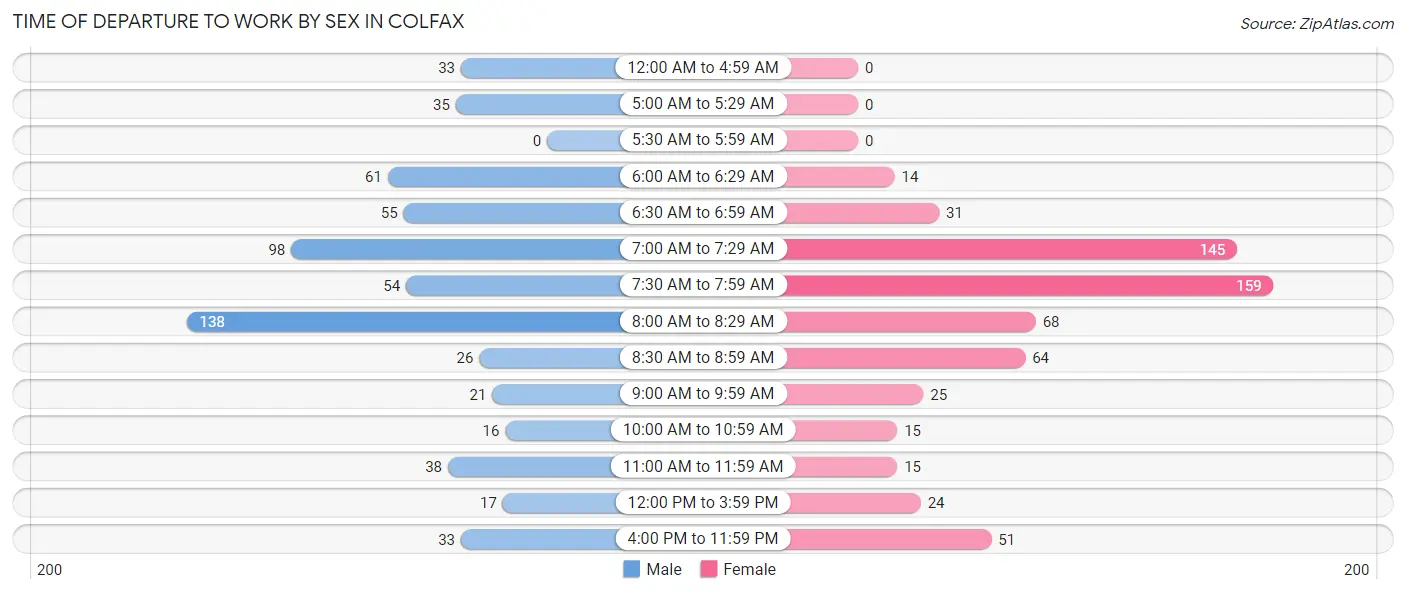
| Time of Departure | Male | Female |
| 12:00 AM to 4:59 AM | 33 (5.3%) | 0 (0.0%) |
| 5:00 AM to 5:29 AM | 35 (5.6%) | 0 (0.0%) |
| 5:30 AM to 5:59 AM | 0 (0.0%) | 0 (0.0%) |
| 6:00 AM to 6:29 AM | 61 (9.8%) | 14 (2.3%) |
| 6:30 AM to 6:59 AM | 55 (8.8%) | 31 (5.1%) |
| 7:00 AM to 7:29 AM | 98 (15.7%) | 145 (23.7%) |
| 7:30 AM to 7:59 AM | 54 (8.6%) | 159 (26.0%) |
| 8:00 AM to 8:29 AM | 138 (22.1%) | 68 (11.1%) |
| 8:30 AM to 8:59 AM | 26 (4.2%) | 64 (10.5%) |
| 9:00 AM to 9:59 AM | 21 (3.4%) | 25 (4.1%) |
| 10:00 AM to 10:59 AM | 16 (2.6%) | 15 (2.5%) |
| 11:00 AM to 11:59 AM | 38 (6.1%) | 15 (2.5%) |
| 12:00 PM to 3:59 PM | 17 (2.7%) | 24 (3.9%) |
| 4:00 PM to 11:59 PM | 33 (5.3%) | 51 (8.4%) |
| Total | 625 (100.0%) | 611 (100.0%) |
Housing Occupancy in Colfax
Occupancy by Ownership in Colfax
Of the total 1,166 dwellings in Colfax, owner-occupied units account for 721 (61.8%), while renter-occupied units make up 445 (38.2%).
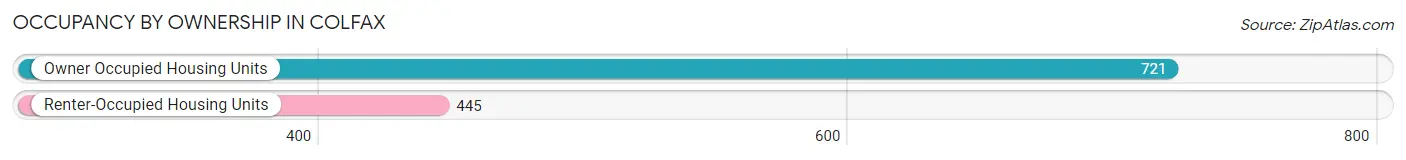
| Occupancy | # Housing Units | % Housing Units |
| Owner Occupied Housing Units | 721 | 61.8% |
| Renter-Occupied Housing Units | 445 | 38.2% |
| Total Occupied Housing Units | 1,166 | 100.0% |
Occupancy by Household Size in Colfax
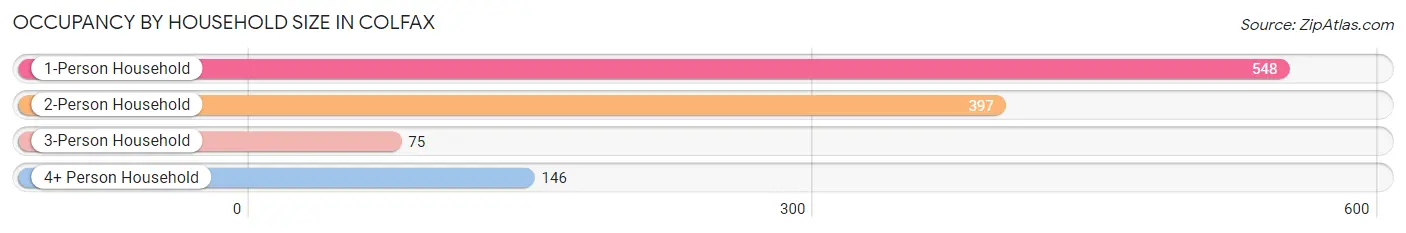
| Household Size | # Housing Units | % Housing Units |
| 1-Person Household | 548 | 47.0% |
| 2-Person Household | 397 | 34.1% |
| 3-Person Household | 75 | 6.4% |
| 4+ Person Household | 146 | 12.5% |
| Total Housing Units | 1,166 | 100.0% |
Occupancy by Ownership by Household Size in Colfax
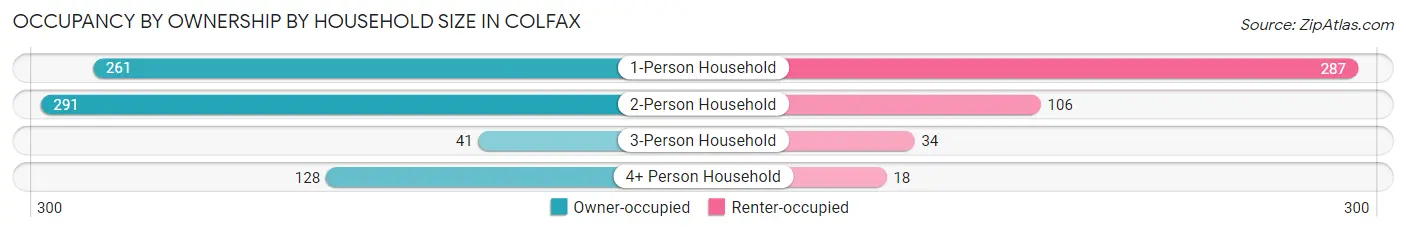
| Household Size | Owner-occupied | Renter-occupied |
| 1-Person Household | 261 (47.6%) | 287 (52.4%) |
| 2-Person Household | 291 (73.3%) | 106 (26.7%) |
| 3-Person Household | 41 (54.7%) | 34 (45.3%) |
| 4+ Person Household | 128 (87.7%) | 18 (12.3%) |
| Total Housing Units | 721 (61.8%) | 445 (38.2%) |
Occupancy by Educational Attainment in Colfax
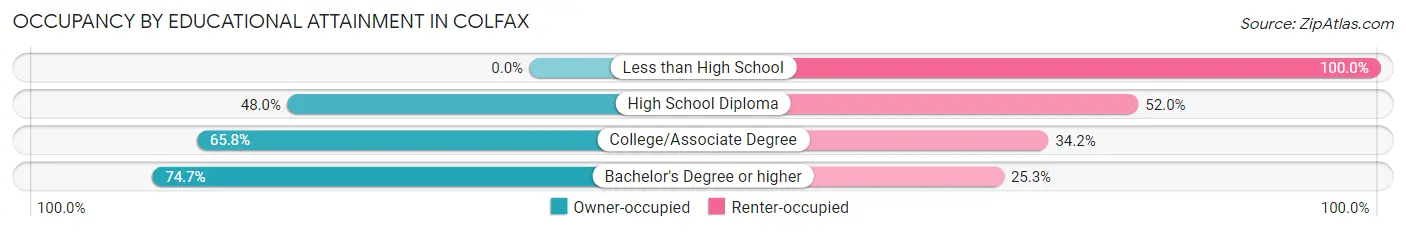
| Household Size | Owner-occupied | Renter-occupied |
| Less than High School | 0 (0.0%) | 40 (100.0%) |
| High School Diploma | 145 (48.0%) | 157 (52.0%) |
| College/Associate Degree | 293 (65.8%) | 152 (34.2%) |
| Bachelor's Degree or higher | 283 (74.7%) | 96 (25.3%) |
Occupancy by Age of Householder in Colfax
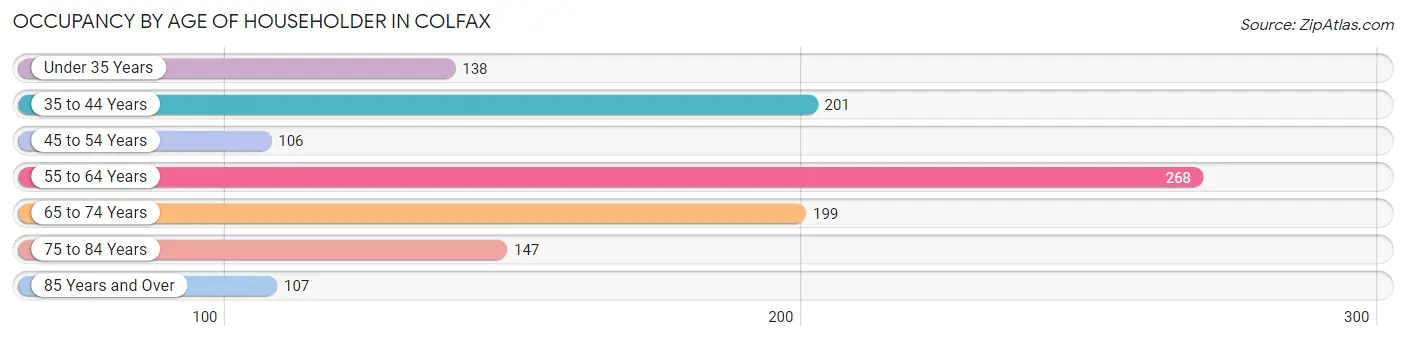
| Age Bracket | # Households | % Households |
| Under 35 Years | 138 | 11.8% |
| 35 to 44 Years | 201 | 17.2% |
| 45 to 54 Years | 106 | 9.1% |
| 55 to 64 Years | 268 | 23.0% |
| 65 to 74 Years | 199 | 17.1% |
| 75 to 84 Years | 147 | 12.6% |
| 85 Years and Over | 107 | 9.2% |
| Total | 1,166 | 100.0% |
Housing Finances in Colfax
Median Income by Occupancy in Colfax
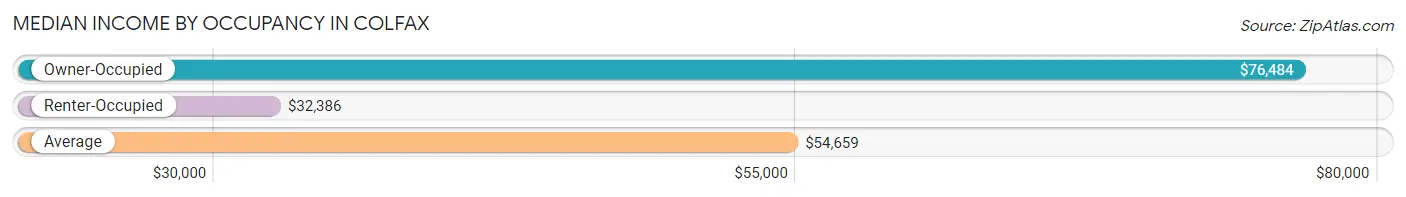
| Occupancy Type | # Households | Median Income |
| Owner-Occupied | 721 (61.8%) | $76,484 |
| Renter-Occupied | 445 (38.2%) | $32,386 |
| Average | 1,166 (100.0%) | $54,659 |
Occupancy by Householder Income Bracket in Colfax
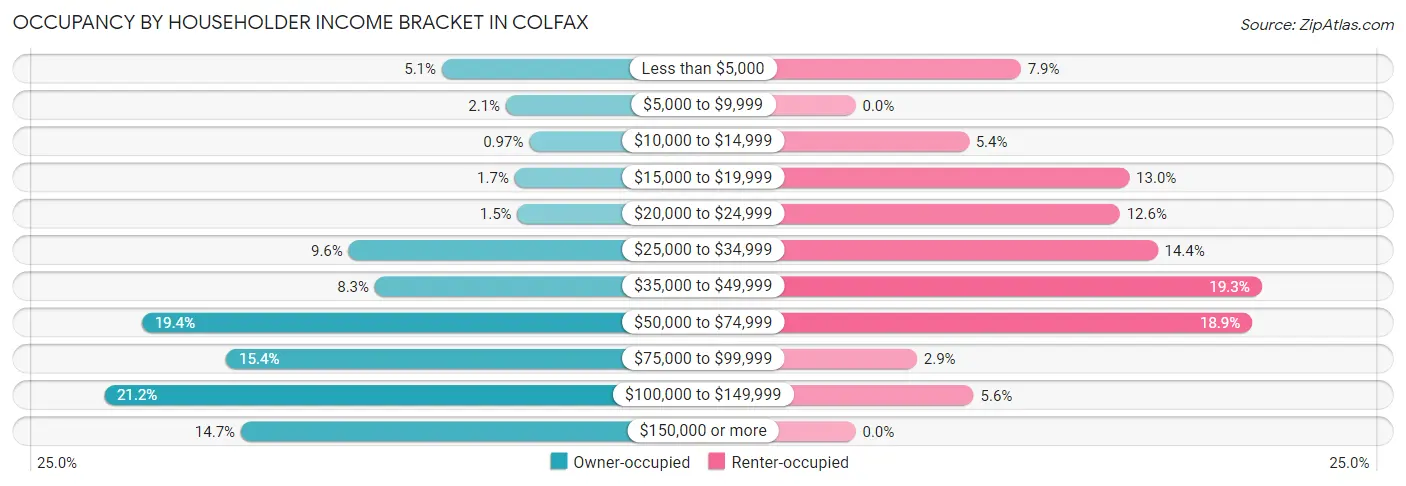
| Income Bracket | Owner-occupied | Renter-occupied |
| Less than $5,000 | 37 (5.1%) | 35 (7.9%) |
| $5,000 to $9,999 | 15 (2.1%) | 0 (0.0%) |
| $10,000 to $14,999 | 7 (1.0%) | 24 (5.4%) |
| $15,000 to $19,999 | 12 (1.7%) | 58 (13.0%) |
| $20,000 to $24,999 | 11 (1.5%) | 56 (12.6%) |
| $25,000 to $34,999 | 69 (9.6%) | 64 (14.4%) |
| $35,000 to $49,999 | 60 (8.3%) | 86 (19.3%) |
| $50,000 to $74,999 | 140 (19.4%) | 84 (18.9%) |
| $75,000 to $99,999 | 111 (15.4%) | 13 (2.9%) |
| $100,000 to $149,999 | 153 (21.2%) | 25 (5.6%) |
| $150,000 or more | 106 (14.7%) | 0 (0.0%) |
| Total | 721 (100.0%) | 445 (100.0%) |
Monthly Housing Cost Tiers in Colfax
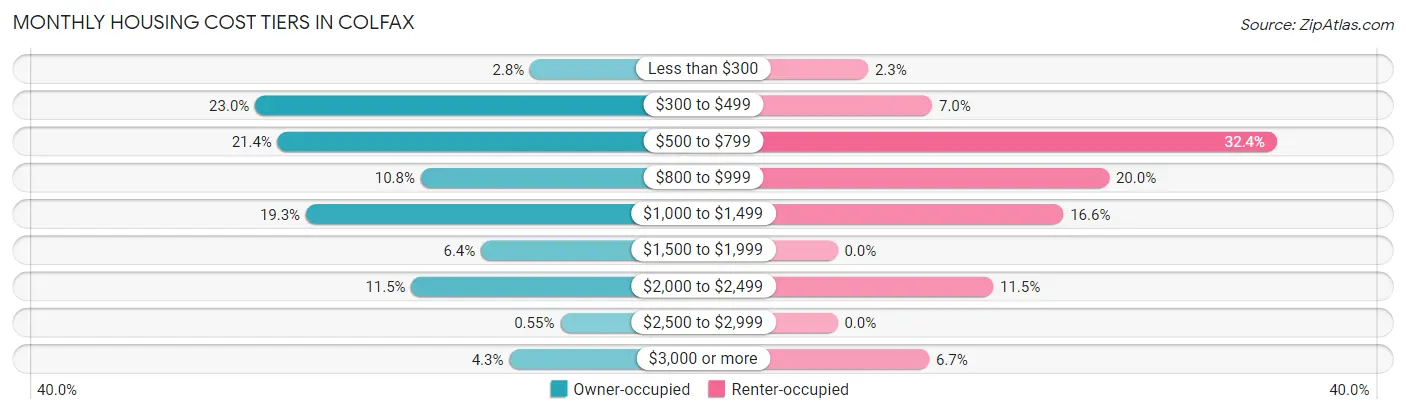
| Monthly Cost | Owner-occupied | Renter-occupied |
| Less than $300 | 20 (2.8%) | 10 (2.2%) |
| $300 to $499 | 166 (23.0%) | 31 (7.0%) |
| $500 to $799 | 154 (21.4%) | 144 (32.4%) |
| $800 to $999 | 78 (10.8%) | 89 (20.0%) |
| $1,000 to $1,499 | 139 (19.3%) | 74 (16.6%) |
| $1,500 to $1,999 | 46 (6.4%) | 0 (0.0%) |
| $2,000 to $2,499 | 83 (11.5%) | 51 (11.5%) |
| $2,500 to $2,999 | 4 (0.5%) | 0 (0.0%) |
| $3,000 or more | 31 (4.3%) | 30 (6.7%) |
| Total | 721 (100.0%) | 445 (100.0%) |
Physical Housing Characteristics in Colfax
Housing Structures in Colfax
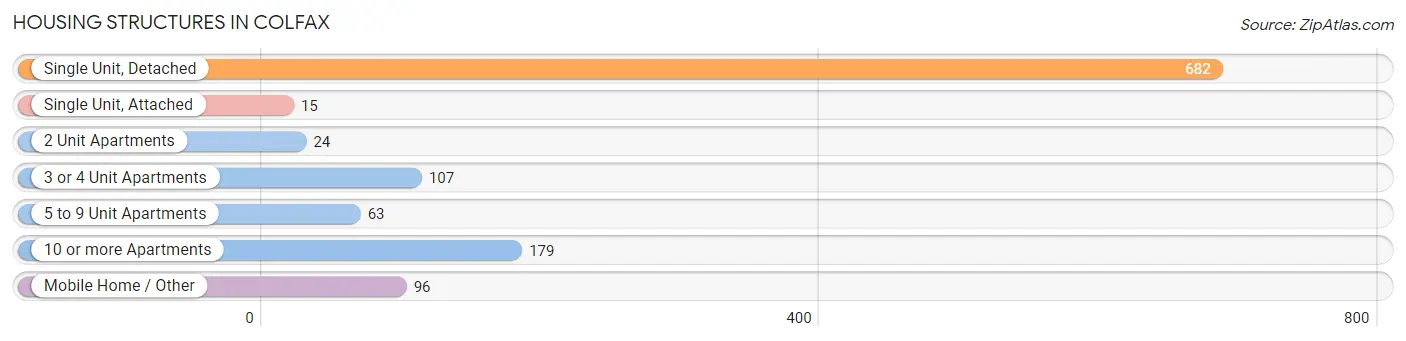
| Structure Type | # Housing Units | % Housing Units |
| Single Unit, Detached | 682 | 58.5% |
| Single Unit, Attached | 15 | 1.3% |
| 2 Unit Apartments | 24 | 2.1% |
| 3 or 4 Unit Apartments | 107 | 9.2% |
| 5 to 9 Unit Apartments | 63 | 5.4% |
| 10 or more Apartments | 179 | 15.3% |
| Mobile Home / Other | 96 | 8.2% |
| Total | 1,166 | 100.0% |
Housing Structures by Occupancy in Colfax
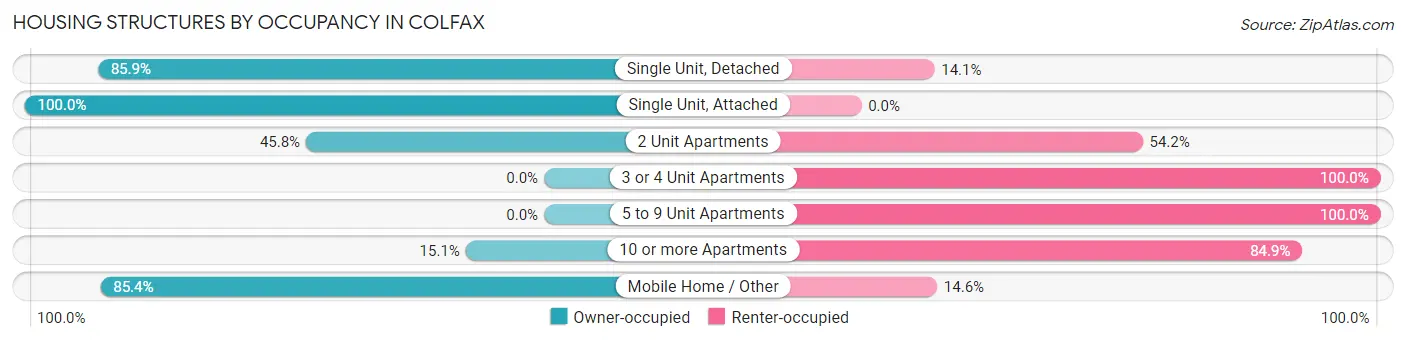
| Structure Type | Owner-occupied | Renter-occupied |
| Single Unit, Detached | 586 (85.9%) | 96 (14.1%) |
| Single Unit, Attached | 15 (100.0%) | 0 (0.0%) |
| 2 Unit Apartments | 11 (45.8%) | 13 (54.2%) |
| 3 or 4 Unit Apartments | 0 (0.0%) | 107 (100.0%) |
| 5 to 9 Unit Apartments | 0 (0.0%) | 63 (100.0%) |
| 10 or more Apartments | 27 (15.1%) | 152 (84.9%) |
| Mobile Home / Other | 82 (85.4%) | 14 (14.6%) |
| Total | 721 (61.8%) | 445 (38.2%) |
Housing Structures by Number of Rooms in Colfax
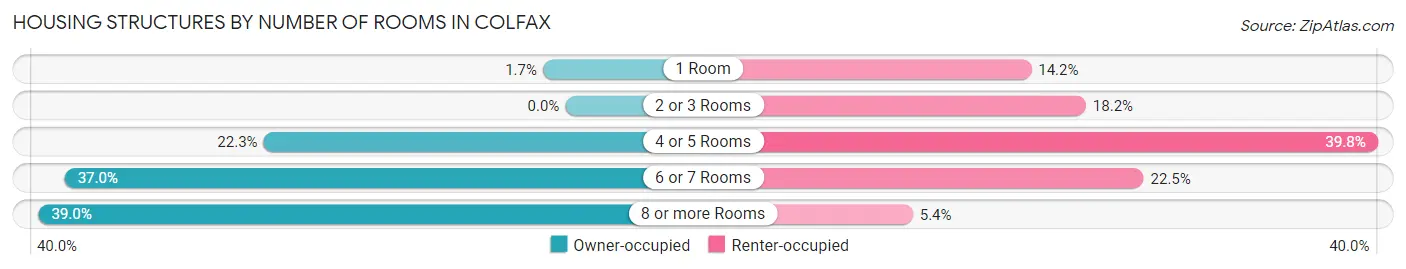
| Number of Rooms | Owner-occupied | Renter-occupied |
| 1 Room | 12 (1.7%) | 63 (14.2%) |
| 2 or 3 Rooms | 0 (0.0%) | 81 (18.2%) |
| 4 or 5 Rooms | 161 (22.3%) | 177 (39.8%) |
| 6 or 7 Rooms | 267 (37.0%) | 100 (22.5%) |
| 8 or more Rooms | 281 (39.0%) | 24 (5.4%) |
| Total | 721 (100.0%) | 445 (100.0%) |
Housing Structure by Heating Type in Colfax
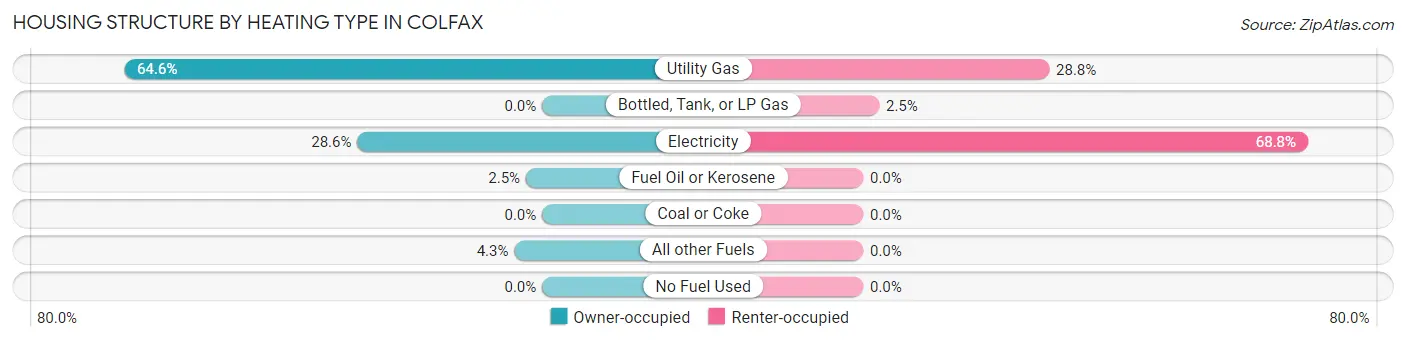
| Heating Type | Owner-occupied | Renter-occupied |
| Utility Gas | 466 (64.6%) | 128 (28.8%) |
| Bottled, Tank, or LP Gas | 0 (0.0%) | 11 (2.5%) |
| Electricity | 206 (28.6%) | 306 (68.8%) |
| Fuel Oil or Kerosene | 18 (2.5%) | 0 (0.0%) |
| Coal or Coke | 0 (0.0%) | 0 (0.0%) |
| All other Fuels | 31 (4.3%) | 0 (0.0%) |
| No Fuel Used | 0 (0.0%) | 0 (0.0%) |
| Total | 721 (100.0%) | 445 (100.0%) |
Household Vehicle Usage in Colfax
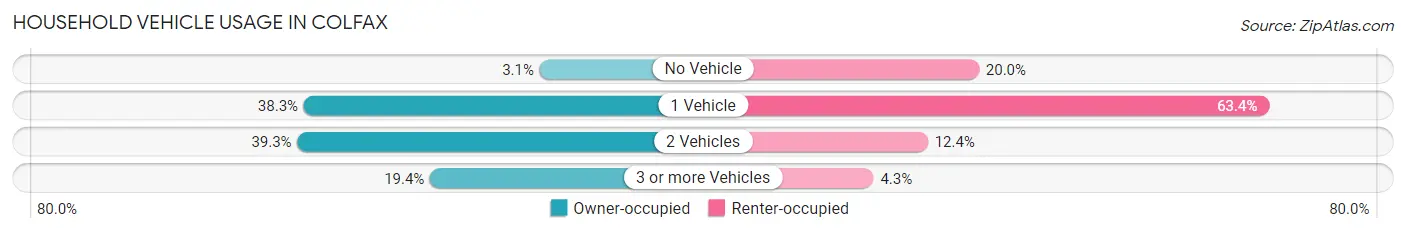
| Vehicles per Household | Owner-occupied | Renter-occupied |
| No Vehicle | 22 (3.0%) | 89 (20.0%) |
| 1 Vehicle | 276 (38.3%) | 282 (63.4%) |
| 2 Vehicles | 283 (39.3%) | 55 (12.4%) |
| 3 or more Vehicles | 140 (19.4%) | 19 (4.3%) |
| Total | 721 (100.0%) | 445 (100.0%) |
Real Estate & Mortgages in Colfax
Real Estate and Mortgage Overview in Colfax
| Characteristic | Without Mortgage | With Mortgage |
| Housing Units | 315 | 406 |
| Median Property Value | $199,700 | $244,000 |
| Median Household Income | $58,625 | $94 |
| Monthly Housing Costs | $473 | $31 |
| Real Estate Taxes | $1,650 | $9 |
Property Value by Mortgage Status in Colfax
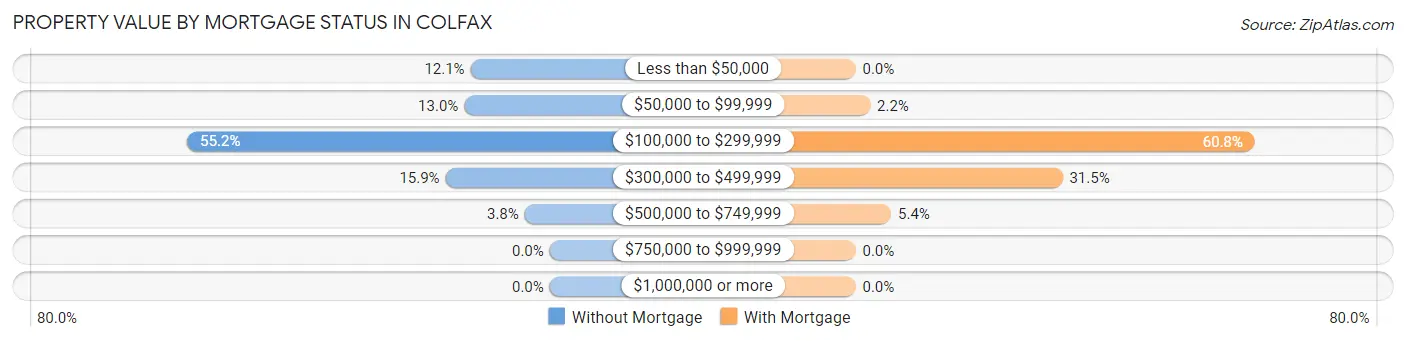
| Property Value | Without Mortgage | With Mortgage |
| Less than $50,000 | 38 (12.1%) | 0 (0.0%) |
| $50,000 to $99,999 | 41 (13.0%) | 9 (2.2%) |
| $100,000 to $299,999 | 174 (55.2%) | 247 (60.8%) |
| $300,000 to $499,999 | 50 (15.9%) | 128 (31.5%) |
| $500,000 to $749,999 | 12 (3.8%) | 22 (5.4%) |
| $750,000 to $999,999 | 0 (0.0%) | 0 (0.0%) |
| $1,000,000 or more | 0 (0.0%) | 0 (0.0%) |
| Total | 315 (100.0%) | 406 (100.0%) |
Household Income by Mortgage Status in Colfax
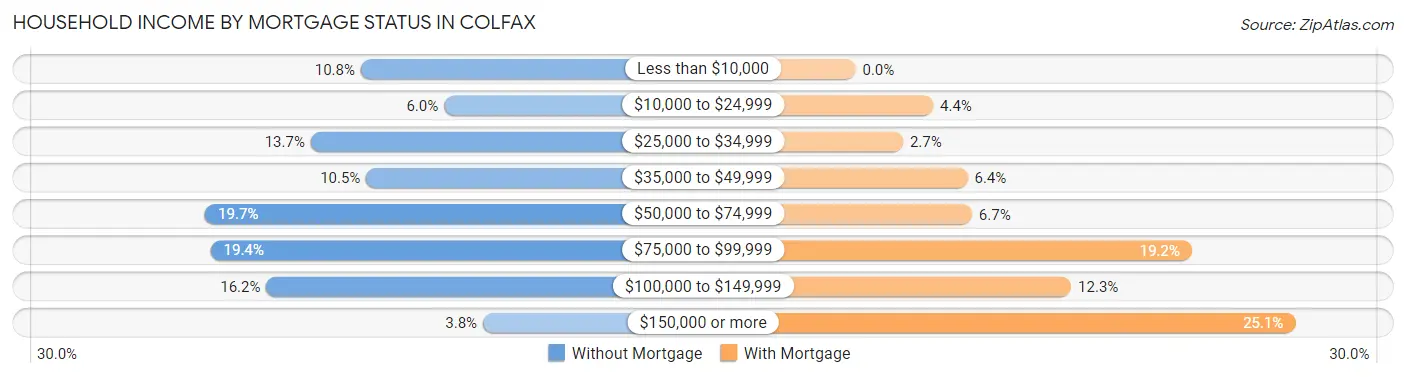
| Household Income | Without Mortgage | With Mortgage |
| Less than $10,000 | 34 (10.8%) | 0 (0.0%) |
| $10,000 to $24,999 | 19 (6.0%) | 18 (4.4%) |
| $25,000 to $34,999 | 43 (13.7%) | 11 (2.7%) |
| $35,000 to $49,999 | 33 (10.5%) | 26 (6.4%) |
| $50,000 to $74,999 | 62 (19.7%) | 27 (6.7%) |
| $75,000 to $99,999 | 61 (19.4%) | 78 (19.2%) |
| $100,000 to $149,999 | 51 (16.2%) | 50 (12.3%) |
| $150,000 or more | 12 (3.8%) | 102 (25.1%) |
| Total | 315 (100.0%) | 406 (100.0%) |
Property Value to Household Income Ratio in Colfax
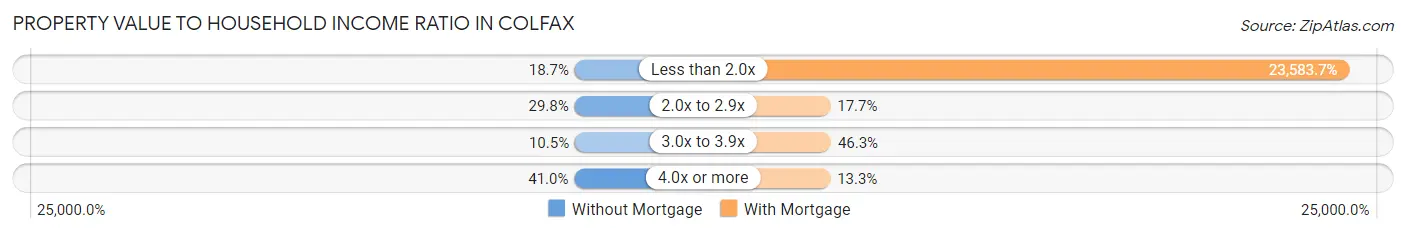
| Value-to-Income Ratio | Without Mortgage | With Mortgage |
| Less than 2.0x | 59 (18.7%) | 95,750 (23,583.7%) |
| 2.0x to 2.9x | 94 (29.8%) | 72 (17.7%) |
| 3.0x to 3.9x | 33 (10.5%) | 188 (46.3%) |
| 4.0x or more | 129 (40.9%) | 54 (13.3%) |
| Total | 315 (100.0%) | 406 (100.0%) |
Real Estate Taxes by Mortgage Status in Colfax
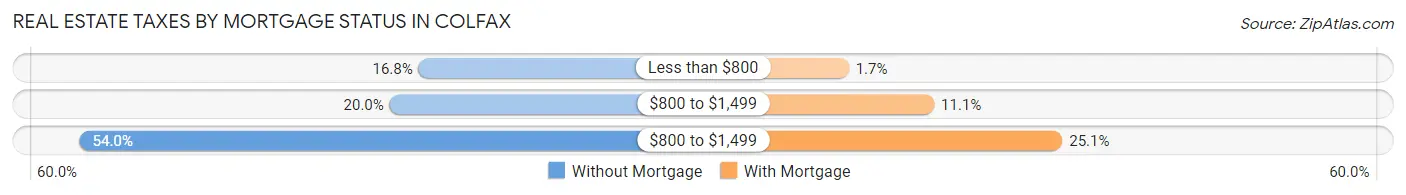
| Property Taxes | Without Mortgage | With Mortgage |
| Less than $800 | 53 (16.8%) | 7 (1.7%) |
| $800 to $1,499 | 63 (20.0%) | 45 (11.1%) |
| $800 to $1,499 | 170 (54.0%) | 102 (25.1%) |
| Total | 315 (100.0%) | 406 (100.0%) |
Health & Disability in Colfax
Health Insurance Coverage by Age in Colfax
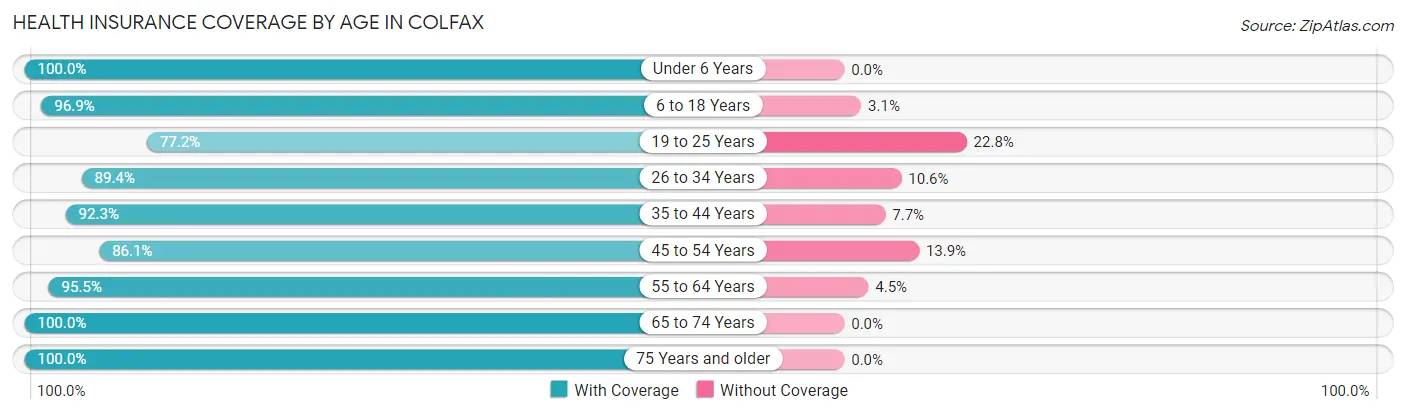
| Age Bracket | With Coverage | Without Coverage |
| Under 6 Years | 150 (100.0%) | 0 (0.0%) |
| 6 to 18 Years | 370 (96.9%) | 12 (3.1%) |
| 19 to 25 Years | 115 (77.2%) | 34 (22.8%) |
| 26 to 34 Years | 210 (89.4%) | 25 (10.6%) |
| 35 to 44 Years | 386 (92.3%) | 32 (7.7%) |
| 45 to 54 Years | 204 (86.1%) | 33 (13.9%) |
| 55 to 64 Years | 555 (95.5%) | 26 (4.5%) |
| 65 to 74 Years | 279 (100.0%) | 0 (0.0%) |
| 75 Years and older | 291 (100.0%) | 0 (0.0%) |
| Total | 2,560 (94.1%) | 162 (5.9%) |
Health Insurance Coverage by Citizenship Status in Colfax
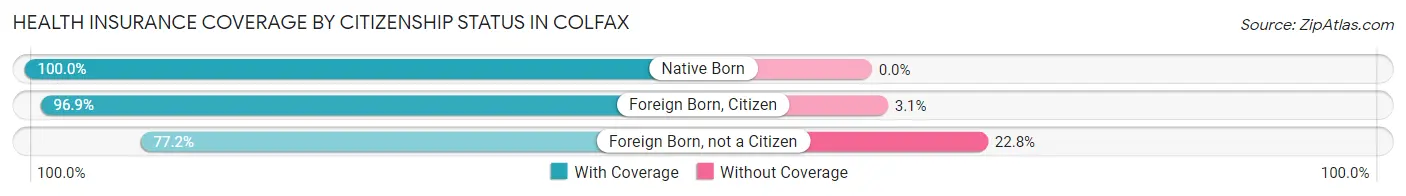
| Citizenship Status | With Coverage | Without Coverage |
| Native Born | 150 (100.0%) | 0 (0.0%) |
| Foreign Born, Citizen | 370 (96.9%) | 12 (3.1%) |
| Foreign Born, not a Citizen | 115 (77.2%) | 34 (22.8%) |
Health Insurance Coverage by Household Income in Colfax
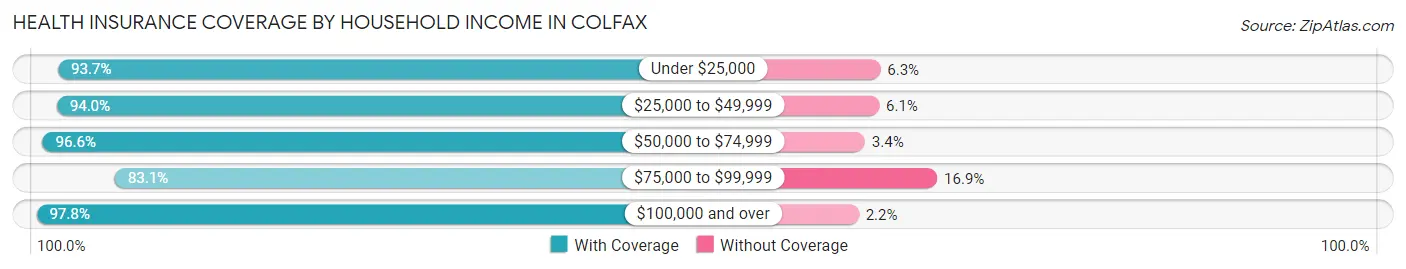
| Household Income | With Coverage | Without Coverage |
| Under $25,000 | 388 (93.7%) | 26 (6.3%) |
| $25,000 to $49,999 | 357 (94.0%) | 23 (6.0%) |
| $50,000 to $74,999 | 342 (96.6%) | 12 (3.4%) |
| $75,000 to $99,999 | 373 (83.1%) | 76 (16.9%) |
| $100,000 and over | 1,095 (97.8%) | 25 (2.2%) |
Public vs Private Health Insurance Coverage by Age in Colfax
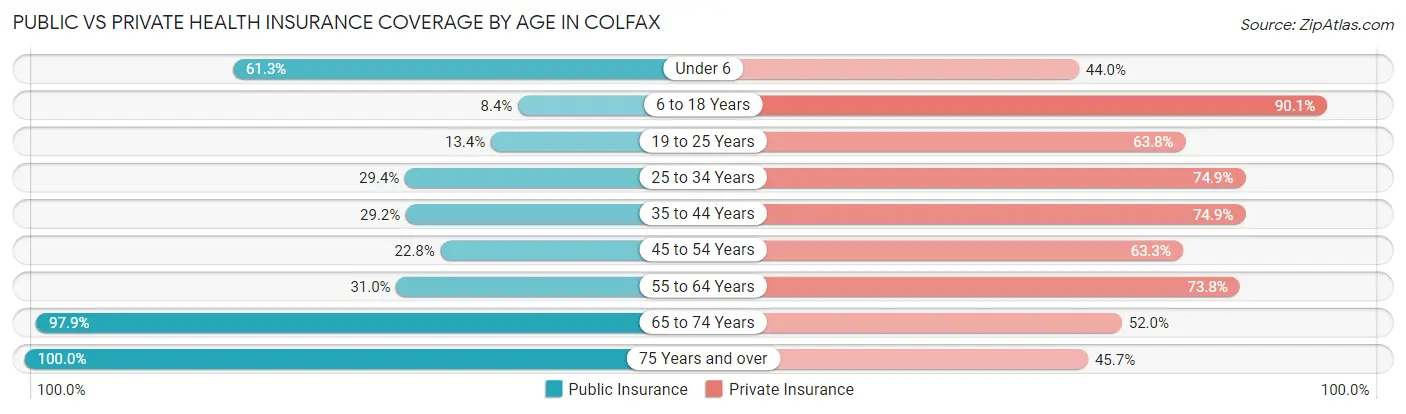
| Age Bracket | Public Insurance | Private Insurance |
| Under 6 | 92 (61.3%) | 66 (44.0%) |
| 6 to 18 Years | 32 (8.4%) | 344 (90.0%) |
| 19 to 25 Years | 20 (13.4%) | 95 (63.8%) |
| 25 to 34 Years | 69 (29.4%) | 176 (74.9%) |
| 35 to 44 Years | 122 (29.2%) | 313 (74.9%) |
| 45 to 54 Years | 54 (22.8%) | 150 (63.3%) |
| 55 to 64 Years | 180 (31.0%) | 429 (73.8%) |
| 65 to 74 Years | 273 (97.9%) | 145 (52.0%) |
| 75 Years and over | 291 (100.0%) | 133 (45.7%) |
| Total | 1,133 (41.6%) | 1,851 (68.0%) |
Disability Status by Sex by Age in Colfax
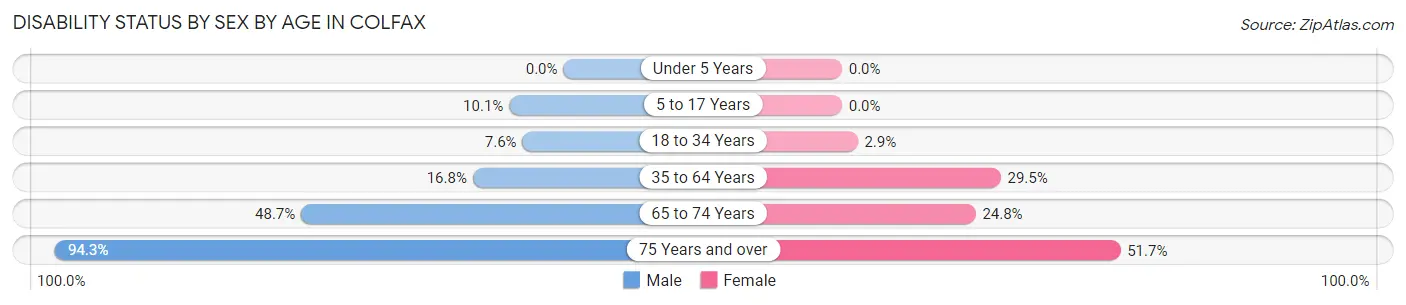
| Age Bracket | Male | Female |
| Under 5 Years | 0 (0.0%) | 0 (0.0%) |
| 5 to 17 Years | 17 (10.1%) | 0 (0.0%) |
| 18 to 34 Years | 18 (7.6%) | 5 (2.9%) |
| 35 to 64 Years | 108 (16.8%) | 175 (29.5%) |
| 65 to 74 Years | 73 (48.7%) | 32 (24.8%) |
| 75 Years and over | 50 (94.3%) | 123 (51.7%) |
Disability Class by Sex by Age in Colfax
Disability Class: Hearing Difficulty
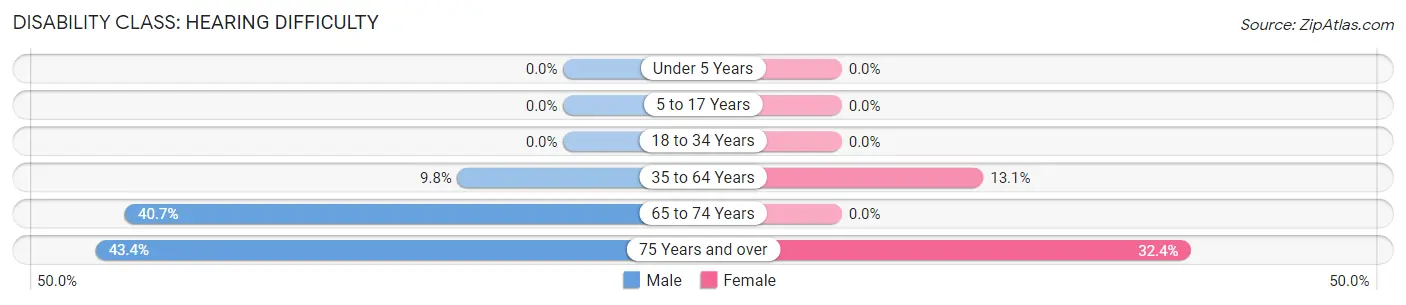
| Age Bracket | Male | Female |
| Under 5 Years | 0 (0.0%) | 0 (0.0%) |
| 5 to 17 Years | 0 (0.0%) | 0 (0.0%) |
| 18 to 34 Years | 0 (0.0%) | 0 (0.0%) |
| 35 to 64 Years | 63 (9.8%) | 78 (13.1%) |
| 65 to 74 Years | 61 (40.7%) | 0 (0.0%) |
| 75 Years and over | 23 (43.4%) | 77 (32.4%) |
Disability Class: Vision Difficulty
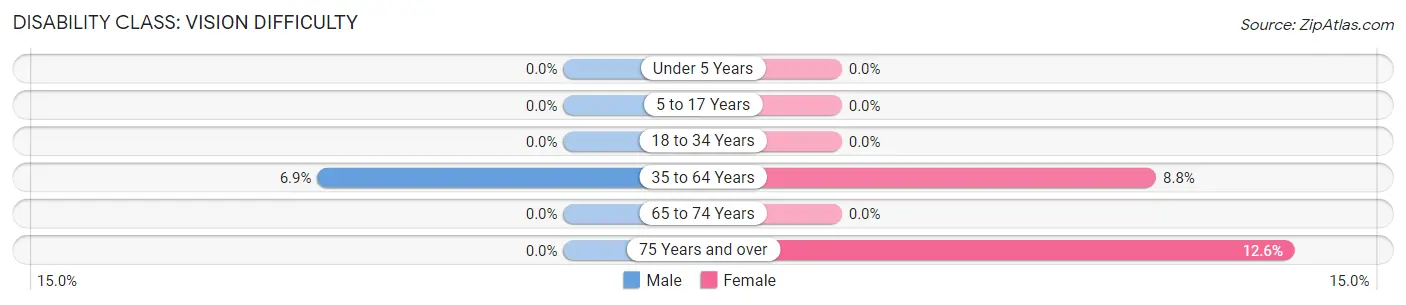
| Age Bracket | Male | Female |
| Under 5 Years | 0 (0.0%) | 0 (0.0%) |
| 5 to 17 Years | 0 (0.0%) | 0 (0.0%) |
| 18 to 34 Years | 0 (0.0%) | 0 (0.0%) |
| 35 to 64 Years | 44 (6.9%) | 52 (8.7%) |
| 65 to 74 Years | 0 (0.0%) | 0 (0.0%) |
| 75 Years and over | 0 (0.0%) | 30 (12.6%) |
Disability Class: Cognitive Difficulty
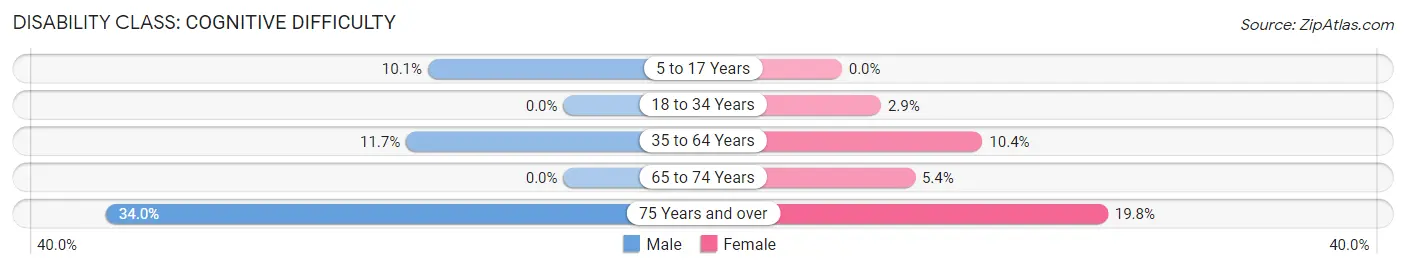
| Age Bracket | Male | Female |
| 5 to 17 Years | 17 (10.1%) | 0 (0.0%) |
| 18 to 34 Years | 0 (0.0%) | 5 (2.9%) |
| 35 to 64 Years | 75 (11.7%) | 62 (10.4%) |
| 65 to 74 Years | 0 (0.0%) | 7 (5.4%) |
| 75 Years and over | 18 (34.0%) | 47 (19.8%) |
Disability Class: Ambulatory Difficulty
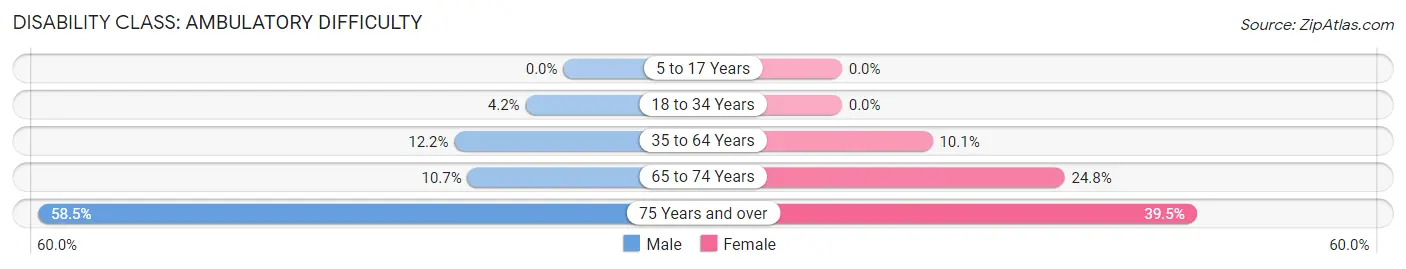
| Age Bracket | Male | Female |
| 5 to 17 Years | 0 (0.0%) | 0 (0.0%) |
| 18 to 34 Years | 10 (4.2%) | 0 (0.0%) |
| 35 to 64 Years | 78 (12.1%) | 60 (10.1%) |
| 65 to 74 Years | 16 (10.7%) | 32 (24.8%) |
| 75 Years and over | 31 (58.5%) | 94 (39.5%) |
Disability Class: Self-Care Difficulty
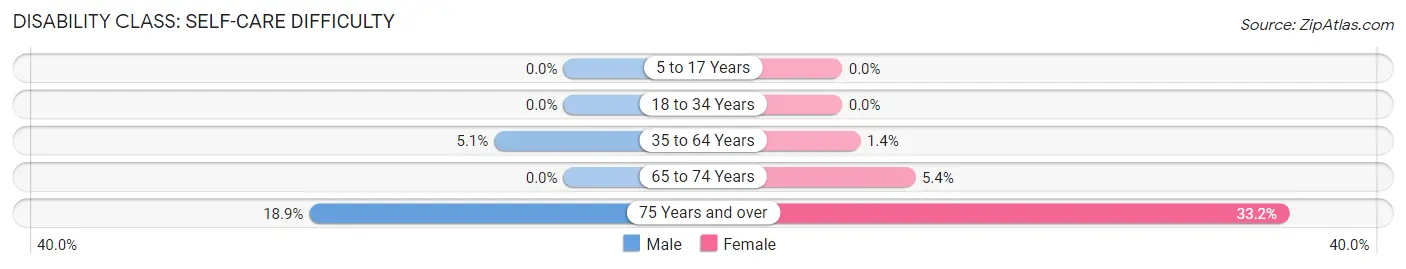
| Age Bracket | Male | Female |
| 5 to 17 Years | 0 (0.0%) | 0 (0.0%) |
| 18 to 34 Years | 0 (0.0%) | 0 (0.0%) |
| 35 to 64 Years | 33 (5.1%) | 8 (1.3%) |
| 65 to 74 Years | 0 (0.0%) | 7 (5.4%) |
| 75 Years and over | 10 (18.9%) | 79 (33.2%) |
Technology Access in Colfax
Computing Device Access in Colfax
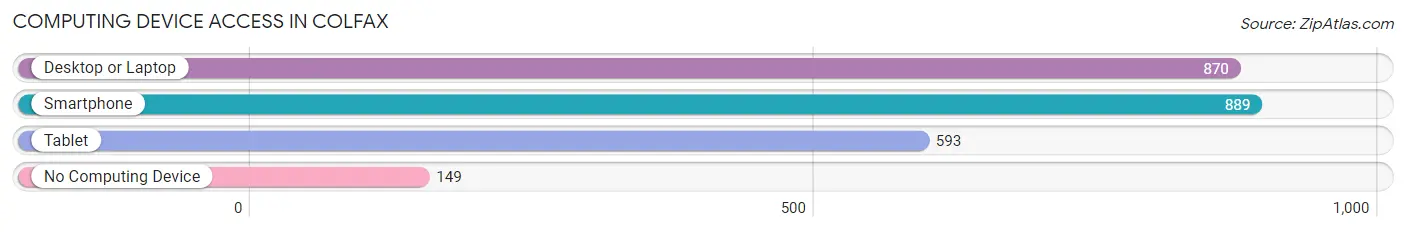
| Device Type | # Households | % Households |
| Desktop or Laptop | 870 | 74.6% |
| Smartphone | 889 | 76.2% |
| Tablet | 593 | 50.9% |
| No Computing Device | 149 | 12.8% |
| Total | 1,166 | 100.0% |
Internet Access in Colfax
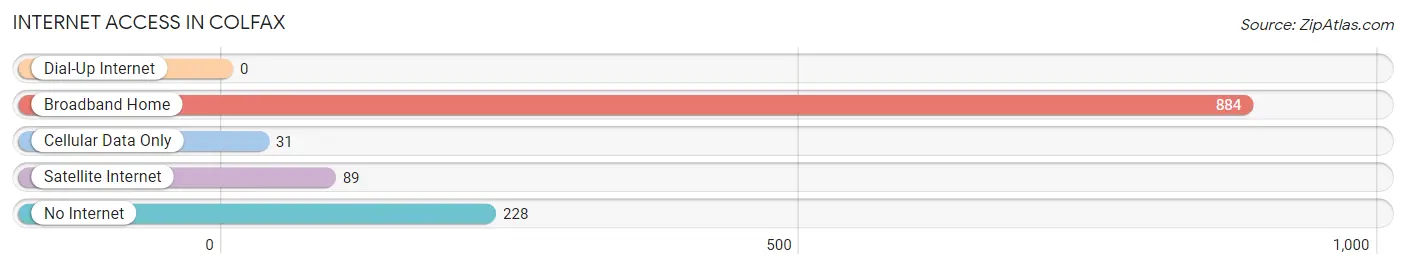
| Internet Type | # Households | % Households |
| Dial-Up Internet | 0 | 0.0% |
| Broadband Home | 884 | 75.8% |
| Cellular Data Only | 31 | 2.7% |
| Satellite Internet | 89 | 7.6% |
| No Internet | 228 | 19.6% |
| Total | 1,166 | 100.0% |
Colfax Summary
Colfax is a small town located in Whitman County, Washington, United States. It is situated on the Palouse River, approximately 20 miles east of Pullman and 30 miles west of Spokane. The population of Colfax was 2,805 at the 2010 census.
History
Colfax was founded in 1872 by the Northern Pacific Railroad. The town was named after Schuyler Colfax, the 17th Vice President of the United States. The town was originally a stop on the railroad line, but it quickly grew into a thriving community.
In the early 1900s, Colfax was a major agricultural center, with wheat, oats, barley, and potatoes being the main crops. The town also had a number of businesses, including a flour mill, a creamery, a brewery, and a brickyard.
In the 1920s, Colfax was a major stop on the Spokane, Portland and Seattle Railway. The railway brought tourists to the area, and the town became a popular destination for fishing, hunting, and camping.
Geography
Colfax is located in the Palouse region of Washington, which is characterized by rolling hills and fertile soil. The town is situated on the Palouse River, which flows through the town and provides a source of recreation for the locals.
The climate in Colfax is generally mild, with hot summers and cold winters. The average annual temperature is around 50°F (10°C).
Economy
The economy of Colfax is largely based on agriculture. Wheat, oats, barley, and potatoes are the main crops grown in the area. The town also has a number of businesses, including a flour mill, a creamery, a brewery, and a brickyard.
In recent years, Colfax has become a popular destination for tourists. The town is home to a number of attractions, including the Palouse Falls State Park, the Whitman County Historical Museum, and the Colfax Golf Course.
Demographics
As of the 2010 census, the population of Colfax was 2,805. The racial makeup of the town was 94.3% White, 0.7% African American, 0.7% Native American, 0.7% Asian, 0.2% Pacific Islander, 1.2% from other races, and 2.1% from two or more races. Hispanic or Latino of any race were 3.3% of the population.
The median household income in Colfax was $35,938, and the median family income was $45,938. The per capita income for the town was $18,938. About 11.3% of families and 15.2% of the population were below the poverty line, including 22.2% of those under age 18 and 8.3% of those age 65 or over.
Common Questions
What is Per Capita Income in Colfax?
Per Capita income in Colfax is $35,330.
What is the Median Family Income in Colfax?
Median Family Income in Colfax is $77,750.
What is the Median Household income in Colfax?
Median Household Income in Colfax is $54,659.
What is Income or Wage Gap in Colfax?
Income or Wage Gap in Colfax is 41.1%.
Women in Colfax earn 58.9 cents for every dollar earned by a man.
What is Inequality or Gini Index in Colfax?
Inequality or Gini Index in Colfax is 0.51.
What is the Total Population of Colfax?
Total Population of Colfax is 2,799.
What is the Total Male Population of Colfax?
Total Male Population of Colfax is 1,333.
What is the Total Female Population of Colfax?
Total Female Population of Colfax is 1,466.
What is the Ratio of Males per 100 Females in Colfax?
There are 90.93 Males per 100 Females in Colfax.
What is the Ratio of Females per 100 Males in Colfax?
There are 109.98 Females per 100 Males in Colfax.
What is the Median Population Age in Colfax?
Median Population Age in Colfax is 45.8 Years.
What is the Average Family Size in Colfax
Average Family Size in Colfax is 3.1 People.
What is the Average Household Size in Colfax
Average Household Size in Colfax is 2.3 People.
How Large is the Labor Force in Colfax?
There are 1,343 People in the Labor Forcein in Colfax.
What is the Percentage of People in the Labor Force in Colfax?
56.9% of People are in the Labor Force in Colfax.
What is the Unemployment Rate in Colfax?
Unemployment Rate in Colfax is 3.7%.