Cities with the Highest Percentage of Guamanian / Chamorro Population in Washington
RELATED REPORTS & OPTIONS
Guamanian / Chamorro
Washington
Compare Cities
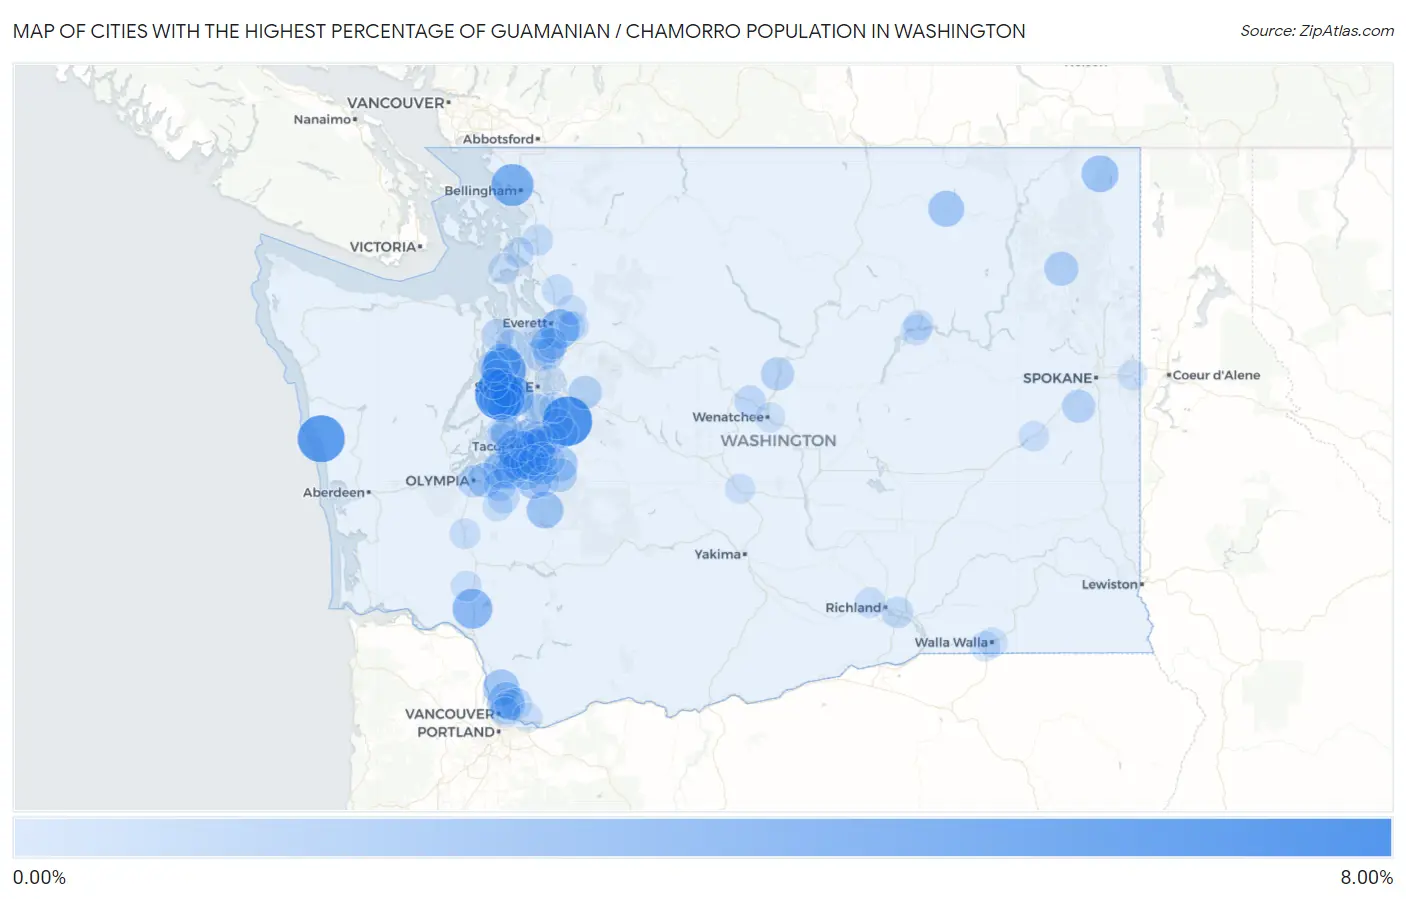
Map of Cities with the Highest Percentage of Guamanian / Chamorro Population in Washington
0.00%
8.00%
Cities with the Highest Percentage of Guamanian / Chamorro Population in Washington
| City | Guamanian / Chamorro | vs State | vs National | |
| 1. | Navy Yard City | 6.09% | 0.26%(+5.83)#1 | 0.047%(+6.05)#13 |
| 2. | Shadow Lake | 6.05% | 0.26%(+5.79)#2 | 0.047%(+6.01)#14 |
| 3. | Santiago | 5.33% | 0.26%(+5.07)#3 | 0.047%(+5.29)#16 |
| 4. | Keyport | 4.58% | 0.26%(+4.31)#4 | 0.047%(+4.53)#22 |
| 5. | Marietta Alderwood | 3.81% | 0.26%(+3.55)#5 | 0.047%(+3.77)#28 |
| 6. | Fircrest | 3.25% | 0.26%(+2.99)#6 | 0.047%(+3.21)#39 |
| 7. | Manchester | 3.15% | 0.26%(+2.88)#7 | 0.047%(+3.10)#40 |
| 8. | Castle Rock | 3.09% | 0.26%(+2.82)#8 | 0.047%(+3.04)#42 |
| 9. | Fobes Hill | 2.91% | 0.26%(+2.64)#9 | 0.047%(+2.86)#48 |
| 10. | Fife | 2.72% | 0.26%(+2.45)#10 | 0.047%(+2.67)#54 |
| 11. | Poulsbo | 2.43% | 0.26%(+2.16)#11 | 0.047%(+2.38)#63 |
| 12. | Metaline | 2.22% | 0.26%(+1.96)#12 | 0.047%(+2.18)#73 |
| 13. | Eatonville | 2.18% | 0.26%(+1.91)#13 | 0.047%(+2.13)#75 |
| 14. | Dupont | 2.13% | 0.26%(+1.86)#14 | 0.047%(+2.08)#76 |
| 15. | Duluth | 2.03% | 0.26%(+1.76)#15 | 0.047%(+1.98)#79 |
| 16. | Republic | 1.96% | 0.26%(+1.70)#16 | 0.047%(+1.92)#82 |
| 17. | Barberton | 1.90% | 0.26%(+1.64)#17 | 0.047%(+1.85)#88 |
| 18. | Martha Lake | 1.82% | 0.26%(+1.56)#18 | 0.047%(+1.78)#89 |
| 19. | Elk Plain | 1.81% | 0.26%(+1.54)#19 | 0.047%(+1.76)#90 |
| 20. | Prairie Ridge | 1.75% | 0.26%(+1.49)#20 | 0.047%(+1.71)#98 |
| 21. | Spanaway | 1.61% | 0.26%(+1.34)#21 | 0.047%(+1.56)#110 |
| 22. | Lakewood | 1.58% | 0.26%(+1.32)#22 | 0.047%(+1.53)#113 |
| 23. | Lacey | 1.56% | 0.26%(+1.29)#23 | 0.047%(+1.51)#116 |
| 24. | Dash Point | 1.52% | 0.26%(+1.25)#24 | 0.047%(+1.47)#120 |
| 25. | Tracyton | 1.50% | 0.26%(+1.23)#25 | 0.047%(+1.45)#121 |
| 26. | Parkwood | 1.48% | 0.26%(+1.21)#26 | 0.047%(+1.43)#122 |
| 27. | Bethel | 1.42% | 0.26%(+1.16)#27 | 0.047%(+1.38)#128 |
| 28. | Chewelah | 1.40% | 0.26%(+1.13)#28 | 0.047%(+1.35)#130 |
| 29. | Crocker | 1.31% | 0.26%(+1.05)#29 | 0.047%(+1.27)#136 |
| 30. | Summit View | 1.21% | 0.26%(+0.947)#30 | 0.047%(+1.17)#146 |
| 31. | Fall City | 1.19% | 0.26%(+0.924)#31 | 0.047%(+1.14)#148 |
| 32. | Entiat | 1.16% | 0.26%(+0.891)#32 | 0.047%(+1.11)#153 |
| 33. | Fort Lewis | 1.14% | 0.26%(+0.874)#33 | 0.047%(+1.09)#156 |
| 34. | Cheney | 1.14% | 0.26%(+0.872)#34 | 0.047%(+1.09)#157 |
| 35. | Gig Harbor | 1.12% | 0.26%(+0.851)#35 | 0.047%(+1.07)#159 |
| 36. | Milton | 1.05% | 0.26%(+0.789)#36 | 0.047%(+1.01)#172 |
| 37. | Fife Heights | 1.02% | 0.26%(+0.752)#37 | 0.047%(+0.971)#177 |
| 38. | Bremerton | 1.01% | 0.26%(+0.749)#38 | 0.047%(+0.967)#180 |
| 39. | Port Orchard | 0.97% | 0.26%(+0.702)#39 | 0.047%(+0.921)#195 |
| 40. | Enetai | 0.96% | 0.26%(+0.698)#40 | 0.047%(+0.917)#196 |
| 41. | Olympia | 0.93% | 0.26%(+0.667)#41 | 0.047%(+0.885)#204 |
| 42. | Mountlake Terrace | 0.91% | 0.26%(+0.644)#42 | 0.047%(+0.862)#211 |
| 43. | Port Ludlow | 0.87% | 0.26%(+0.607)#43 | 0.047%(+0.826)#219 |
| 44. | Nisqually Indian Community | 0.84% | 0.26%(+0.578)#44 | 0.047%(+0.797)#227 |
| 45. | Mcchord Afb | 0.79% | 0.26%(+0.529)#45 | 0.047%(+0.747)#239 |
| 46. | North Fort Lewis | 0.76% | 0.26%(+0.499)#46 | 0.047%(+0.717)#248 |
| 47. | South Hill | 0.75% | 0.26%(+0.486)#47 | 0.047%(+0.704)#254 |
| 48. | Cashmere | 0.74% | 0.26%(+0.475)#48 | 0.047%(+0.693)#264 |
| 49. | Orchards | 0.74% | 0.26%(+0.471)#49 | 0.047%(+0.689)#265 |
| 50. | Clover Creek | 0.72% | 0.26%(+0.456)#50 | 0.047%(+0.674)#271 |
| 51. | Parkland | 0.72% | 0.26%(+0.454)#51 | 0.047%(+0.672)#273 |
| 52. | Yelm | 0.71% | 0.26%(+0.444)#52 | 0.047%(+0.662)#276 |
| 53. | Auburn | 0.70% | 0.26%(+0.439)#53 | 0.047%(+0.658)#279 |
| 54. | Lakeland South | 0.68% | 0.26%(+0.417)#54 | 0.047%(+0.636)#288 |
| 55. | West Pasco | 0.64% | 0.26%(+0.377)#55 | 0.047%(+0.595)#306 |
| 56. | Lake Morton Berrydale | 0.63% | 0.26%(+0.366)#56 | 0.047%(+0.585)#311 |
| 57. | Bangor Base | 0.61% | 0.26%(+0.347)#57 | 0.047%(+0.566)#321 |
| 58. | Artondale | 0.61% | 0.26%(+0.341)#58 | 0.047%(+0.559)#323 |
| 59. | Minnehaha | 0.60% | 0.26%(+0.331)#59 | 0.047%(+0.549)#328 |
| 60. | Bothell West | 0.59% | 0.26%(+0.329)#60 | 0.047%(+0.548)#329 |
| 61. | Port Gamble Tribal Community | 0.59% | 0.26%(+0.323)#61 | 0.047%(+0.542)#333 |
| 62. | Burlington | 0.59% | 0.26%(+0.323)#62 | 0.047%(+0.541)#334 |
| 63. | Mill Creek | 0.56% | 0.26%(+0.298)#63 | 0.047%(+0.516)#345 |
| 64. | Mukilteo | 0.56% | 0.26%(+0.292)#64 | 0.047%(+0.510)#351 |
| 65. | Arlington | 0.55% | 0.26%(+0.288)#65 | 0.047%(+0.506)#352 |
| 66. | Tukwila | 0.51% | 0.26%(+0.250)#66 | 0.047%(+0.468)#375 |
| 67. | University Place | 0.48% | 0.26%(+0.219)#67 | 0.047%(+0.438)#394 |
| 68. | Grand Coulee | 0.48% | 0.26%(+0.219)#68 | 0.047%(+0.437)#395 |
| 69. | Graham | 0.48% | 0.26%(+0.215)#69 | 0.047%(+0.434)#399 |
| 70. | Oak Harbor | 0.47% | 0.26%(+0.201)#70 | 0.047%(+0.420)#411 |
| 71. | Kent | 0.46% | 0.26%(+0.198)#71 | 0.047%(+0.417)#416 |
| 72. | Burien | 0.45% | 0.26%(+0.186)#72 | 0.047%(+0.404)#422 |
| 73. | Five Corners | 0.45% | 0.26%(+0.185)#73 | 0.047%(+0.403)#423 |
| 74. | Vader | 0.45% | 0.26%(+0.184)#74 | 0.047%(+0.402)#424 |
| 75. | Centralia | 0.42% | 0.26%(+0.152)#75 | 0.047%(+0.370)#443 |
| 76. | Vancouver | 0.41% | 0.26%(+0.143)#76 | 0.047%(+0.361)#450 |
| 77. | La Conner | 0.40% | 0.26%(+0.135)#77 | 0.047%(+0.353)#457 |
| 78. | West Richland | 0.37% | 0.26%(+0.110)#78 | 0.047%(+0.328)#485 |
| 79. | Tacoma | 0.37% | 0.26%(+0.106)#79 | 0.047%(+0.324)#491 |
| 80. | College Place | 0.34% | 0.26%(+0.072)#80 | 0.047%(+0.290)#520 |
| 81. | Federal Way | 0.32% | 0.26%(+0.059)#81 | 0.047%(+0.278)#532 |
| 82. | Sprague | 0.32% | 0.26%(+0.052)#82 | 0.047%(+0.270)#545 |
| 83. | Yarrow Point | 0.31% | 0.26%(+0.048)#83 | 0.047%(+0.266)#551 |
| 84. | Snohomish | 0.31% | 0.26%(+0.041)#84 | 0.047%(+0.259)#559 |
| 85. | Coulee Dam | 0.30% | 0.26%(+0.035)#85 | 0.047%(+0.253)#567 |
| 86. | Lochsloy | 0.30% | 0.26%(+0.034)#86 | 0.047%(+0.252)#570 |
| 87. | Alderton | 0.30% | 0.26%(+0.033)#87 | 0.047%(+0.251)#572 |
| 88. | Rainier | 0.30% | 0.26%(+0.031)#88 | 0.047%(+0.249)#573 |
| 89. | Silverdale | 0.29% | 0.26%(+0.029)#89 | 0.047%(+0.247)#575 |
| 90. | Chico | 0.29% | 0.26%(+0.028)#90 | 0.047%(+0.246)#578 |
| 91. | Puyallup | 0.29% | 0.26%(+0.026)#91 | 0.047%(+0.244)#581 |
| 92. | Everett | 0.28% | 0.26%(+0.018)#92 | 0.047%(+0.237)#595 |
| 93. | Rosedale | 0.28% | 0.26%(+0.016)#93 | 0.047%(+0.234)#598 |
| 94. | Walla Walla | 0.28% | 0.26%(+0.016)#94 | 0.047%(+0.234)#599 |
| 95. | Ellensburg | 0.28% | 0.26%(+0.014)#95 | 0.047%(+0.232)#603 |
| 96. | Summit | 0.27% | 0.26%(+0.007)#96 | 0.047%(+0.226)#613 |
| 97. | Renton | 0.27% | 0.26%(+0.007)#97 | 0.047%(+0.225)#617 |
| 98. | East Wenatchee | 0.27% | 0.26%(+0.005)#98 | 0.047%(+0.224)#620 |
| 99. | Liberty Lake | 0.26% | 0.26%(-0.007)#99 | 0.047%(+0.211)#645 |
| 100. | Camas | 0.24% | 0.26%(-0.022)#100 | 0.047%(+0.196)#670 |
Common Questions
What are the Top 10 Cities with the Highest Percentage of Guamanian / Chamorro Population in Washington?
Top 10 Cities with the Highest Percentage of Guamanian / Chamorro Population in Washington are:
#1
6.09%
#2
6.05%
#3
5.33%
#4
4.58%
#5
3.81%
#6
3.25%
#7
3.15%
#8
3.09%
#9
2.91%
#10
2.72%
What city has the Highest Percentage of Guamanian / Chamorro Population in Washington?
Navy Yard City has the Highest Percentage of Guamanian / Chamorro Population in Washington with 6.09%.
What is the Percentage of Guamanian / Chamorro Population in the State of Washington?
Percentage of Guamanian / Chamorro Population in Washington is 0.26%.
What is the Percentage of Guamanian / Chamorro Population in the United States?
Percentage of Guamanian / Chamorro Population in the United States is 0.047%.