Cities with the Highest Percentage of African Population in Washington
RELATED REPORTS & OPTIONS
African
Washington
Compare Cities
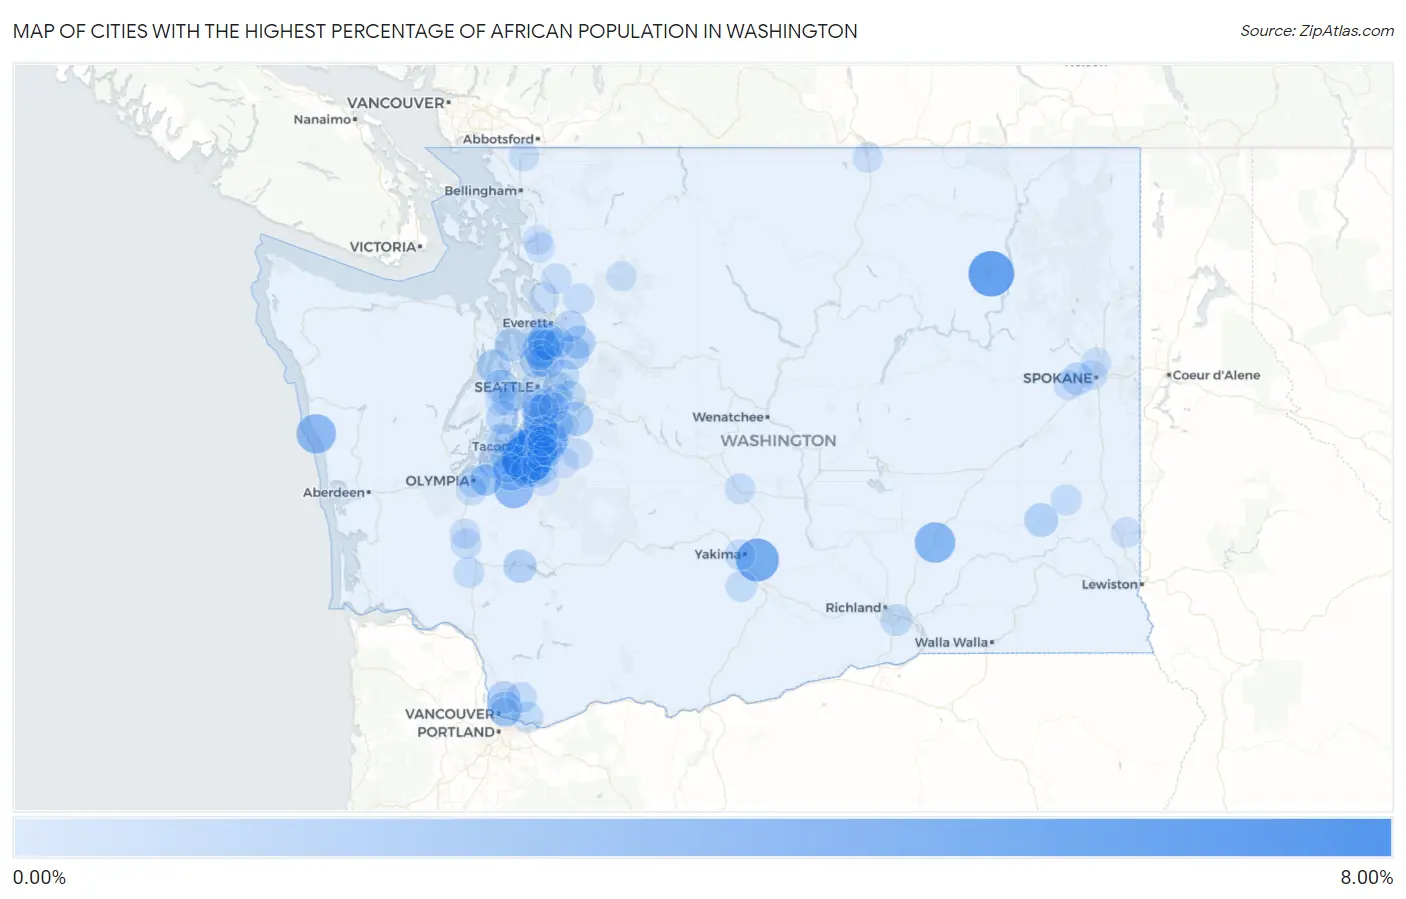
Map of Cities with the Highest Percentage of African Population in Washington
0.00%
8.00%
Cities with the Highest Percentage of African Population in Washington
| City | African | vs State | vs National | |
| 1. | Midland | 6.75% | 0.44%(+6.31)#1 | 0.57%(+6.18)#207 |
| 2. | Twin Lakes | 5.41% | 0.44%(+4.97)#2 | 0.57%(+4.84)#285 |
| 3. | Fife | 5.19% | 0.44%(+4.75)#3 | 0.57%(+4.62)#303 |
| 4. | Moxee | 4.44% | 0.44%(+4.00)#4 | 0.57%(+3.88)#384 |
| 5. | Connell | 3.63% | 0.44%(+3.19)#5 | 0.57%(+3.07)#482 |
| 6. | Taholah | 3.28% | 0.44%(+2.84)#6 | 0.57%(+2.72)#543 |
| 7. | Roy | 3.15% | 0.44%(+2.71)#7 | 0.57%(+2.59)#582 |
| 8. | Algona | 3.12% | 0.44%(+2.69)#8 | 0.57%(+2.56)#589 |
| 9. | Seatac | 2.56% | 0.44%(+2.12)#9 | 0.57%(+1.99)#762 |
| 10. | Lynnwood | 2.49% | 0.44%(+2.05)#10 | 0.57%(+1.92)#792 |
| 11. | Lake Stickney | 2.40% | 0.44%(+1.96)#11 | 0.57%(+1.83)#820 |
| 12. | Fort Lewis | 2.22% | 0.44%(+1.79)#12 | 0.57%(+1.66)#896 |
| 13. | Federal Way | 2.01% | 0.44%(+1.57)#13 | 0.57%(+1.45)#1,017 |
| 14. | Auburn | 1.74% | 0.44%(+1.31)#14 | 0.57%(+1.18)#1,187 |
| 15. | Minnehaha | 1.72% | 0.44%(+1.28)#15 | 0.57%(+1.15)#1,208 |
| 16. | Parkland | 1.65% | 0.44%(+1.21)#16 | 0.57%(+1.09)#1,273 |
| 17. | High Bridge | 1.53% | 0.44%(+1.09)#17 | 0.57%(+0.967)#1,376 |
| 18. | Hobart | 1.48% | 0.44%(+1.04)#18 | 0.57%(+0.916)#1,434 |
| 19. | Des Moines | 1.47% | 0.44%(+1.03)#19 | 0.57%(+0.904)#1,452 |
| 20. | Bangor Base | 1.46% | 0.44%(+1.02)#20 | 0.57%(+0.890)#1,472 |
| 21. | Lacrosse | 1.44% | 0.44%(+0.999)#21 | 0.57%(+0.873)#1,487 |
| 22. | Kenmore | 1.38% | 0.44%(+0.937)#22 | 0.57%(+0.811)#1,566 |
| 23. | Monroe | 1.33% | 0.44%(+0.890)#23 | 0.57%(+0.764)#1,629 |
| 24. | Tacoma | 1.33% | 0.44%(+0.887)#24 | 0.57%(+0.761)#1,636 |
| 25. | Mossyrock | 1.32% | 0.44%(+0.878)#25 | 0.57%(+0.752)#1,655 |
| 26. | Port Gamble Tribal Community | 1.29% | 0.44%(+0.855)#26 | 0.57%(+0.729)#1,688 |
| 27. | Tracyton | 1.28% | 0.44%(+0.843)#27 | 0.57%(+0.717)#1,704 |
| 28. | Shoreline | 1.23% | 0.44%(+0.788)#28 | 0.57%(+0.662)#1,780 |
| 29. | Frederickson | 1.16% | 0.44%(+0.717)#29 | 0.57%(+0.591)#1,872 |
| 30. | Burley | 1.14% | 0.44%(+0.700)#30 | 0.57%(+0.574)#1,893 |
| 31. | Bryn Mawr Skyway | 1.10% | 0.44%(+0.664)#31 | 0.57%(+0.538)#1,959 |
| 32. | Airway Heights | 1.07% | 0.44%(+0.630)#32 | 0.57%(+0.504)#2,021 |
| 33. | Mount Vista | 1.07% | 0.44%(+0.628)#33 | 0.57%(+0.502)#2,024 |
| 34. | Anderson Island | 1.05% | 0.44%(+0.609)#34 | 0.57%(+0.483)#2,054 |
| 35. | Steilacoom | 1.02% | 0.44%(+0.579)#35 | 0.57%(+0.453)#2,104 |
| 36. | North Lynnwood | 0.87% | 0.44%(+0.435)#36 | 0.57%(+0.309)#2,397 |
| 37. | Everett | 0.83% | 0.44%(+0.393)#37 | 0.57%(+0.267)#2,501 |
| 38. | Bellevue | 0.82% | 0.44%(+0.380)#38 | 0.57%(+0.254)#2,539 |
| 39. | Kennewick | 0.80% | 0.44%(+0.357)#39 | 0.57%(+0.232)#2,593 |
| 40. | Olympia | 0.72% | 0.44%(+0.279)#40 | 0.57%(+0.153)#2,827 |
| 41. | Lakewood | 0.71% | 0.44%(+0.275)#41 | 0.57%(+0.149)#2,842 |
| 42. | Parkwood | 0.71% | 0.44%(+0.273)#42 | 0.57%(+0.147)#2,852 |
| 43. | Kent | 0.71% | 0.44%(+0.266)#43 | 0.57%(+0.140)#2,875 |
| 44. | Issaquah | 0.67% | 0.44%(+0.231)#44 | 0.57%(+0.105)#2,982 |
| 45. | Mukilteo | 0.67% | 0.44%(+0.230)#45 | 0.57%(+0.104)#2,987 |
| 46. | Lacey | 0.65% | 0.44%(+0.215)#46 | 0.57%(+0.089)#3,031 |
| 47. | Wollochet | 0.65% | 0.44%(+0.207)#47 | 0.57%(+0.081)#3,062 |
| 48. | Tanglewilde | 0.64% | 0.44%(+0.200)#48 | 0.57%(+0.075)#3,084 |
| 49. | Camas | 0.63% | 0.44%(+0.190)#49 | 0.57%(+0.064)#3,123 |
| 50. | Harrah | 0.63% | 0.44%(+0.186)#50 | 0.57%(+0.060)#3,135 |
| 51. | Seattle | 0.59% | 0.44%(+0.147)#51 | 0.57%(+0.021)#3,287 |
| 52. | Spanaway | 0.59% | 0.44%(+0.146)#52 | 0.57%(+0.020)#3,291 |
| 53. | Lake Forest Park | 0.56% | 0.44%(+0.125)#53 | 0.57%(-0.001)#3,383 |
| 54. | Winlock | 0.56% | 0.44%(+0.122)#54 | 0.57%(-0.004)#3,393 |
| 55. | South Hill | 0.56% | 0.44%(+0.118)#55 | 0.57%(-0.008)#3,408 |
| 56. | Hockinson | 0.55% | 0.44%(+0.109)#56 | 0.57%(-0.017)#3,442 |
| 57. | Artondale | 0.55% | 0.44%(+0.109)#57 | 0.57%(-0.017)#3,446 |
| 58. | Redmond | 0.55% | 0.44%(+0.109)#58 | 0.57%(-0.017)#3,447 |
| 59. | Endicott | 0.53% | 0.44%(+0.090)#59 | 0.57%(-0.036)#3,512 |
| 60. | Martha Lake | 0.53% | 0.44%(+0.089)#60 | 0.57%(-0.037)#3,515 |
| 61. | Milton | 0.53% | 0.44%(+0.087)#61 | 0.57%(-0.039)#3,524 |
| 62. | Yakima | 0.51% | 0.44%(+0.067)#62 | 0.57%(-0.059)#3,612 |
| 63. | Puyallup | 0.50% | 0.44%(+0.056)#63 | 0.57%(-0.070)#3,656 |
| 64. | Lake Goodwin | 0.48% | 0.44%(+0.044)#64 | 0.57%(-0.082)#3,713 |
| 65. | Tumwater | 0.45% | 0.44%(+0.013)#65 | 0.57%(-0.113)#3,877 |
| 66. | Edgewood | 0.45% | 0.44%(+0.012)#66 | 0.57%(-0.114)#3,882 |
| 67. | Mountlake Terrace | 0.45% | 0.44%(+0.010)#67 | 0.57%(-0.116)#3,889 |
| 68. | Crescent Bar | 0.44% | 0.44%(+0.005)#68 | 0.57%(-0.121)#3,916 |
| 69. | Newcastle | 0.43% | 0.44%(-0.014)#69 | 0.57%(-0.140)#4,027 |
| 70. | Covington | 0.42% | 0.44%(-0.017)#70 | 0.57%(-0.143)#4,039 |
| 71. | Canyon Creek | 0.42% | 0.44%(-0.017)#71 | 0.57%(-0.143)#4,040 |
| 72. | Chehalis | 0.41% | 0.44%(-0.027)#72 | 0.57%(-0.153)#4,096 |
| 73. | Bryant | 0.40% | 0.44%(-0.037)#73 | 0.57%(-0.163)#4,140 |
| 74. | Burien | 0.40% | 0.44%(-0.039)#74 | 0.57%(-0.165)#4,151 |
| 75. | Ellensburg | 0.39% | 0.44%(-0.050)#75 | 0.57%(-0.176)#4,203 |
| 76. | Enumclaw | 0.39% | 0.44%(-0.051)#76 | 0.57%(-0.177)#4,210 |
| 77. | Fairchild Afb | 0.38% | 0.44%(-0.063)#77 | 0.57%(-0.188)#4,272 |
| 78. | Prairie Heights | 0.37% | 0.44%(-0.068)#78 | 0.57%(-0.194)#4,291 |
| 79. | Oroville | 0.34% | 0.44%(-0.097)#79 | 0.57%(-0.223)#4,463 |
| 80. | Manchester | 0.33% | 0.44%(-0.108)#80 | 0.57%(-0.234)#4,521 |
| 81. | Pullman | 0.33% | 0.44%(-0.114)#81 | 0.57%(-0.240)#4,550 |
| 82. | Tukwila | 0.31% | 0.44%(-0.133)#82 | 0.57%(-0.259)#4,668 |
| 83. | Lynden | 0.29% | 0.44%(-0.147)#83 | 0.57%(-0.273)#4,752 |
| 84. | White Center | 0.29% | 0.44%(-0.149)#84 | 0.57%(-0.275)#4,761 |
| 85. | Centralia | 0.28% | 0.44%(-0.160)#85 | 0.57%(-0.286)#4,834 |
| 86. | Mount Vernon | 0.27% | 0.44%(-0.166)#86 | 0.57%(-0.292)#4,876 |
| 87. | Spokane | 0.26% | 0.44%(-0.175)#87 | 0.57%(-0.301)#4,941 |
| 88. | Silver Firs | 0.25% | 0.44%(-0.188)#88 | 0.57%(-0.313)#5,044 |
| 89. | Renton | 0.25% | 0.44%(-0.193)#89 | 0.57%(-0.319)#5,081 |
| 90. | Sumner | 0.25% | 0.44%(-0.194)#90 | 0.57%(-0.320)#5,094 |
| 91. | Vancouver | 0.24% | 0.44%(-0.196)#91 | 0.57%(-0.322)#5,109 |
| 92. | Darrington | 0.24% | 0.44%(-0.196)#92 | 0.57%(-0.322)#5,110 |
| 93. | Lakeland North | 0.24% | 0.44%(-0.199)#93 | 0.57%(-0.325)#5,130 |
| 94. | Port Orchard | 0.24% | 0.44%(-0.199)#94 | 0.57%(-0.325)#5,134 |
| 95. | Country Homes | 0.24% | 0.44%(-0.199)#95 | 0.57%(-0.325)#5,136 |
| 96. | Burlington | 0.24% | 0.44%(-0.204)#96 | 0.57%(-0.330)#5,177 |
| 97. | North Fort Lewis | 0.23% | 0.44%(-0.207)#97 | 0.57%(-0.333)#5,199 |
| 98. | Graham | 0.23% | 0.44%(-0.209)#98 | 0.57%(-0.335)#5,228 |
| 99. | Summit View | 0.23% | 0.44%(-0.211)#99 | 0.57%(-0.337)#5,239 |
| 100. | Lakeland South | 0.22% | 0.44%(-0.217)#100 | 0.57%(-0.343)#5,289 |
Common Questions
What are the Top 10 Cities with the Highest Percentage of African Population in Washington?
Top 10 Cities with the Highest Percentage of African Population in Washington are:
What city has the Highest Percentage of African Population in Washington?
Midland has the Highest Percentage of African Population in Washington with 6.75%.
What is the Percentage of African Population in the State of Washington?
Percentage of African Population in Washington is 0.44%.
What is the Percentage of African Population in the United States?
Percentage of African Population in the United States is 0.57%.