Kayak Point, WA Map & Demographics
Kayak Point Map
Kayak Point Overview
$47,528
PER CAPITA INCOME
$117,063
AVG FAMILY INCOME
$118,105
AVG HOUSEHOLD INCOME
22.8%
WAGE / INCOME GAP [ % ]
77.2¢/ $1
WAGE / INCOME GAP [ $ ]
0.33
INEQUALITY / GINI INDEX
1,661
TOTAL POPULATION
934
MALE POPULATION
727
FEMALE POPULATION
128.47
MALES / 100 FEMALES
77.84
FEMALES / 100 MALES
56.1
MEDIAN AGE
2.9
AVG FAMILY SIZE
2.8
AVG HOUSEHOLD SIZE
886
LABOR FORCE [ PEOPLE ]
59.2%
PERCENT IN LABOR FORCE
4.6%
UNEMPLOYMENT RATE
Income in Kayak Point
Income Overview in Kayak Point
Per Capita Income in Kayak Point is $47,528, while median incomes of families and households are $117,063 and $118,105 respectively.
| Characteristic | Number | Measure |
| Per Capita Income | 1,661 | $47,528 |
| Median Family Income | 499 | $117,063 |
| Mean Family Income | 499 | $123,664 |
| Median Household Income | 585 | $118,105 |
| Mean Household Income | 585 | $128,453 |
| Income Deficit | 499 | $0 |
| Wage / Income Gap (%) | 1,661 | 22.83% |
| Wage / Income Gap ($) | 1,661 | 77.17¢ per $1 |
| Gini / Inequality Index | 1,661 | 0.33 |
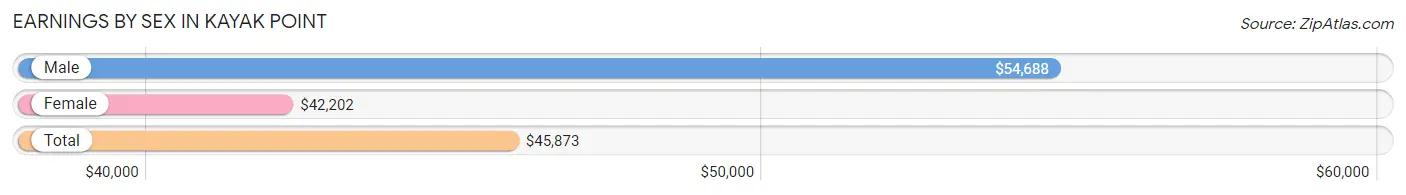
Earnings by Sex in Kayak Point
Average Earnings in Kayak Point are $45,873, $54,688 for men and $42,202 for women, a difference of 22.8%.
| Sex | Number | Average Earnings |
| Male | 542 (59.2%) | $54,688 |
| Female | 373 (40.8%) | $42,202 |
| Total | 915 (100.0%) | $45,873 |
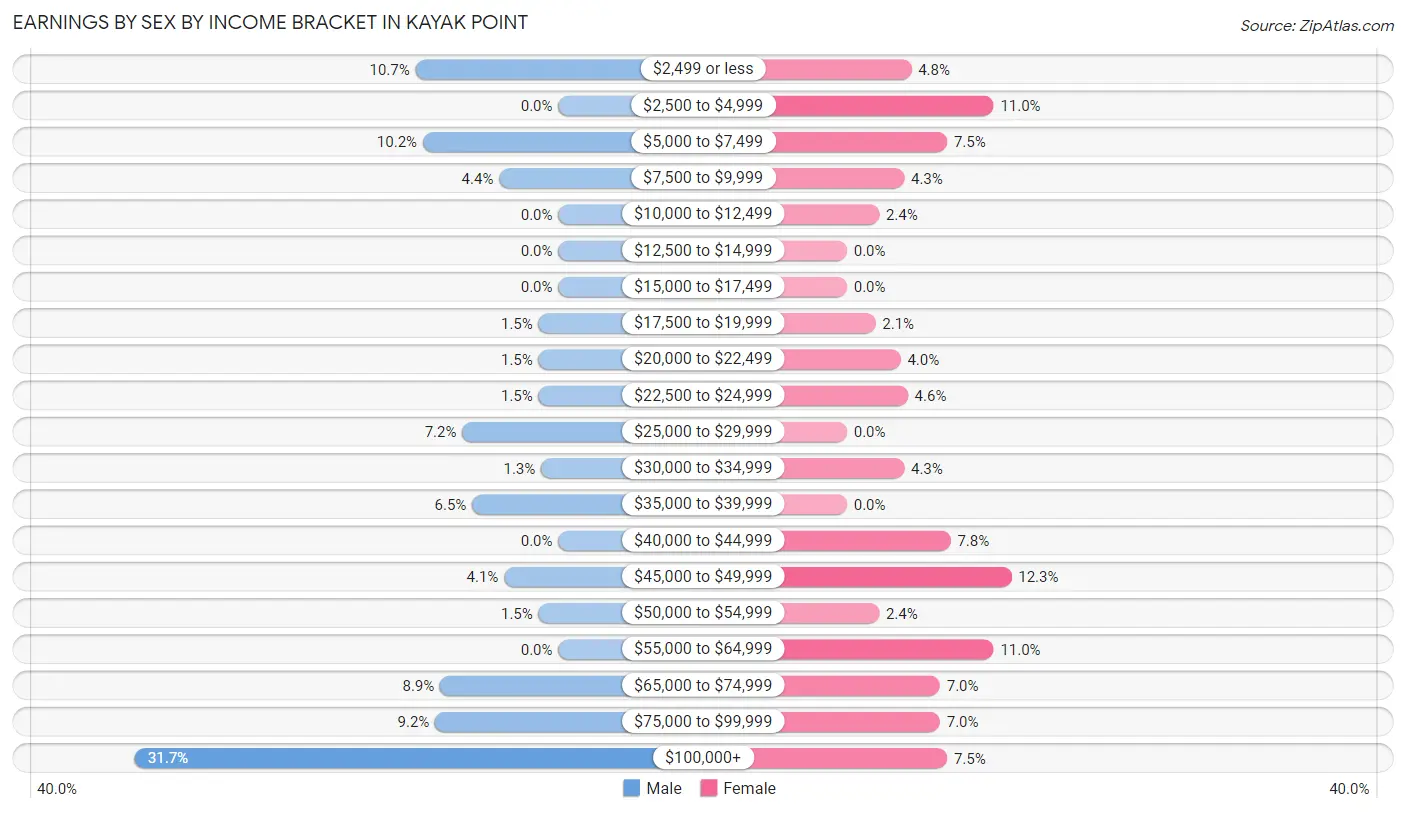
Earnings by Sex by Income Bracket in Kayak Point
The most common earnings brackets in Kayak Point are $100,000+ for men (172 | 31.7%) and $45,000 to $49,999 for women (46 | 12.3%).
| Income | Male | Female |
| $2,499 or less | 58 (10.7%) | 18 (4.8%) |
| $2,500 to $4,999 | 0 (0.0%) | 41 (11.0%) |
| $5,000 to $7,499 | 55 (10.2%) | 28 (7.5%) |
| $7,500 to $9,999 | 24 (4.4%) | 16 (4.3%) |
| $10,000 to $12,499 | 0 (0.0%) | 9 (2.4%) |
| $12,500 to $14,999 | 0 (0.0%) | 0 (0.0%) |
| $15,000 to $17,499 | 0 (0.0%) | 0 (0.0%) |
| $17,500 to $19,999 | 8 (1.5%) | 8 (2.1%) |
| $20,000 to $22,499 | 8 (1.5%) | 15 (4.0%) |
| $22,500 to $24,999 | 8 (1.5%) | 17 (4.6%) |
| $25,000 to $29,999 | 39 (7.2%) | 0 (0.0%) |
| $30,000 to $34,999 | 7 (1.3%) | 16 (4.3%) |
| $35,000 to $39,999 | 35 (6.5%) | 0 (0.0%) |
| $40,000 to $44,999 | 0 (0.0%) | 29 (7.8%) |
| $45,000 to $49,999 | 22 (4.1%) | 46 (12.3%) |
| $50,000 to $54,999 | 8 (1.5%) | 9 (2.4%) |
| $55,000 to $64,999 | 0 (0.0%) | 41 (11.0%) |
| $65,000 to $74,999 | 48 (8.9%) | 26 (7.0%) |
| $75,000 to $99,999 | 50 (9.2%) | 26 (7.0%) |
| $100,000+ | 172 (31.7%) | 28 (7.5%) |
| Total | 542 (100.0%) | 373 (100.0%) |
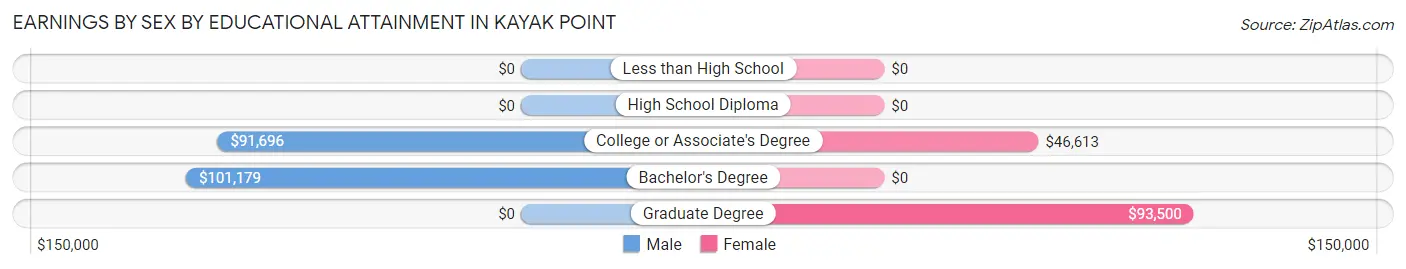
Earnings by Sex by Educational Attainment in Kayak Point
Average earnings in Kayak Point are $78,750 for men and $46,089 for women, a difference of 41.5%. Men with an educational attainment of bachelor's degree enjoy the highest average annual earnings of $101,179, while those with college or associate's degree education earn the least with $91,696. Women with an educational attainment of graduate degree earn the most with the average annual earnings of $93,500, while those with college or associate's degree education have the smallest earnings of $46,613.
| Educational Attainment | Male Income | Female Income |
| Less than High School | - | - |
| High School Diploma | - | - |
| College or Associate's Degree | $91,696 | $46,613 |
| Bachelor's Degree | $101,179 | $0 |
| Graduate Degree | - | - |
| Total | $78,750 | $46,089 |
Family Income in Kayak Point
Family Income Brackets in Kayak Point
According to the Kayak Point family income data, there are 128 families falling into the $100,000 to $149,999 income range, which is the most common income bracket and makes up 25.7% of all families.
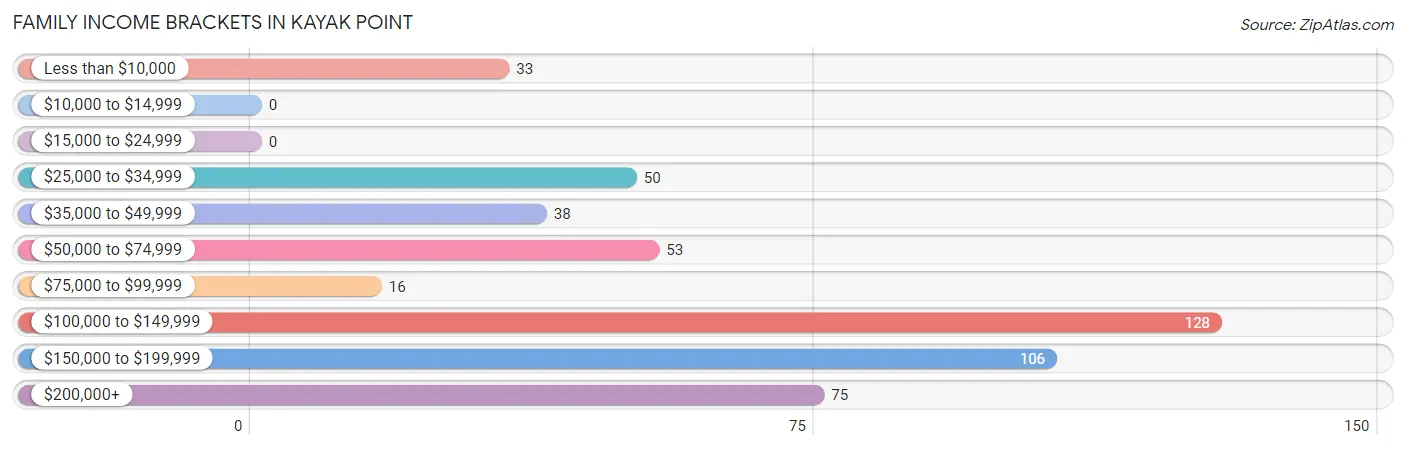
| Income Bracket | # Families | % Families |
| Less than $10,000 | 33 | 6.6% |
| $10,000 to $14,999 | 0 | 0.0% |
| $15,000 to $24,999 | 0 | 0.0% |
| $25,000 to $34,999 | 50 | 10.0% |
| $35,000 to $49,999 | 38 | 7.6% |
| $50,000 to $74,999 | 53 | 10.6% |
| $75,000 to $99,999 | 16 | 3.2% |
| $100,000 to $149,999 | 128 | 25.7% |
| $150,000 to $199,999 | 106 | 21.2% |
| $200,000+ | 75 | 15.0% |
Family Income by Famaliy Size in Kayak Point
4-person families (40 | 8.0%) account for the highest median family income in Kayak Point with $130,735 per family, while 2-person families (313 | 62.7%) have the highest median income of $57,656 per family member.
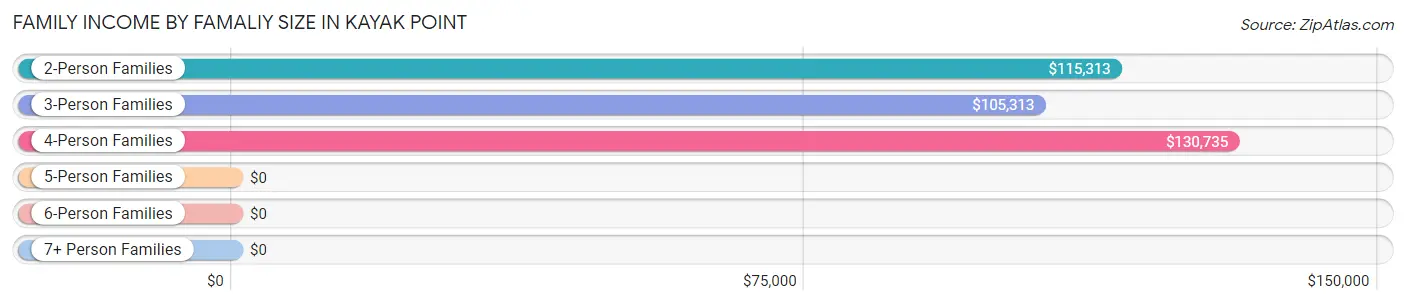
| Income Bracket | # Families | Median Income |
| 2-Person Families | 313 (62.7%) | $115,313 |
| 3-Person Families | 98 (19.6%) | $105,313 |
| 4-Person Families | 40 (8.0%) | $130,735 |
| 5-Person Families | 23 (4.6%) | $0 |
| 6-Person Families | 25 (5.0%) | $0 |
| 7+ Person Families | 0 (0.0%) | $0 |
| Total | 499 (100.0%) | $117,063 |
Family Income by Number of Earners in Kayak Point
The median family income in Kayak Point is $117,063, with families comprising 3+ earners (60) having the highest median family income of $173,125, while families with no earners (105) have the lowest median family income of $46,141, accounting for 12.0% and 21.0% of families, respectively.
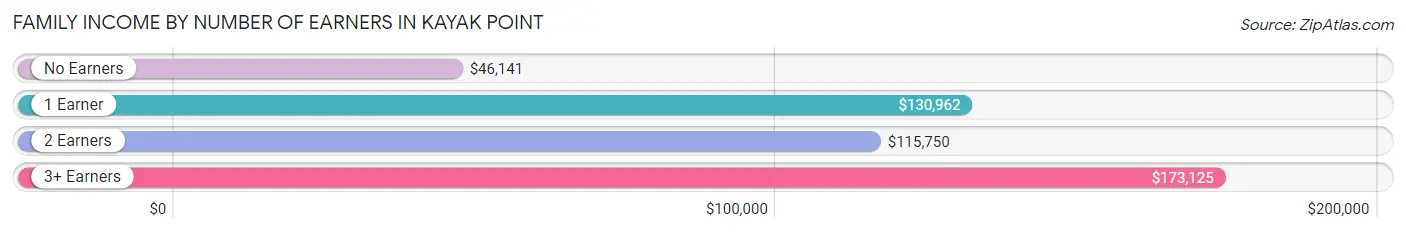
| Number of Earners | # Families | Median Income |
| No Earners | 105 (21.0%) | $46,141 |
| 1 Earner | 172 (34.5%) | $130,962 |
| 2 Earners | 162 (32.5%) | $115,750 |
| 3+ Earners | 60 (12.0%) | $173,125 |
| Total | 499 (100.0%) | $117,063 |
Household Income in Kayak Point
Household Income Brackets in Kayak Point
With 161 households falling in the category, the $100,000 to $149,999 income range is the most frequent in Kayak Point, accounting for 27.5% of all households.
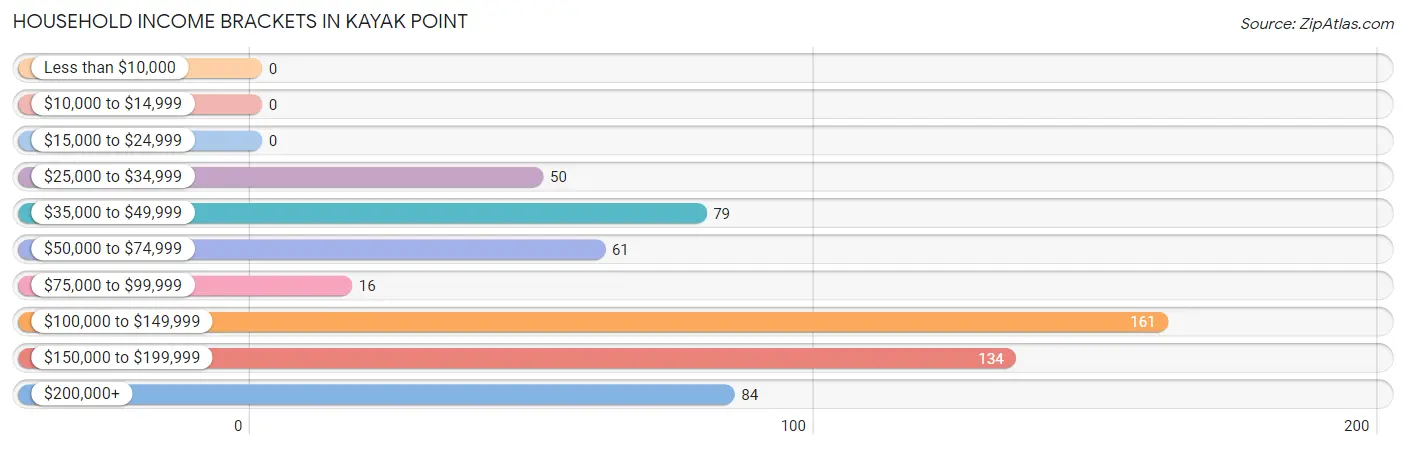
| Income Bracket | # Households | % Households |
| Less than $10,000 | 0 | 0.0% |
| $10,000 to $14,999 | 0 | 0.0% |
| $15,000 to $24,999 | 0 | 0.0% |
| $25,000 to $34,999 | 50 | 8.5% |
| $35,000 to $49,999 | 79 | 13.5% |
| $50,000 to $74,999 | 61 | 10.4% |
| $75,000 to $99,999 | 16 | 2.7% |
| $100,000 to $149,999 | 161 | 27.5% |
| $150,000 to $199,999 | 134 | 22.9% |
| $200,000+ | 84 | 14.4% |
Household Income by Householder Age in Kayak Point
The median household income in Kayak Point is $118,105, with the highest median household income of $156,250 found in the 25 to 44 years age bracket for the primary householder. A total of 92 households (15.7%) fall into this category.
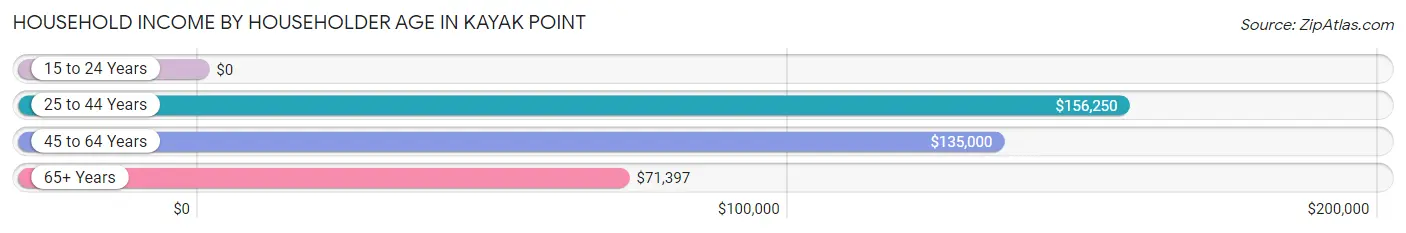
| Income Bracket | # Households | Median Income |
| 15 to 24 Years | 0 (0.0%) | $0 |
| 25 to 44 Years | 92 (15.7%) | $156,250 |
| 45 to 64 Years | 248 (42.4%) | $135,000 |
| 65+ Years | 245 (41.9%) | $71,397 |
| Total | 585 (100.0%) | $118,105 |
Poverty in Kayak Point
Income Below Poverty by Sex and Age in Kayak Point
With 8.5% poverty level for males and 4.3% for females among the residents of Kayak Point, 16 and 17 year old males and 18 to 24 year old females are the most vulnerable to poverty, with 46 males (83.6%) and 22 females (40.7%) in their respective age groups living below the poverty level.
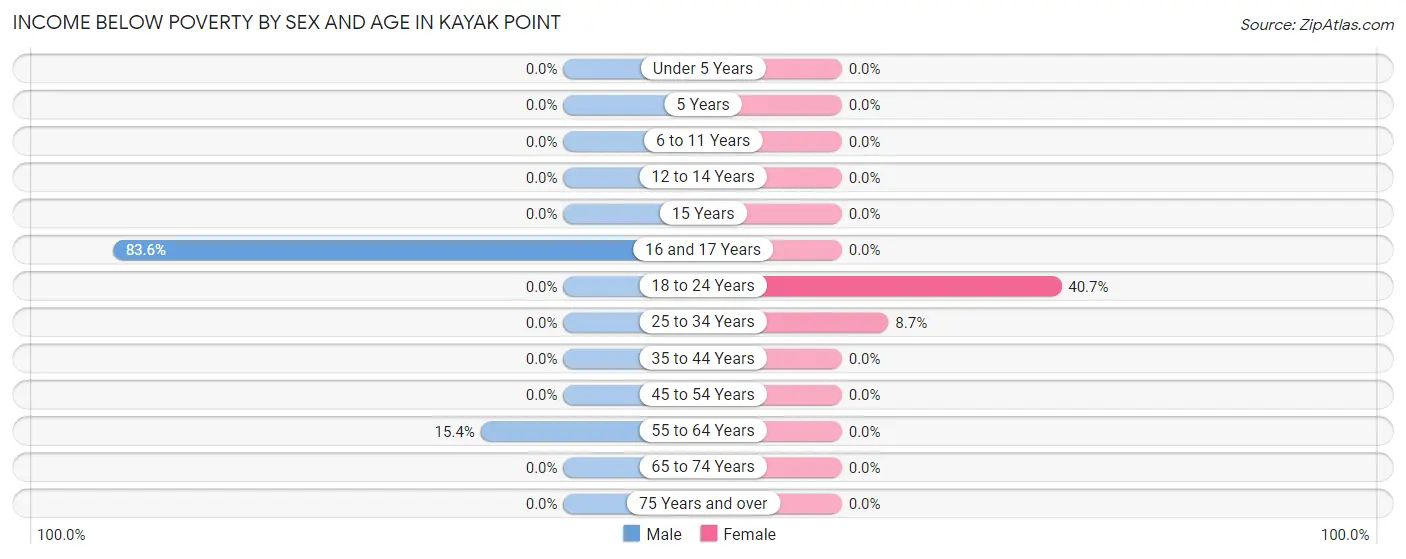
| Age Bracket | Male | Female |
| Under 5 Years | 0 (0.0%) | 0 (0.0%) |
| 5 Years | 0 (0.0%) | 0 (0.0%) |
| 6 to 11 Years | 0 (0.0%) | 0 (0.0%) |
| 12 to 14 Years | 0 (0.0%) | 0 (0.0%) |
| 15 Years | 0 (0.0%) | 0 (0.0%) |
| 16 and 17 Years | 46 (83.6%) | 0 (0.0%) |
| 18 to 24 Years | 0 (0.0%) | 22 (40.7%) |
| 25 to 34 Years | 0 (0.0%) | 9 (8.6%) |
| 35 to 44 Years | 0 (0.0%) | 0 (0.0%) |
| 45 to 54 Years | 0 (0.0%) | 0 (0.0%) |
| 55 to 64 Years | 33 (15.3%) | 0 (0.0%) |
| 65 to 74 Years | 0 (0.0%) | 0 (0.0%) |
| 75 Years and over | 0 (0.0%) | 0 (0.0%) |
| Total | 79 (8.5%) | 31 (4.3%) |
Income Above Poverty by Sex and Age in Kayak Point
According to the poverty statistics in Kayak Point, males aged under 5 years and females aged 5 years are the age groups that are most secure financially, with 100.0% of males and 100.0% of females in these age groups living above the poverty line.
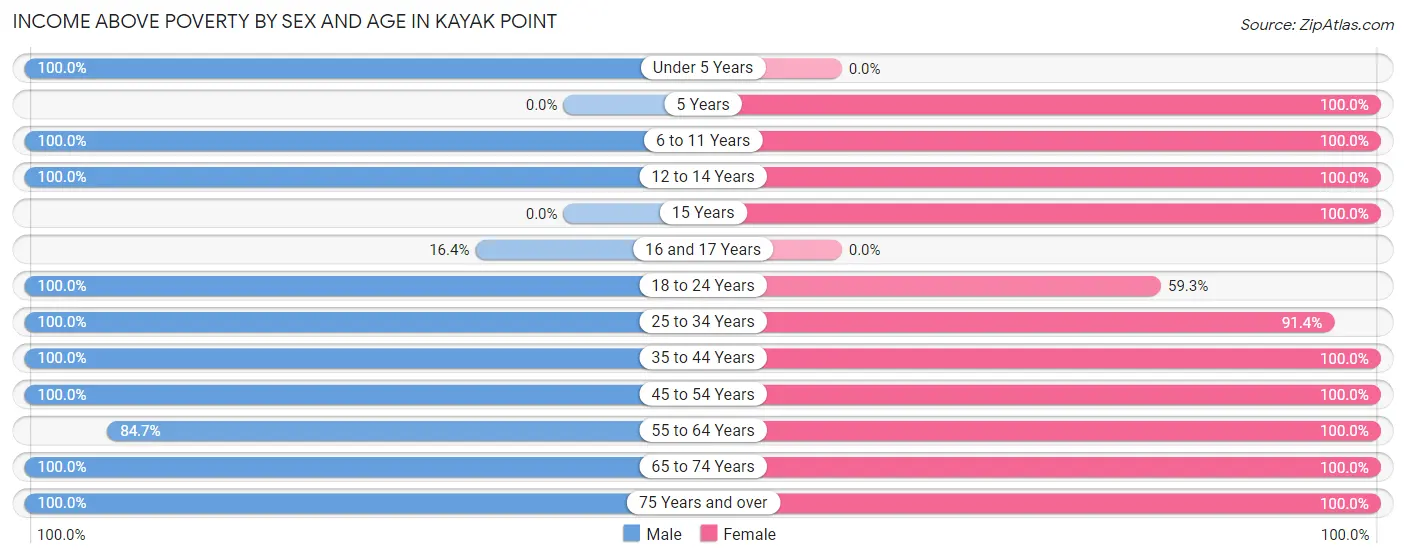
| Age Bracket | Male | Female |
| Under 5 Years | 33 (100.0%) | 0 (0.0%) |
| 5 Years | 0 (0.0%) | 17 (100.0%) |
| 6 to 11 Years | 52 (100.0%) | 33 (100.0%) |
| 12 to 14 Years | 7 (100.0%) | 17 (100.0%) |
| 15 Years | 0 (0.0%) | 6 (100.0%) |
| 16 and 17 Years | 9 (16.4%) | 0 (0.0%) |
| 18 to 24 Years | 70 (100.0%) | 32 (59.3%) |
| 25 to 34 Years | 90 (100.0%) | 95 (91.3%) |
| 35 to 44 Years | 110 (100.0%) | 35 (100.0%) |
| 45 to 54 Years | 72 (100.0%) | 65 (100.0%) |
| 55 to 64 Years | 182 (84.7%) | 165 (100.0%) |
| 65 to 74 Years | 213 (100.0%) | 190 (100.0%) |
| 75 Years and over | 17 (100.0%) | 41 (100.0%) |
| Total | 855 (91.5%) | 696 (95.7%) |
Income Below Poverty Among Married-Couple Families in Kayak Point
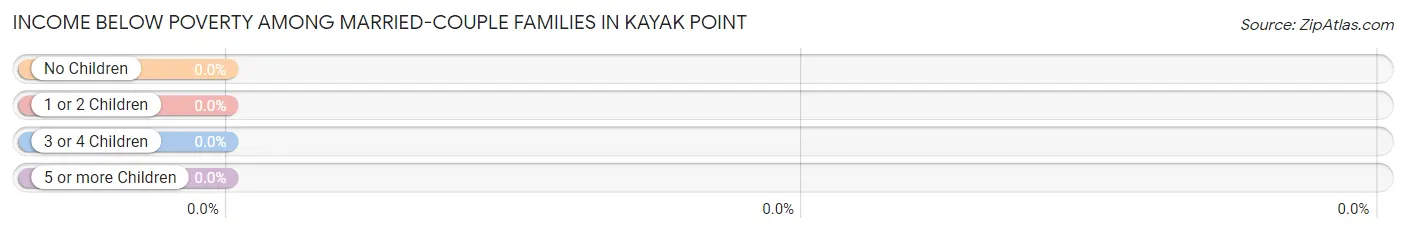
| Children | Above Poverty | Below Poverty |
| No Children | 342 (100.0%) | 0 (0.0%) |
| 1 or 2 Children | 77 (100.0%) | 0 (0.0%) |
| 3 or 4 Children | 11 (100.0%) | 0 (0.0%) |
| 5 or more Children | 0 (0.0%) | 0 (0.0%) |
| Total | 430 (100.0%) | 0 (0.0%) |
Income Below Poverty Among Single-Parent Households in Kayak Point
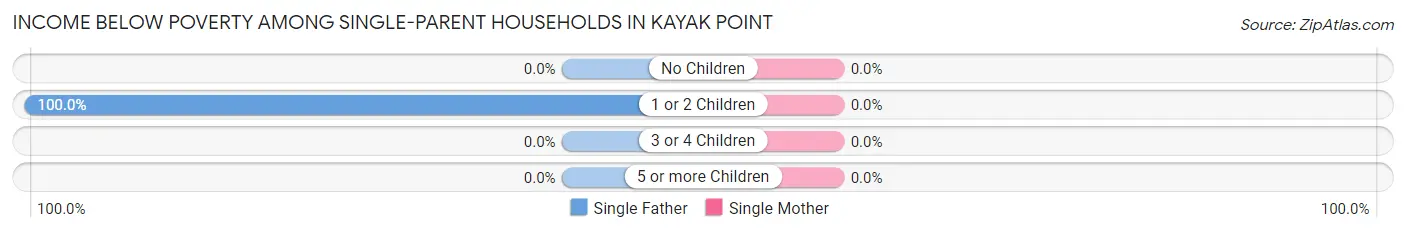
| Children | Single Father | Single Mother |
| No Children | 0 (0.0%) | 0 (0.0%) |
| 1 or 2 Children | 33 (100.0%) | 0 (0.0%) |
| 3 or 4 Children | 0 (0.0%) | 0 (0.0%) |
| 5 or more Children | 0 (0.0%) | 0 (0.0%) |
| Total | 33 (71.7%) | 0 (0.0%) |
Income Below Poverty Among Married-Couple vs Single-Parent Households in Kayak Point
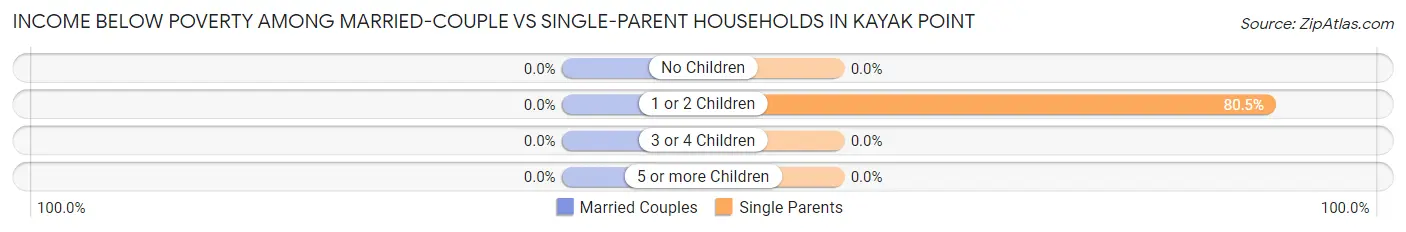
| Children | Married-Couple Families | Single-Parent Households |
| No Children | 0 (0.0%) | 0 (0.0%) |
| 1 or 2 Children | 0 (0.0%) | 33 (80.5%) |
| 3 or 4 Children | 0 (0.0%) | 0 (0.0%) |
| 5 or more Children | 0 (0.0%) | 0 (0.0%) |
| Total | 0 (0.0%) | 33 (47.8%) |
Race in Kayak Point
The most populous races in Kayak Point are White / Caucasian (1,446 | 87.1%), Hispanic or Latino (110 | 6.6%), and Two or more Races (95 | 5.7%).
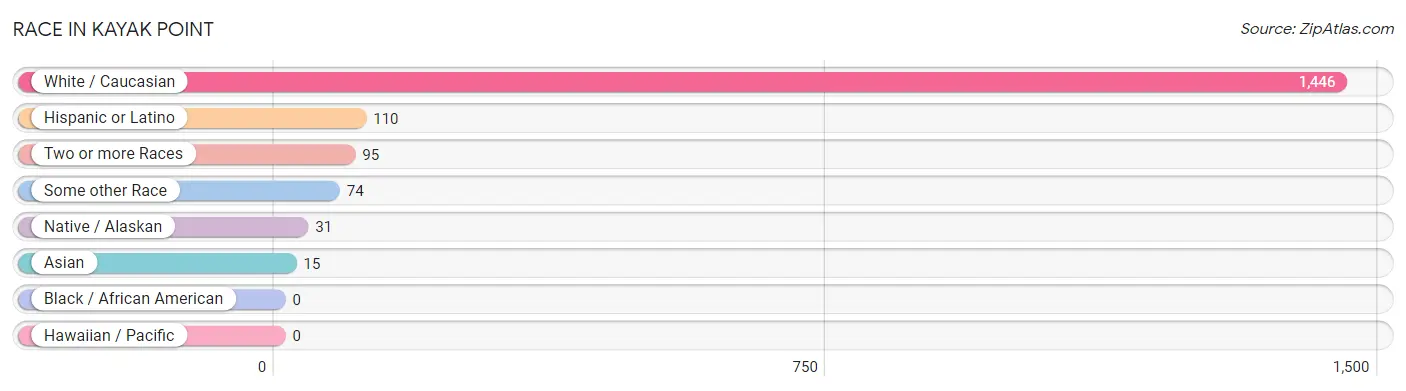
| Race | # Population | % Population |
| Asian | 15 | 0.9% |
| Black / African American | 0 | 0.0% |
| Hawaiian / Pacific | 0 | 0.0% |
| Hispanic or Latino | 110 | 6.6% |
| Native / Alaskan | 31 | 1.9% |
| White / Caucasian | 1,446 | 87.1% |
| Two or more Races | 95 | 5.7% |
| Some other Race | 74 | 4.5% |
| Total | 1,661 | 100.0% |
Ancestry in Kayak Point
The most populous ancestries reported in Kayak Point are German (357 | 21.5%), English (259 | 15.6%), Irish (207 | 12.5%), Portuguese (114 | 6.9%), and French (96 | 5.8%), together accounting for 62.2% of all Kayak Point residents.
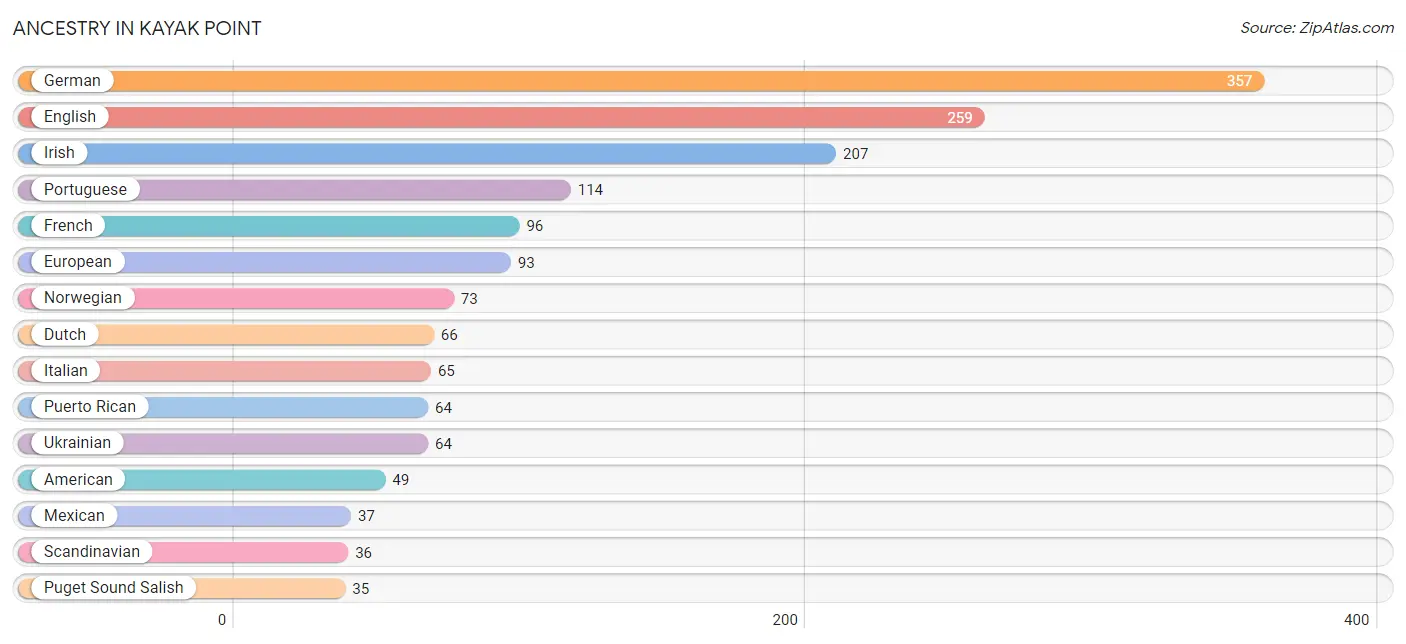
| Ancestry | # Population | % Population |
| American | 49 | 2.9% |
| Austrian | 9 | 0.5% |
| Bhutanese | 21 | 1.3% |
| Canadian | 31 | 1.9% |
| Central American | 9 | 0.5% |
| Central American Indian | 9 | 0.5% |
| Cherokee | 13 | 0.8% |
| Danish | 6 | 0.4% |
| Dutch | 66 | 4.0% |
| English | 259 | 15.6% |
| European | 93 | 5.6% |
| Finnish | 17 | 1.0% |
| French | 96 | 5.8% |
| German | 357 | 21.5% |
| Greek | 8 | 0.5% |
| Irish | 207 | 12.5% |
| Italian | 65 | 3.9% |
| Maltese | 9 | 0.5% |
| Mexican | 37 | 2.2% |
| Norwegian | 73 | 4.4% |
| Polish | 12 | 0.7% |
| Portuguese | 114 | 6.9% |
| Puerto Rican | 64 | 3.8% |
| Puget Sound Salish | 35 | 2.1% |
| Romanian | 32 | 1.9% |
| Russian | 24 | 1.4% |
| Salvadoran | 9 | 0.5% |
| Scandinavian | 36 | 2.2% |
| Scotch-Irish | 26 | 1.6% |
| Scottish | 20 | 1.2% |
| Slovak | 8 | 0.5% |
| Swedish | 5 | 0.3% |
| Ukrainian | 64 | 3.8% | View All 33 Rows |
Immigrants in Kayak Point
The most numerous immigrant groups reported in Kayak Point came from Europe (30 | 1.8%), Canada (24 | 1.4%), Asia (22 | 1.3%), Eastern Europe (21 | 1.3%), and Eastern Asia (15 | 0.9%), together accounting for 6.7% of all Kayak Point residents.
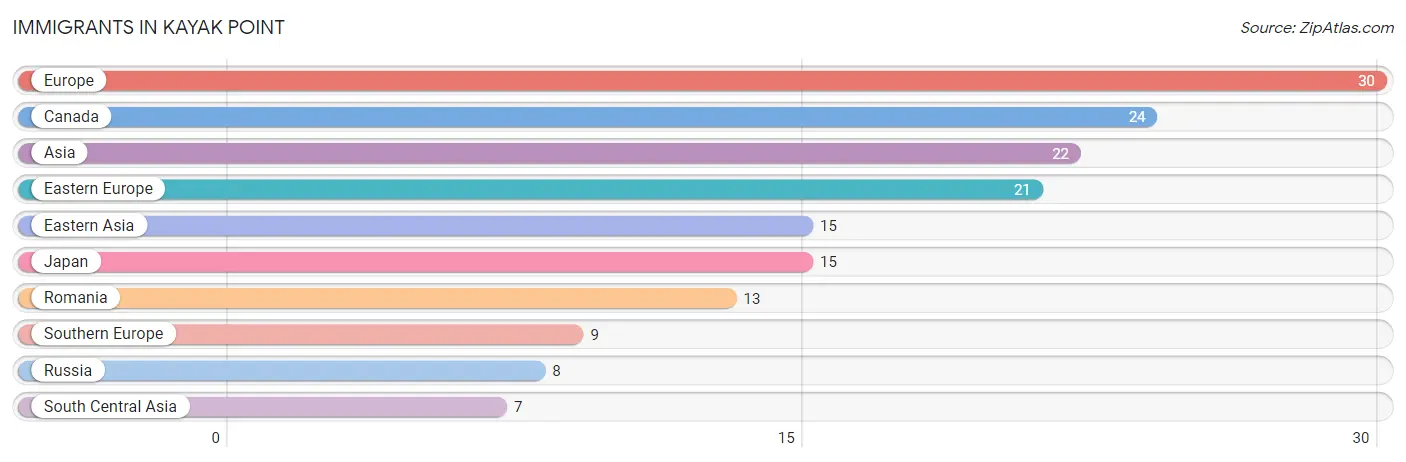
| Immigration Origin | # Population | % Population |
| Asia | 22 | 1.3% |
| Canada | 24 | 1.4% |
| Eastern Asia | 15 | 0.9% |
| Eastern Europe | 21 | 1.3% |
| Europe | 30 | 1.8% |
| Japan | 15 | 0.9% |
| Romania | 13 | 0.8% |
| Russia | 8 | 0.5% |
| South Central Asia | 7 | 0.4% |
| Southern Europe | 9 | 0.5% | View All 10 Rows |
Sex and Age in Kayak Point
Sex and Age in Kayak Point
The most populous age groups in Kayak Point are 65 to 69 Years (147 | 15.7%) for men and 65 to 69 Years (133 | 18.3%) for women.
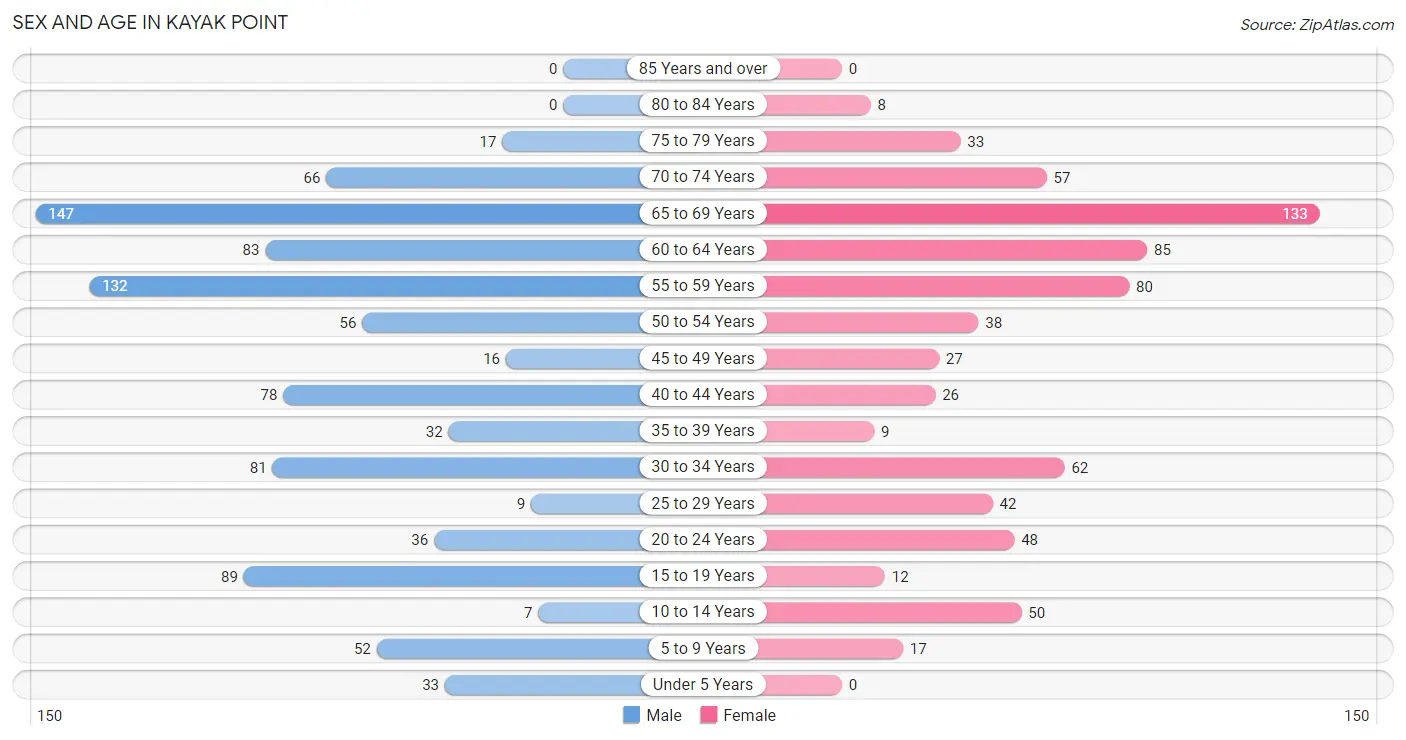
| Age Bracket | Male | Female |
| Under 5 Years | 33 (3.5%) | 0 (0.0%) |
| 5 to 9 Years | 52 (5.6%) | 17 (2.3%) |
| 10 to 14 Years | 7 (0.7%) | 50 (6.9%) |
| 15 to 19 Years | 89 (9.5%) | 12 (1.7%) |
| 20 to 24 Years | 36 (3.8%) | 48 (6.6%) |
| 25 to 29 Years | 9 (1.0%) | 42 (5.8%) |
| 30 to 34 Years | 81 (8.7%) | 62 (8.5%) |
| 35 to 39 Years | 32 (3.4%) | 9 (1.2%) |
| 40 to 44 Years | 78 (8.4%) | 26 (3.6%) |
| 45 to 49 Years | 16 (1.7%) | 27 (3.7%) |
| 50 to 54 Years | 56 (6.0%) | 38 (5.2%) |
| 55 to 59 Years | 132 (14.1%) | 80 (11.0%) |
| 60 to 64 Years | 83 (8.9%) | 85 (11.7%) |
| 65 to 69 Years | 147 (15.7%) | 133 (18.3%) |
| 70 to 74 Years | 66 (7.1%) | 57 (7.8%) |
| 75 to 79 Years | 17 (1.8%) | 33 (4.5%) |
| 80 to 84 Years | 0 (0.0%) | 8 (1.1%) |
| 85 Years and over | 0 (0.0%) | 0 (0.0%) |
| Total | 934 (100.0%) | 727 (100.0%) |
Families and Households in Kayak Point
Median Family Size in Kayak Point
The median family size in Kayak Point is 2.87 persons per family, with married-couple families (430 | 86.2%) accounting for the largest median family size of 2.97 persons per family. On the other hand, single female/mother families (23 | 4.6%) represent the smallest median family size with 2.09 persons per family.
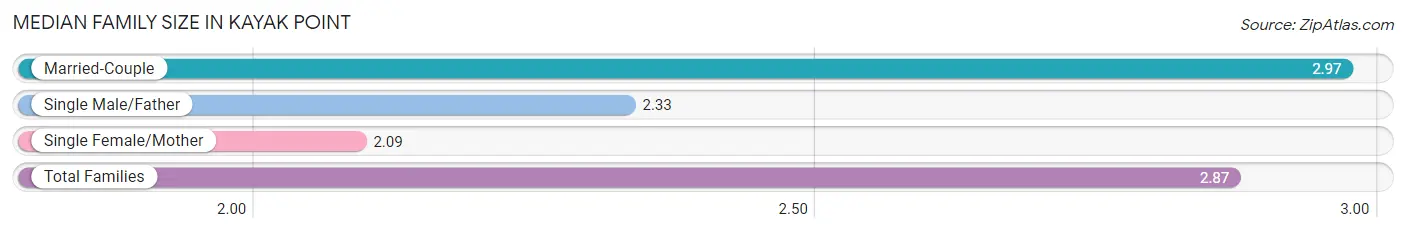
| Family Type | # Families | Family Size |
| Married-Couple | 430 (86.2%) | 2.97 |
| Single Male/Father | 46 (9.2%) | 2.33 |
| Single Female/Mother | 23 (4.6%) | 2.09 |
| Total Families | 499 (100.0%) | 2.87 |
Median Household Size in Kayak Point
The median household size in Kayak Point is 2.84 persons per household, with single male/father households (46 | 7.9%) accounting for the largest median household size of 3.09 persons per household. non-family households (86 | 14.7%) represent the smallest median household size with 1.79 persons per household.
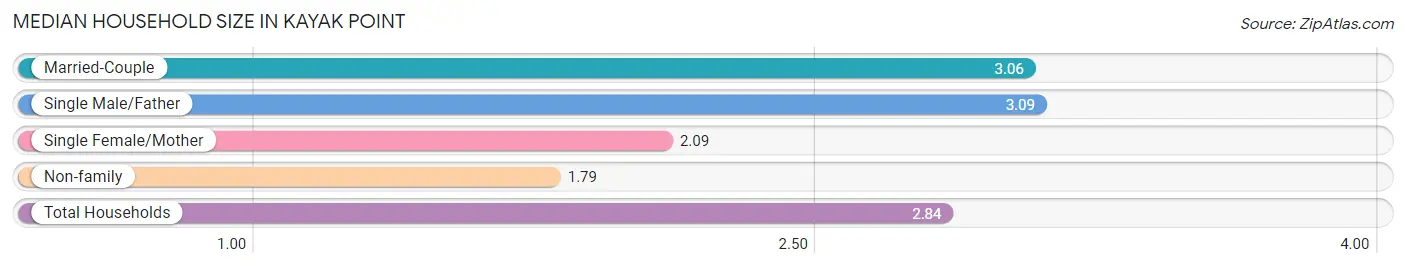
| Household Type | # Households | Household Size |
| Married-Couple | 430 (73.5%) | 3.06 |
| Single Male/Father | 46 (7.9%) | 3.09 |
| Single Female/Mother | 23 (3.9%) | 2.09 |
| Non-family | 86 (14.7%) | 1.79 |
| Total Households | 585 (100.0%) | 2.84 |
Household Size by Marriage Status in Kayak Point
Out of a total of 585 households in Kayak Point, 499 (85.3%) are family households, while 86 (14.7%) are nonfamily households. The most numerous type of family households are 2-person households, comprising 265, and the most common type of nonfamily households are 2-person households, comprising 56.
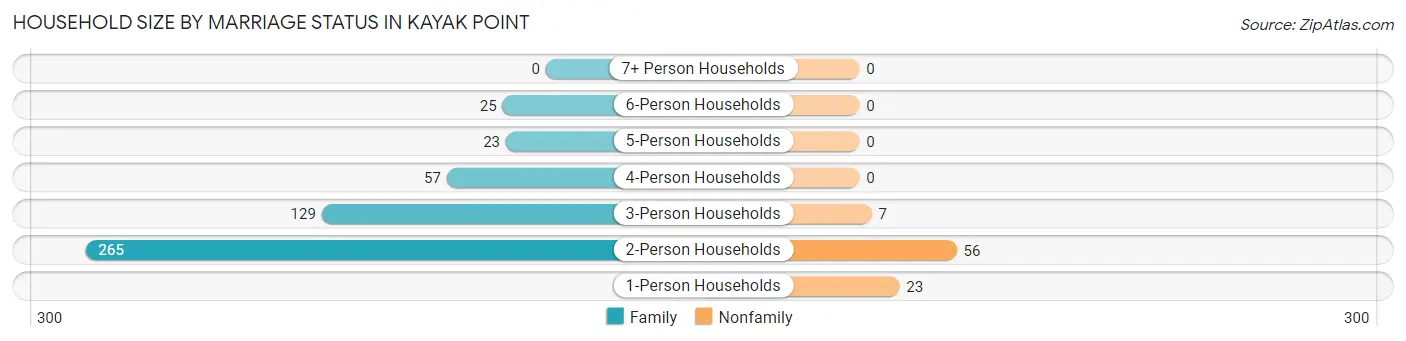
| Household Size | Family Households | Nonfamily Households |
| 1-Person Households | - | 23 (3.9%) |
| 2-Person Households | 265 (45.3%) | 56 (9.6%) |
| 3-Person Households | 129 (22.1%) | 7 (1.2%) |
| 4-Person Households | 57 (9.7%) | 0 (0.0%) |
| 5-Person Households | 23 (3.9%) | 0 (0.0%) |
| 6-Person Households | 25 (4.3%) | 0 (0.0%) |
| 7+ Person Households | 0 (0.0%) | 0 (0.0%) |
| Total | 499 (85.3%) | 86 (14.7%) |
Female Fertility in Kayak Point
Fertility by Age in Kayak Point
Average fertility rate in Kayak Point is 37.0 births per 1,000 women. Women in the age bracket of 20 to 34 years have the highest fertility rate with 59.0 births per 1,000 women. Women in the age bracket of 20 to 34 years acount for 100.0% of all women with births.
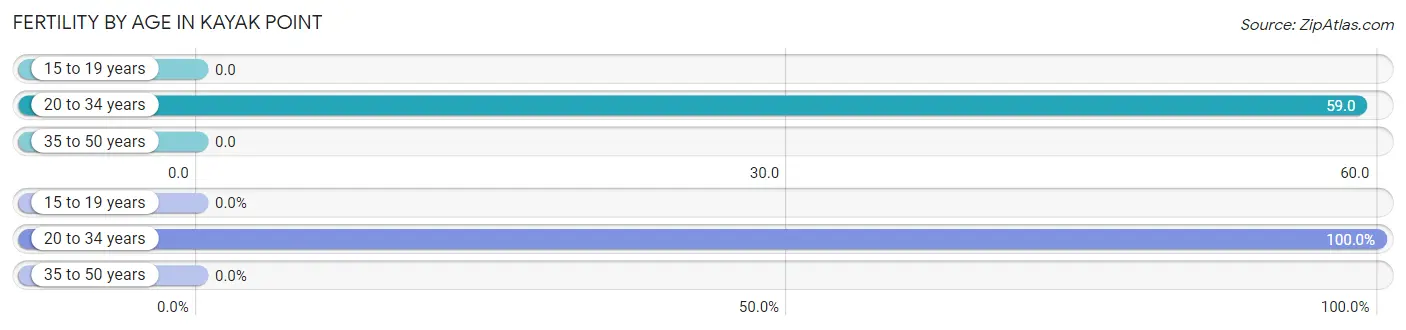
| Age Bracket | Women with Births | Births / 1,000 Women |
| 15 to 19 years | 0 (0.0%) | 0.0 |
| 20 to 34 years | 9 (100.0%) | 59.0 |
| 35 to 50 years | 0 (0.0%) | 0.0 |
| Total | 9 (100.0%) | 37.0 |
Fertility by Age by Marriage Status in Kayak Point
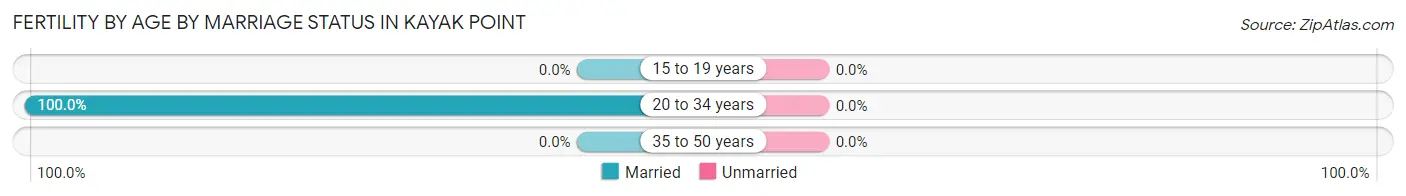
| Age Bracket | Married | Unmarried |
| 15 to 19 years | 0 (0.0%) | 0 (0.0%) |
| 20 to 34 years | 9 (100.0%) | 0 (0.0%) |
| 35 to 50 years | 0 (0.0%) | 0 (0.0%) |
| Total | 9 (100.0%) | 0 (0.0%) |
Fertility by Education in Kayak Point
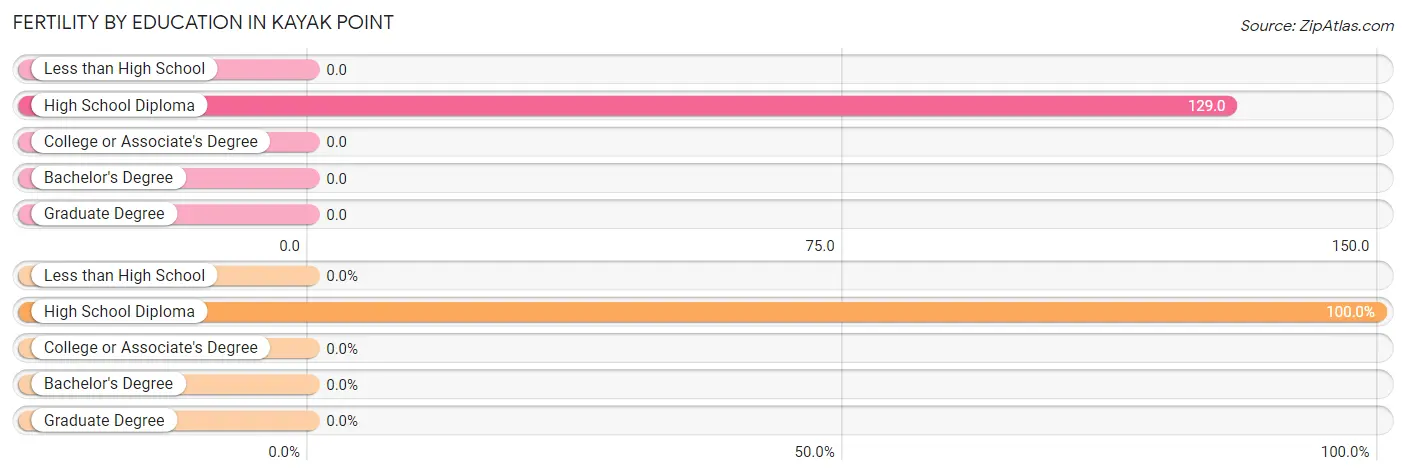
| Educational Attainment | Women with Births | Births / 1,000 Women |
| Less than High School | 0 (0.0%) | 0.0 |
| High School Diploma | 9 (100.0%) | 129.0 |
| College or Associate's Degree | 0 (0.0%) | 0.0 |
| Bachelor's Degree | 0 (0.0%) | 0.0 |
| Graduate Degree | 0 (0.0%) | 0.0 |
| Total | 9 (100.0%) | 37.0 |
Fertility by Education by Marriage Status in Kayak Point
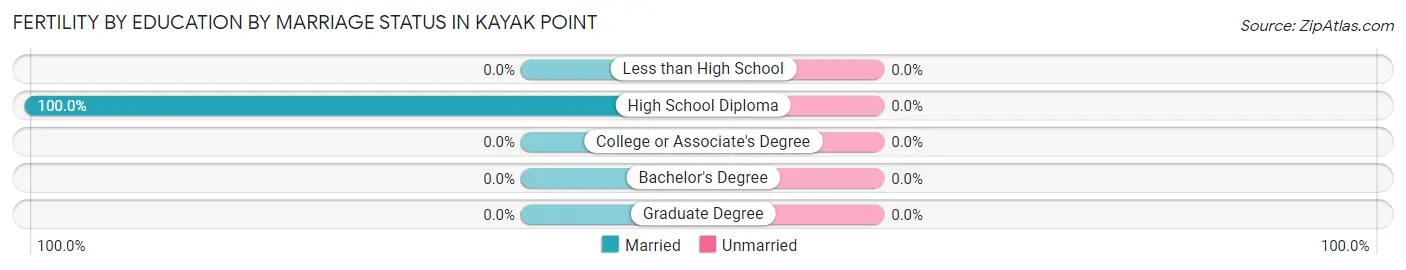
| Educational Attainment | Married | Unmarried |
| Less than High School | 0 (0.0%) | 0 (0.0%) |
| High School Diploma | 9 (100.0%) | 0 (0.0%) |
| College or Associate's Degree | 0 (0.0%) | 0 (0.0%) |
| Bachelor's Degree | 0 (0.0%) | 0 (0.0%) |
| Graduate Degree | 0 (0.0%) | 0 (0.0%) |
| Total | 9 (100.0%) | 0 (0.0%) |
Employment Characteristics in Kayak Point
Employment by Class of Employer in Kayak Point
Among the 805 employed individuals in Kayak Point, private company employees (620 | 77.0%), self-employed (not incorporated) (50 | 6.2%), and local government employees (42 | 5.2%) make up the most common classes of employment.
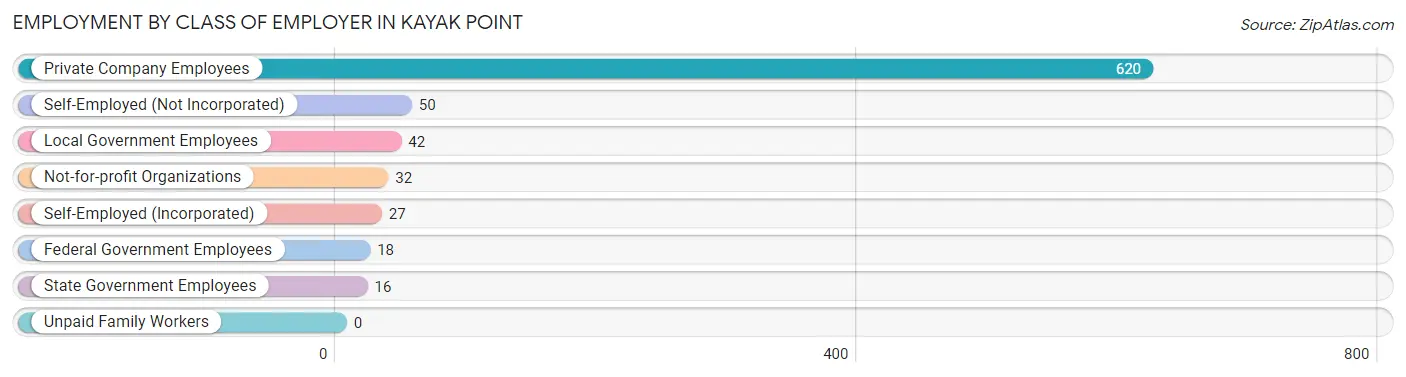
| Employer Class | # Employees | % Employees |
| Private Company Employees | 620 | 77.0% |
| Self-Employed (Incorporated) | 27 | 3.4% |
| Self-Employed (Not Incorporated) | 50 | 6.2% |
| Not-for-profit Organizations | 32 | 4.0% |
| Local Government Employees | 42 | 5.2% |
| State Government Employees | 16 | 2.0% |
| Federal Government Employees | 18 | 2.2% |
| Unpaid Family Workers | 0 | 0.0% |
| Total | 805 | 100.0% |
Employment Status by Age in Kayak Point
According to the labor force statistics for Kayak Point, out of the total population over 16 years of age (1,496), 59.2% or 886 individuals are in the labor force, with 4.6% or 41 of them unemployed. The age group with the highest labor force participation rate is 20 to 24 years, with 100.0% or 84 individuals in the labor force. Within the labor force, the 65 to 74 years age range has the highest percentage of unemployed individuals, with 31.4% or 22 of them being unemployed.
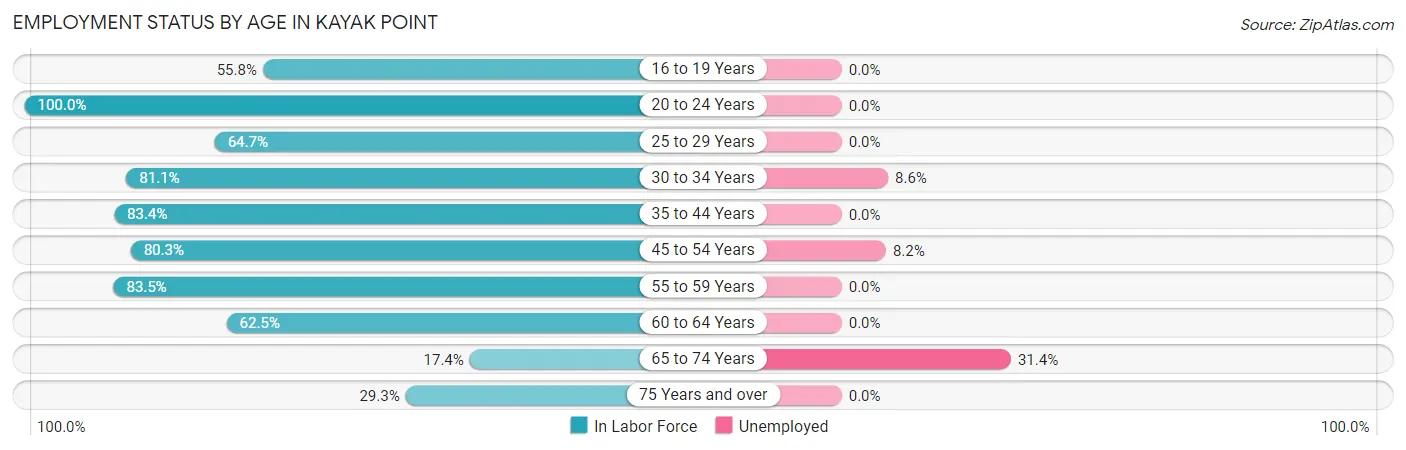
| Age Bracket | In Labor Force | Unemployed |
| 16 to 19 Years | 53 (55.8%) | 0 (0.0%) |
| 20 to 24 Years | 84 (100.0%) | 0 (0.0%) |
| 25 to 29 Years | 33 (64.7%) | 0 (0.0%) |
| 30 to 34 Years | 116 (81.1%) | 10 (8.6%) |
| 35 to 44 Years | 121 (83.4%) | 0 (0.0%) |
| 45 to 54 Years | 110 (80.3%) | 9 (8.2%) |
| 55 to 59 Years | 177 (83.5%) | 0 (0.0%) |
| 60 to 64 Years | 105 (62.5%) | 0 (0.0%) |
| 65 to 74 Years | 70 (17.4%) | 22 (31.4%) |
| 75 Years and over | 17 (29.3%) | 0 (0.0%) |
| Total | 886 (59.2%) | 41 (4.6%) |
Employment Status by Educational Attainment in Kayak Point
According to labor force statistics for Kayak Point, 77.3% of individuals (662) out of the total population between 25 and 64 years of age (856) are in the labor force, with 2.9% or 19 of them being unemployed. The group with the highest labor force participation rate are those with the educational attainment of high school diploma, with 88.7% or 212 individuals in the labor force. Within the labor force, individuals with college / associate degree education have the highest percentage of unemployment, with 7.0% or 19 of them being unemployed.
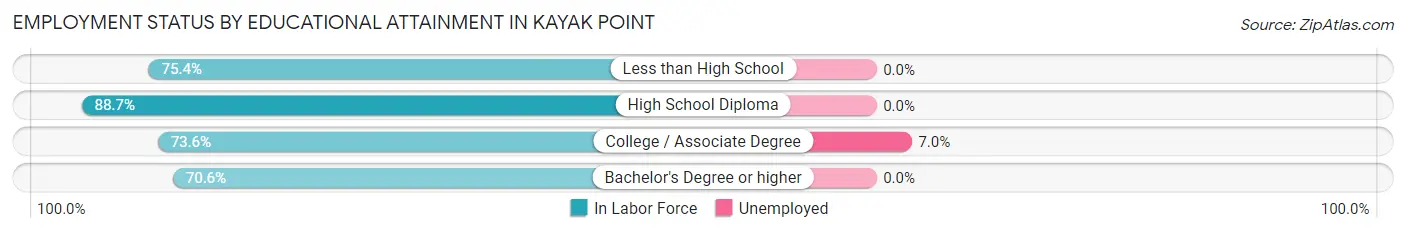
| Educational Attainment | In Labor Force | Unemployed |
| Less than High School | 52 (75.4%) | 0 (0.0%) |
| High School Diploma | 212 (88.7%) | 0 (0.0%) |
| College / Associate Degree | 271 (73.6%) | 26 (7.0%) |
| Bachelor's Degree or higher | 127 (70.6%) | 0 (0.0%) |
| Total | 662 (77.3%) | 25 (2.9%) |
Employment Occupations by Sex in Kayak Point
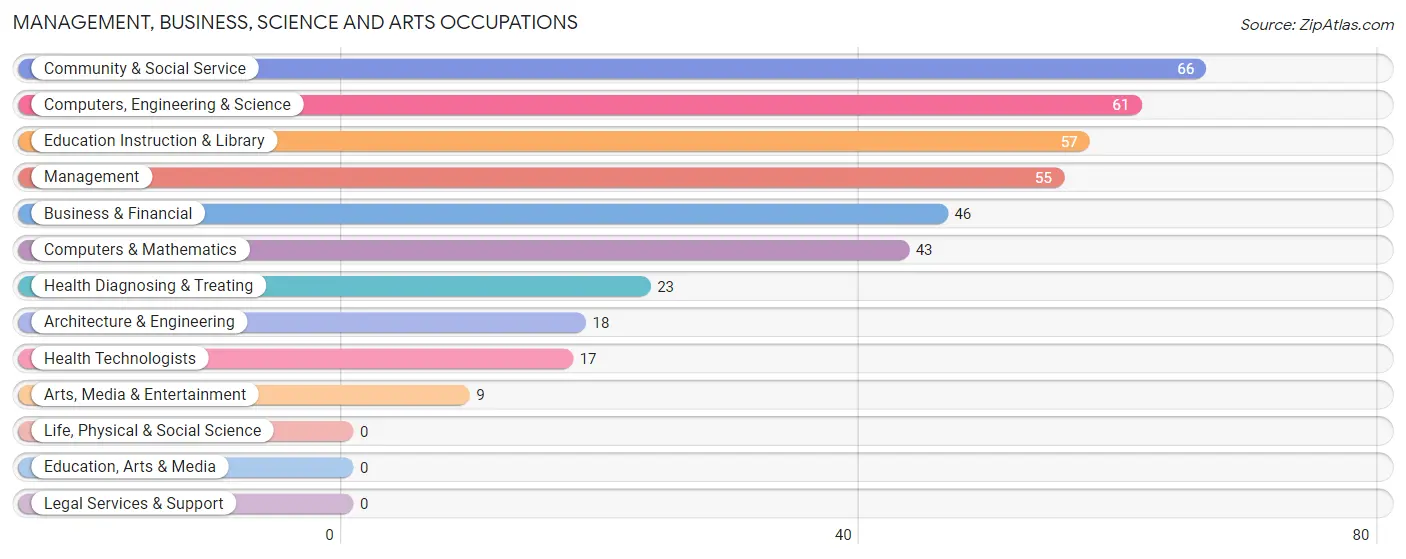
Management, Business, Science and Arts Occupations
The most common Management, Business, Science and Arts occupations in Kayak Point are Community & Social Service (66 | 7.8%), Computers, Engineering & Science (61 | 7.2%), Education Instruction & Library (57 | 6.8%), Management (55 | 6.5%), and Business & Financial (46 | 5.4%).
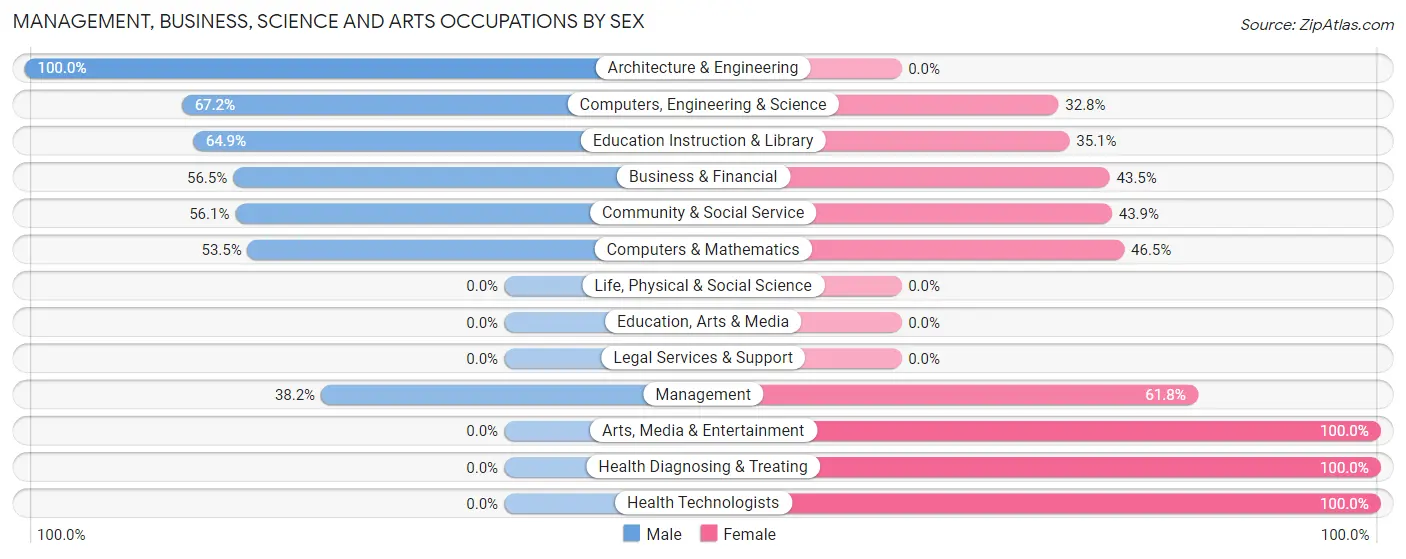
Management, Business, Science and Arts Occupations by Sex
Within the Management, Business, Science and Arts occupations in Kayak Point, the most male-oriented occupations are Architecture & Engineering (100.0%), Computers, Engineering & Science (67.2%), and Education Instruction & Library (64.9%), while the most female-oriented occupations are Arts, Media & Entertainment (100.0%), Health Diagnosing & Treating (100.0%), and Health Technologists (100.0%).
| Occupation | Male | Female |
| Management | 21 (38.2%) | 34 (61.8%) |
| Business & Financial | 26 (56.5%) | 20 (43.5%) |
| Computers, Engineering & Science | 41 (67.2%) | 20 (32.8%) |
| Computers & Mathematics | 23 (53.5%) | 20 (46.5%) |
| Architecture & Engineering | 18 (100.0%) | 0 (0.0%) |
| Life, Physical & Social Science | 0 (0.0%) | 0 (0.0%) |
| Community & Social Service | 37 (56.1%) | 29 (43.9%) |
| Education, Arts & Media | 0 (0.0%) | 0 (0.0%) |
| Legal Services & Support | 0 (0.0%) | 0 (0.0%) |
| Education Instruction & Library | 37 (64.9%) | 20 (35.1%) |
| Arts, Media & Entertainment | 0 (0.0%) | 9 (100.0%) |
| Health Diagnosing & Treating | 0 (0.0%) | 23 (100.0%) |
| Health Technologists | 0 (0.0%) | 17 (100.0%) |
| Total (Category) | 125 (49.8%) | 126 (50.2%) |
| Total (Overall) | 505 (59.8%) | 340 (40.2%) |
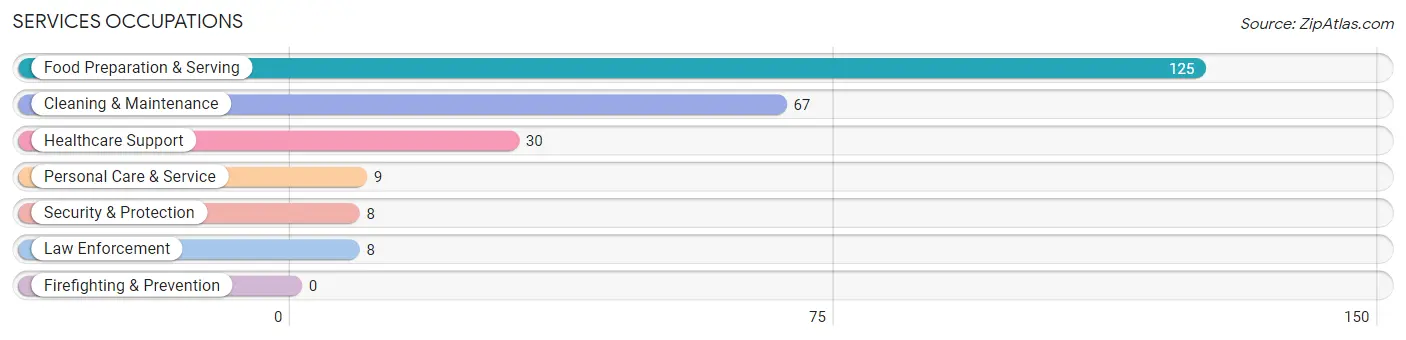
Services Occupations
The most common Services occupations in Kayak Point are Food Preparation & Serving (125 | 14.8%), Cleaning & Maintenance (67 | 7.9%), Healthcare Support (30 | 3.5%), Personal Care & Service (9 | 1.1%), and Security & Protection (8 | 0.9%).
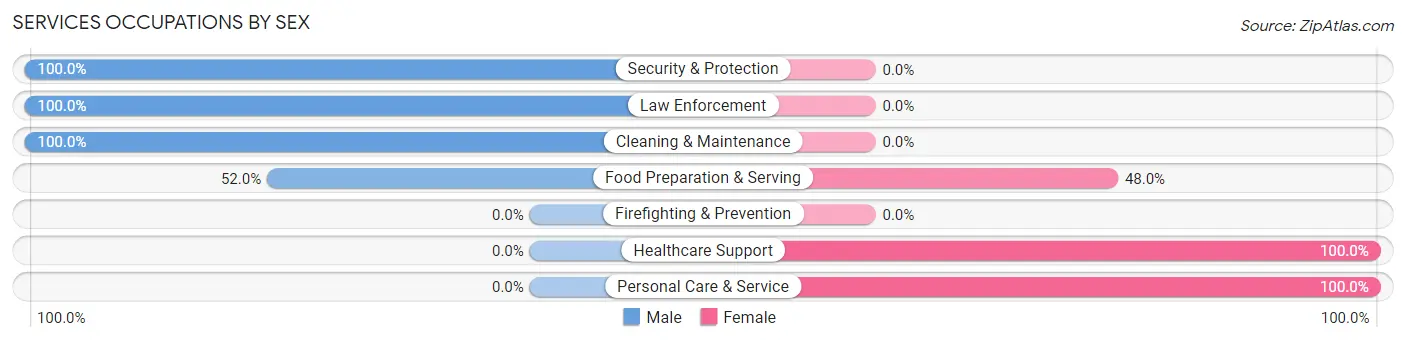
Services Occupations by Sex
Within the Services occupations in Kayak Point, the most male-oriented occupations are Security & Protection (100.0%), Law Enforcement (100.0%), and Cleaning & Maintenance (100.0%), while the most female-oriented occupations are Healthcare Support (100.0%), Personal Care & Service (100.0%), and Food Preparation & Serving (48.0%).
| Occupation | Male | Female |
| Healthcare Support | 0 (0.0%) | 30 (100.0%) |
| Security & Protection | 8 (100.0%) | 0 (0.0%) |
| Firefighting & Prevention | 0 (0.0%) | 0 (0.0%) |
| Law Enforcement | 8 (100.0%) | 0 (0.0%) |
| Food Preparation & Serving | 65 (52.0%) | 60 (48.0%) |
| Cleaning & Maintenance | 67 (100.0%) | 0 (0.0%) |
| Personal Care & Service | 0 (0.0%) | 9 (100.0%) |
| Total (Category) | 140 (58.6%) | 99 (41.4%) |
| Total (Overall) | 505 (59.8%) | 340 (40.2%) |
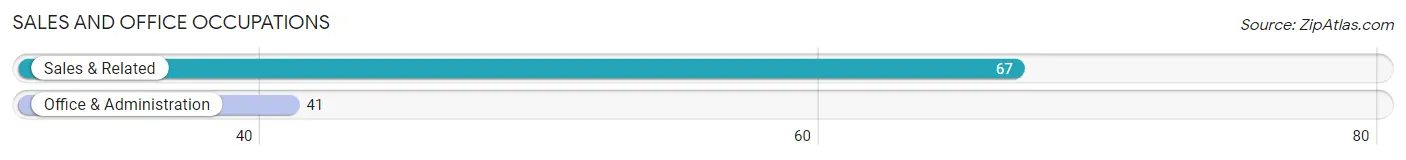
Sales and Office Occupations
The most common Sales and Office occupations in Kayak Point are Sales & Related (67 | 7.9%), and Office & Administration (41 | 4.9%).
Sales and Office Occupations by Sex
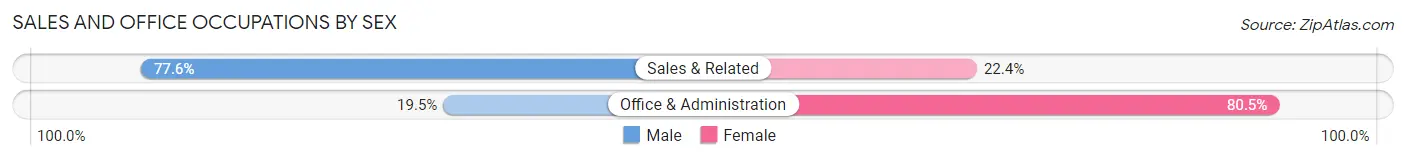
| Occupation | Male | Female |
| Sales & Related | 52 (77.6%) | 15 (22.4%) |
| Office & Administration | 8 (19.5%) | 33 (80.5%) |
| Total (Category) | 60 (55.6%) | 48 (44.4%) |
| Total (Overall) | 505 (59.8%) | 340 (40.2%) |
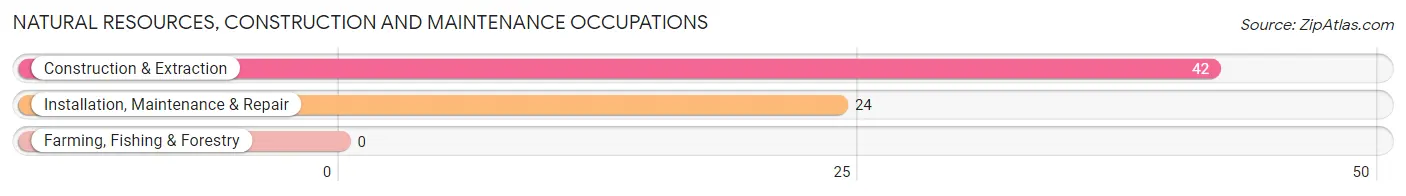
Natural Resources, Construction and Maintenance Occupations
The most common Natural Resources, Construction and Maintenance occupations in Kayak Point are Construction & Extraction (42 | 5.0%), and Installation, Maintenance & Repair (24 | 2.8%).
Natural Resources, Construction and Maintenance Occupations by Sex
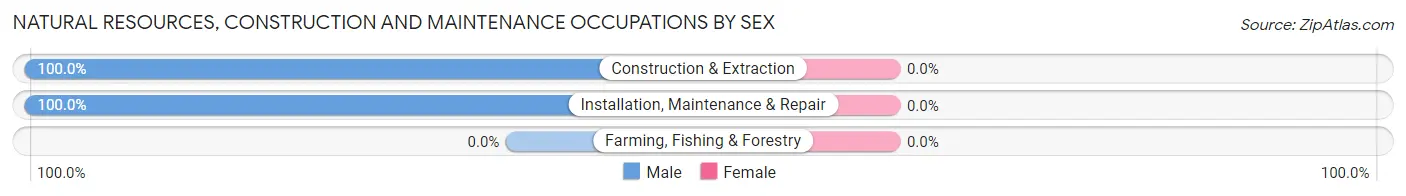
| Occupation | Male | Female |
| Farming, Fishing & Forestry | 0 (0.0%) | 0 (0.0%) |
| Construction & Extraction | 42 (100.0%) | 0 (0.0%) |
| Installation, Maintenance & Repair | 24 (100.0%) | 0 (0.0%) |
| Total (Category) | 66 (100.0%) | 0 (0.0%) |
| Total (Overall) | 505 (59.8%) | 340 (40.2%) |
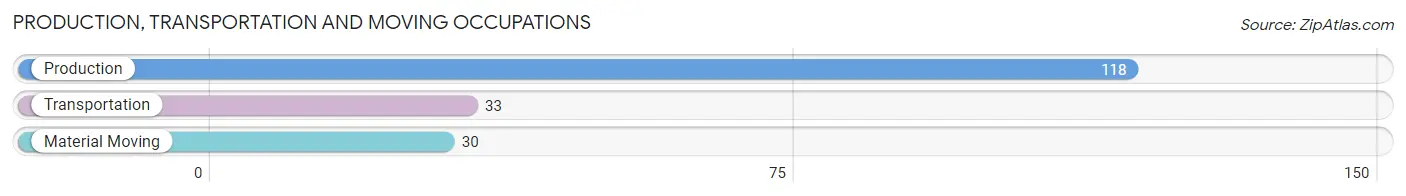
Production, Transportation and Moving Occupations
The most common Production, Transportation and Moving occupations in Kayak Point are Production (118 | 14.0%), Transportation (33 | 3.9%), and Material Moving (30 | 3.5%).
Production, Transportation and Moving Occupations by Sex
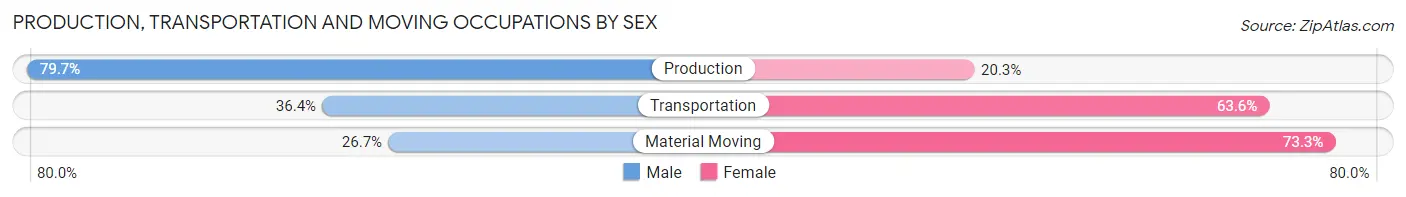
| Occupation | Male | Female |
| Production | 94 (79.7%) | 24 (20.3%) |
| Transportation | 12 (36.4%) | 21 (63.6%) |
| Material Moving | 8 (26.7%) | 22 (73.3%) |
| Total (Category) | 114 (63.0%) | 67 (37.0%) |
| Total (Overall) | 505 (59.8%) | 340 (40.2%) |
Employment Industries by Sex in Kayak Point
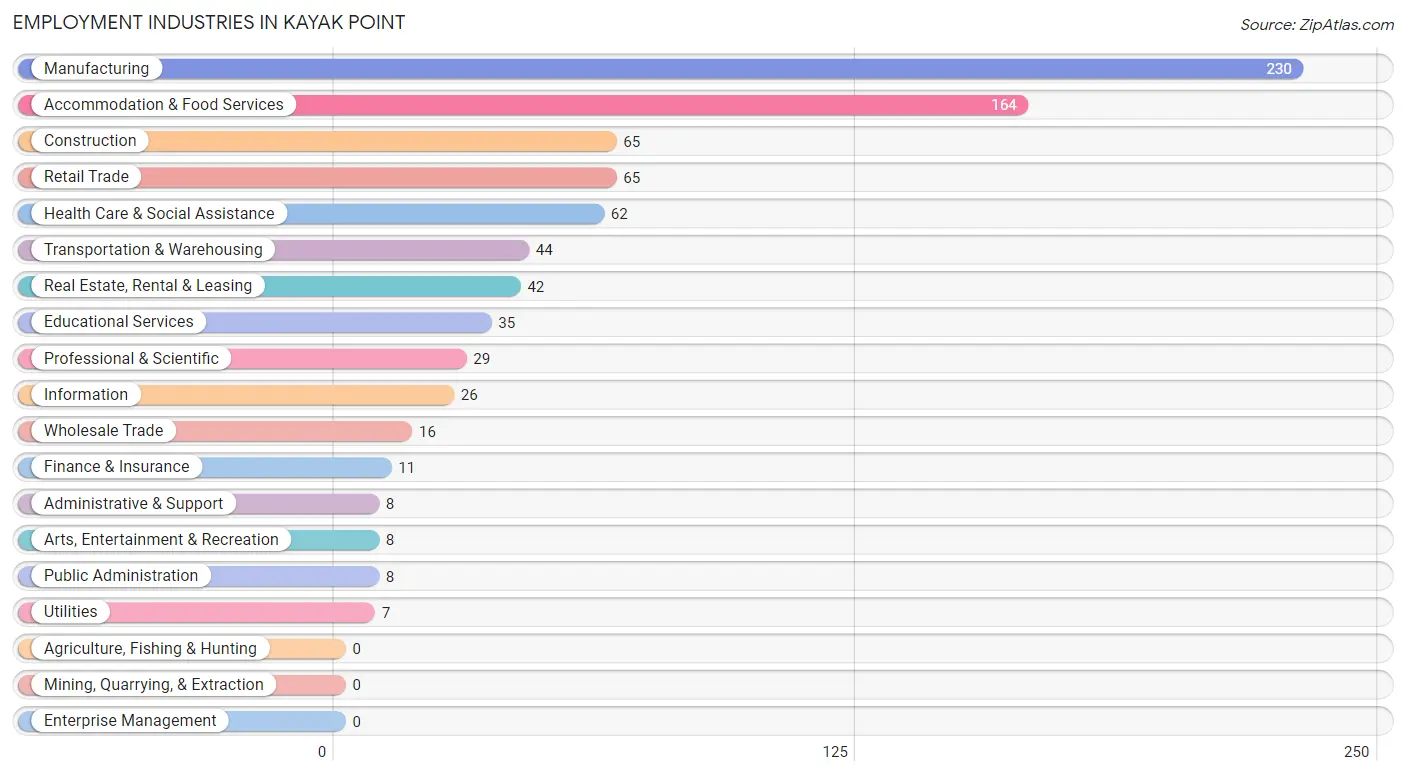
Employment Industries in Kayak Point
The major employment industries in Kayak Point include Manufacturing (230 | 27.2%), Accommodation & Food Services (164 | 19.4%), Construction (65 | 7.7%), Retail Trade (65 | 7.7%), and Health Care & Social Assistance (62 | 7.3%).
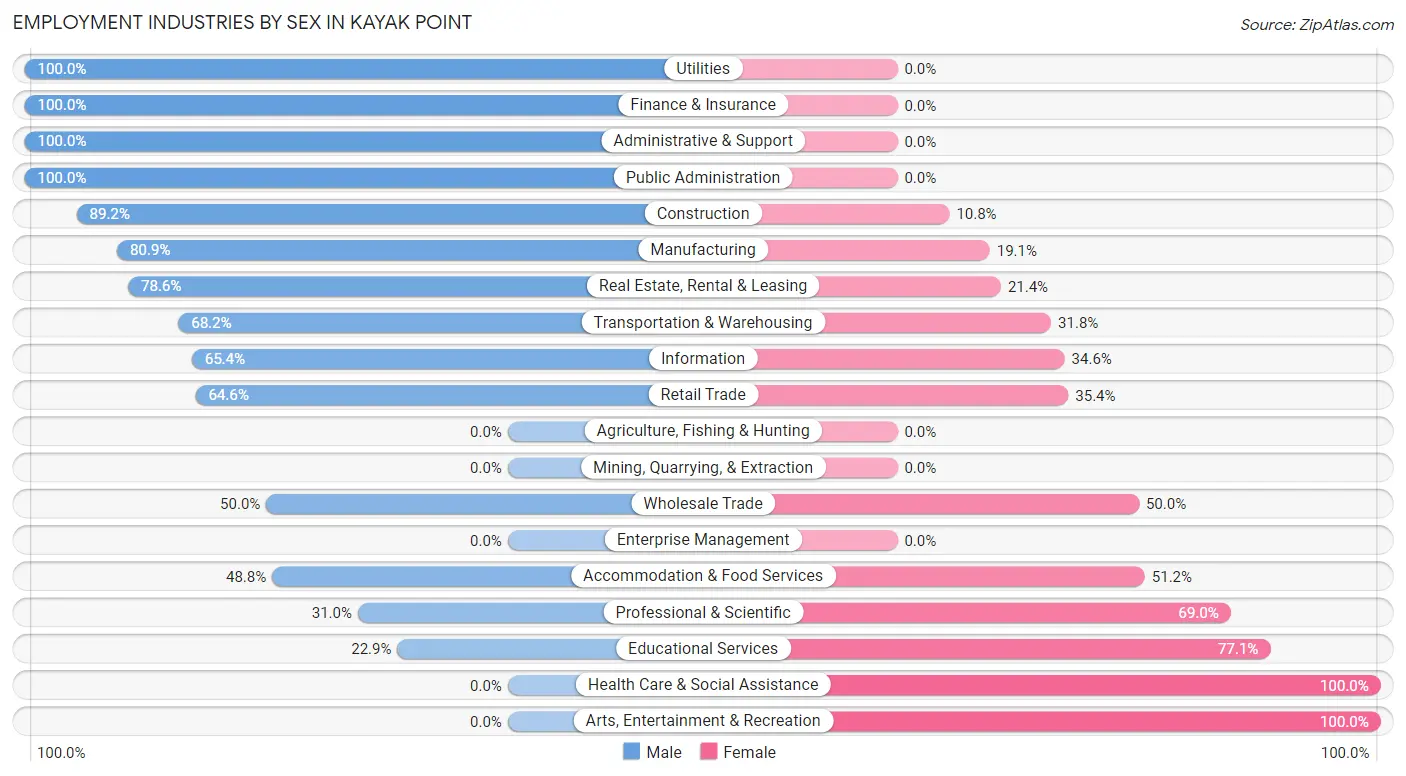
Employment Industries by Sex in Kayak Point
The Kayak Point industries that see more men than women are Utilities (100.0%), Finance & Insurance (100.0%), and Administrative & Support (100.0%), whereas the industries that tend to have a higher number of women are Health Care & Social Assistance (100.0%), Arts, Entertainment & Recreation (100.0%), and Educational Services (77.1%).
| Industry | Male | Female |
| Agriculture, Fishing & Hunting | 0 (0.0%) | 0 (0.0%) |
| Mining, Quarrying, & Extraction | 0 (0.0%) | 0 (0.0%) |
| Construction | 58 (89.2%) | 7 (10.8%) |
| Manufacturing | 186 (80.9%) | 44 (19.1%) |
| Wholesale Trade | 8 (50.0%) | 8 (50.0%) |
| Retail Trade | 42 (64.6%) | 23 (35.4%) |
| Transportation & Warehousing | 30 (68.2%) | 14 (31.8%) |
| Utilities | 7 (100.0%) | 0 (0.0%) |
| Information | 17 (65.4%) | 9 (34.6%) |
| Finance & Insurance | 11 (100.0%) | 0 (0.0%) |
| Real Estate, Rental & Leasing | 33 (78.6%) | 9 (21.4%) |
| Professional & Scientific | 9 (31.0%) | 20 (69.0%) |
| Enterprise Management | 0 (0.0%) | 0 (0.0%) |
| Administrative & Support | 8 (100.0%) | 0 (0.0%) |
| Educational Services | 8 (22.9%) | 27 (77.1%) |
| Health Care & Social Assistance | 0 (0.0%) | 62 (100.0%) |
| Arts, Entertainment & Recreation | 0 (0.0%) | 8 (100.0%) |
| Accommodation & Food Services | 80 (48.8%) | 84 (51.2%) |
| Public Administration | 8 (100.0%) | 0 (0.0%) |
| Total | 505 (59.8%) | 340 (40.2%) |
Education in Kayak Point
School Enrollment in Kayak Point
The most common levels of schooling among the 345 students in Kayak Point are high school (142 | 41.2%), college / undergraduate (76 | 22.0%), and elementary school (46 | 13.3%).
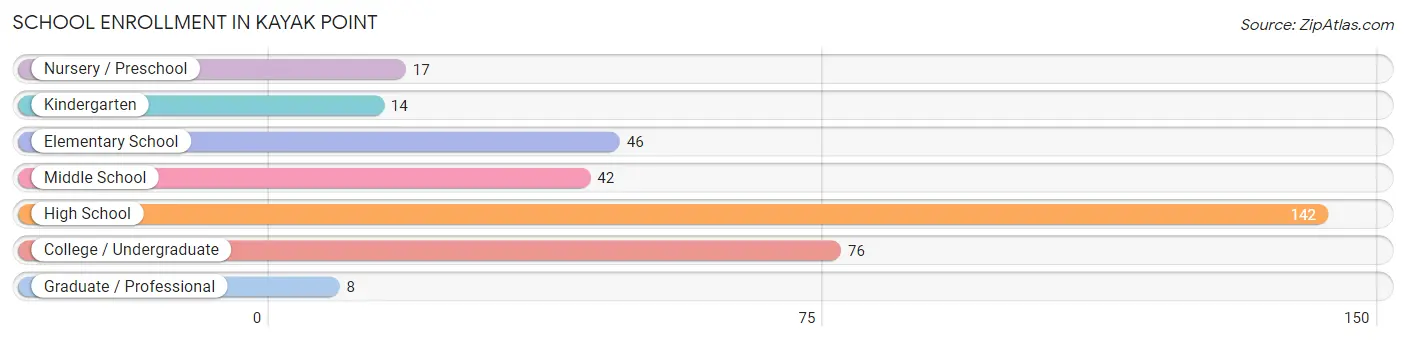
| School Level | # Students | % Students |
| Nursery / Preschool | 17 | 4.9% |
| Kindergarten | 14 | 4.1% |
| Elementary School | 46 | 13.3% |
| Middle School | 42 | 12.2% |
| High School | 142 | 41.2% |
| College / Undergraduate | 76 | 22.0% |
| Graduate / Professional | 8 | 2.3% |
| Total | 345 | 100.0% |
School Enrollment by Age by Funding Source in Kayak Point
Out of a total of 345 students who are enrolled in schools in Kayak Point, 78 (22.6%) attend a private institution, while the remaining 267 (77.4%) are enrolled in public schools. The age group of 25 to 34 year olds has the highest likelihood of being enrolled in private schools, with 8 (100.0% in the age bracket) enrolled. Conversely, the age group of 15 to 17 year olds has the lowest likelihood of being enrolled in a private school, with 61 (100.0% in the age bracket) attending a public institution.
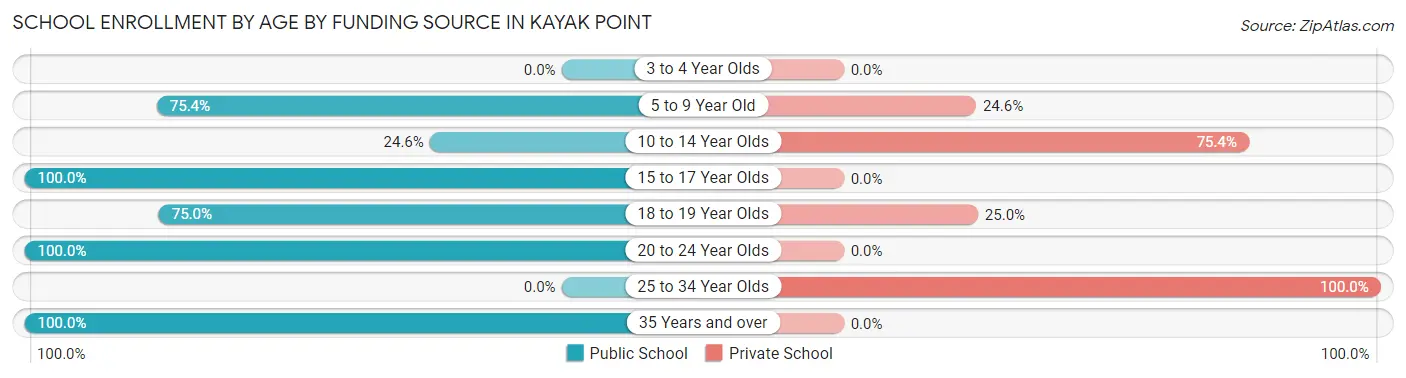
| Age Bracket | Public School | Private School |
| 3 to 4 Year Olds | 0 (0.0%) | 0 (0.0%) |
| 5 to 9 Year Old | 52 (75.4%) | 17 (24.6%) |
| 10 to 14 Year Olds | 14 (24.6%) | 43 (75.4%) |
| 15 to 17 Year Olds | 61 (100.0%) | 0 (0.0%) |
| 18 to 19 Year Olds | 30 (75.0%) | 10 (25.0%) |
| 20 to 24 Year Olds | 19 (100.0%) | 0 (0.0%) |
| 25 to 34 Year Olds | 0 (0.0%) | 8 (100.0%) |
| 35 Years and over | 91 (100.0%) | 0 (0.0%) |
| Total | 267 (77.4%) | 78 (22.6%) |
Educational Attainment by Field of Study in Kayak Point
Education (61 | 18.7%), business (50 | 15.3%), engineering (39 | 12.0%), physical & health sciences (36 | 11.0%), and arts & humanities (26 | 8.0%) are the most common fields of study among 326 individuals in Kayak Point who have obtained a bachelor's degree or higher.
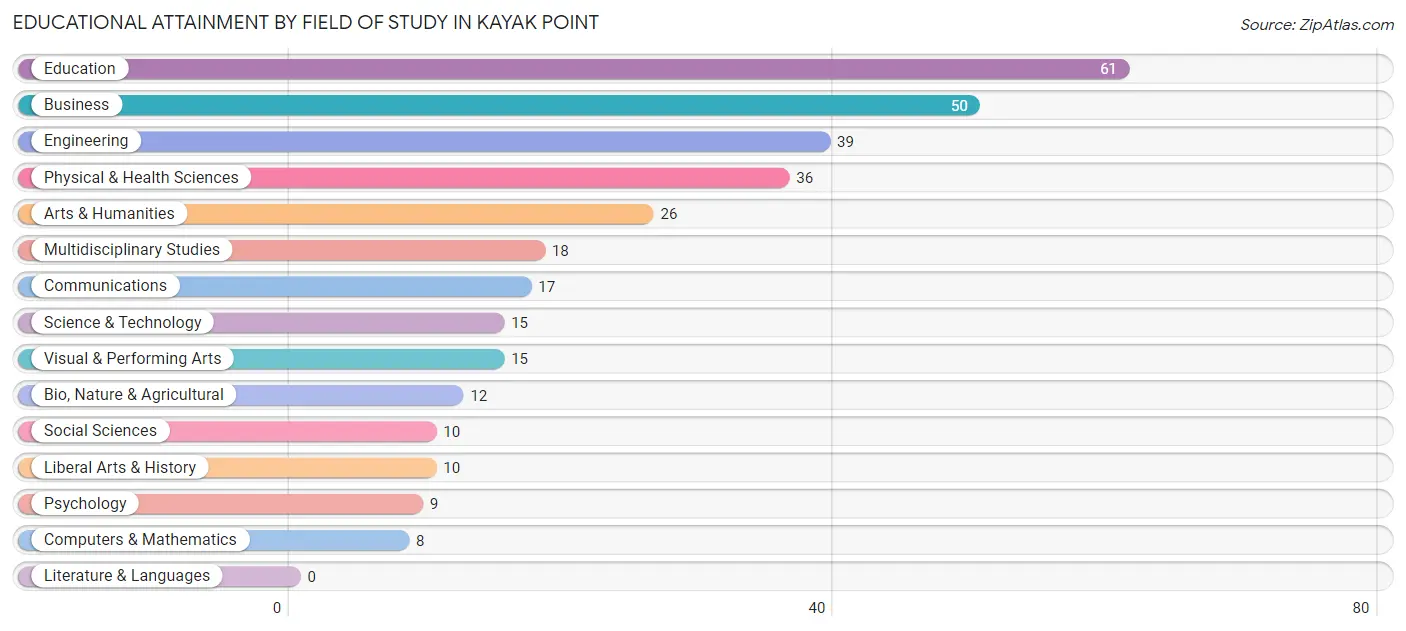
| Field of Study | # Graduates | % Graduates |
| Computers & Mathematics | 8 | 2.5% |
| Bio, Nature & Agricultural | 12 | 3.7% |
| Physical & Health Sciences | 36 | 11.0% |
| Psychology | 9 | 2.8% |
| Social Sciences | 10 | 3.1% |
| Engineering | 39 | 12.0% |
| Multidisciplinary Studies | 18 | 5.5% |
| Science & Technology | 15 | 4.6% |
| Business | 50 | 15.3% |
| Education | 61 | 18.7% |
| Literature & Languages | 0 | 0.0% |
| Liberal Arts & History | 10 | 3.1% |
| Visual & Performing Arts | 15 | 4.6% |
| Communications | 17 | 5.2% |
| Arts & Humanities | 26 | 8.0% |
| Total | 326 | 100.0% |
Transportation & Commute in Kayak Point
Vehicle Availability by Sex in Kayak Point
The most prevalent vehicle ownership categories in Kayak Point are males with 4 vehicles (153, accounting for 32.4%) and females with 4 vehicles (120, making up 46.0%).
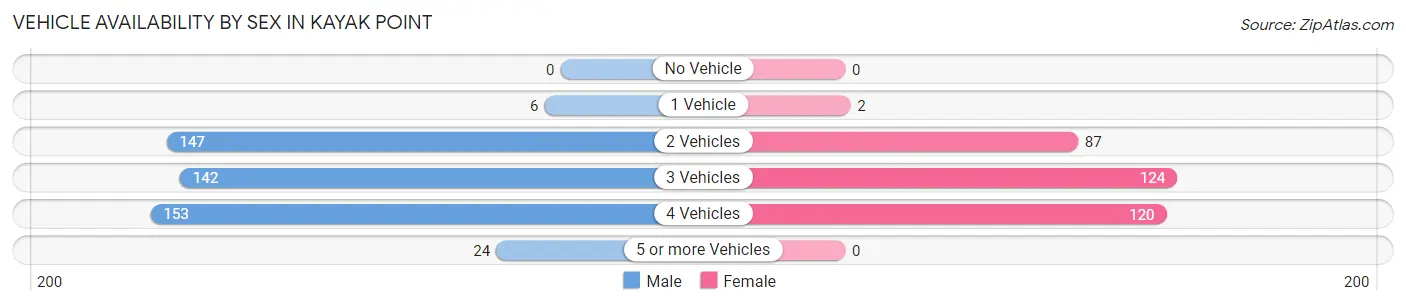
| Vehicles Available | Male | Female |
| No Vehicle | 0 (0.0%) | 0 (0.0%) |
| 1 Vehicle | 6 (1.3%) | 2 (0.6%) |
| 2 Vehicles | 147 (31.1%) | 87 (26.1%) |
| 3 Vehicles | 142 (30.1%) | 124 (37.2%) |
| 4 Vehicles | 153 (32.4%) | 120 (36.0%) |
| 5 or more Vehicles | 24 (5.1%) | 0 (0.0%) |
| Total | 472 (100.0%) | 333 (100.0%) |
Commute Time in Kayak Point
The most frequently occuring commute durations in Kayak Point are 30 to 34 minutes (149 commuters, 19.9%), 60 to 89 minutes (145 commuters, 19.3%), and 15 to 19 minutes (124 commuters, 16.5%).
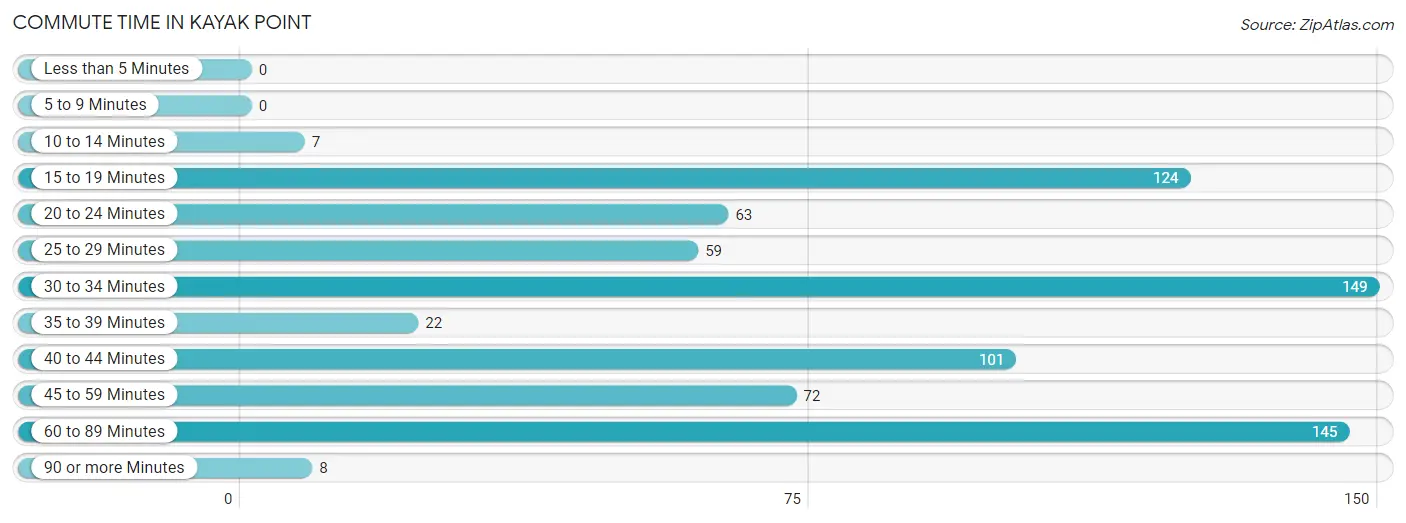
| Commute Time | # Commuters | % Commuters |
| Less than 5 Minutes | 0 | 0.0% |
| 5 to 9 Minutes | 0 | 0.0% |
| 10 to 14 Minutes | 7 | 0.9% |
| 15 to 19 Minutes | 124 | 16.5% |
| 20 to 24 Minutes | 63 | 8.4% |
| 25 to 29 Minutes | 59 | 7.9% |
| 30 to 34 Minutes | 149 | 19.9% |
| 35 to 39 Minutes | 22 | 2.9% |
| 40 to 44 Minutes | 101 | 13.5% |
| 45 to 59 Minutes | 72 | 9.6% |
| 60 to 89 Minutes | 145 | 19.3% |
| 90 or more Minutes | 8 | 1.1% |
Commute Time by Sex in Kayak Point
The most common commute times in Kayak Point are 15 to 19 minutes (117 commuters, 25.3%) for males and 60 to 89 minutes (58 commuters, 20.2%) for females.
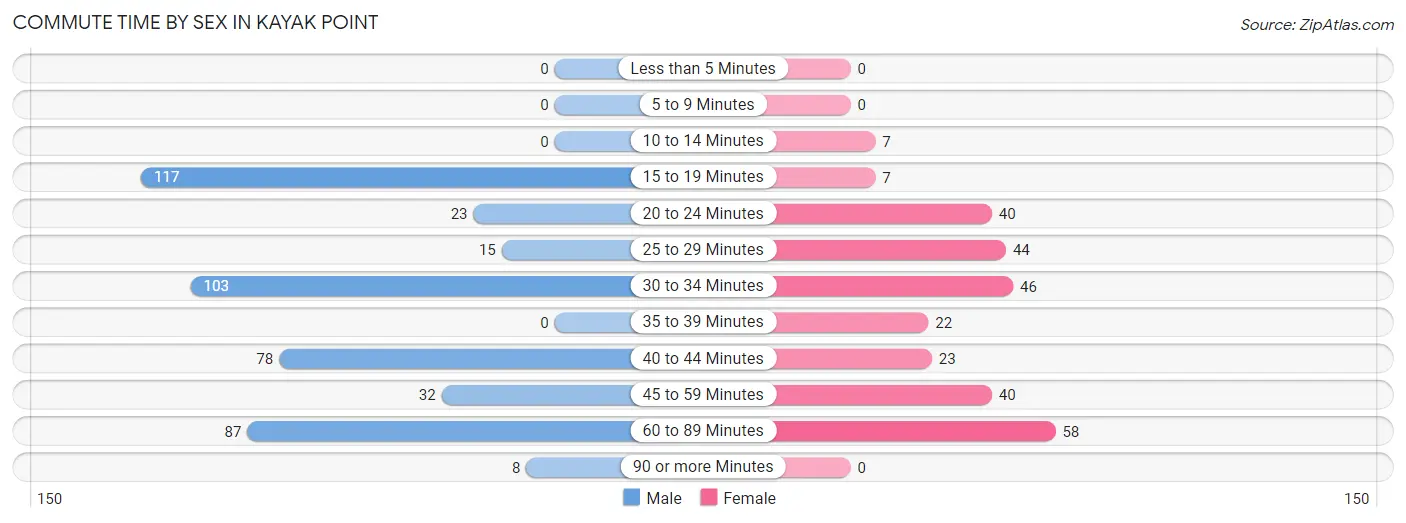
| Commute Time | Male | Female |
| Less than 5 Minutes | 0 (0.0%) | 0 (0.0%) |
| 5 to 9 Minutes | 0 (0.0%) | 0 (0.0%) |
| 10 to 14 Minutes | 0 (0.0%) | 7 (2.4%) |
| 15 to 19 Minutes | 117 (25.3%) | 7 (2.4%) |
| 20 to 24 Minutes | 23 (5.0%) | 40 (13.9%) |
| 25 to 29 Minutes | 15 (3.2%) | 44 (15.3%) |
| 30 to 34 Minutes | 103 (22.3%) | 46 (16.0%) |
| 35 to 39 Minutes | 0 (0.0%) | 22 (7.7%) |
| 40 to 44 Minutes | 78 (16.9%) | 23 (8.0%) |
| 45 to 59 Minutes | 32 (6.9%) | 40 (13.9%) |
| 60 to 89 Minutes | 87 (18.8%) | 58 (20.2%) |
| 90 or more Minutes | 8 (1.7%) | 0 (0.0%) |
Time of Departure to Work by Sex in Kayak Point
The most frequent times of departure to work in Kayak Point are 12:00 AM to 4:59 AM (136, 29.4%) for males and 12:00 PM to 3:59 PM (57, 19.9%) for females.
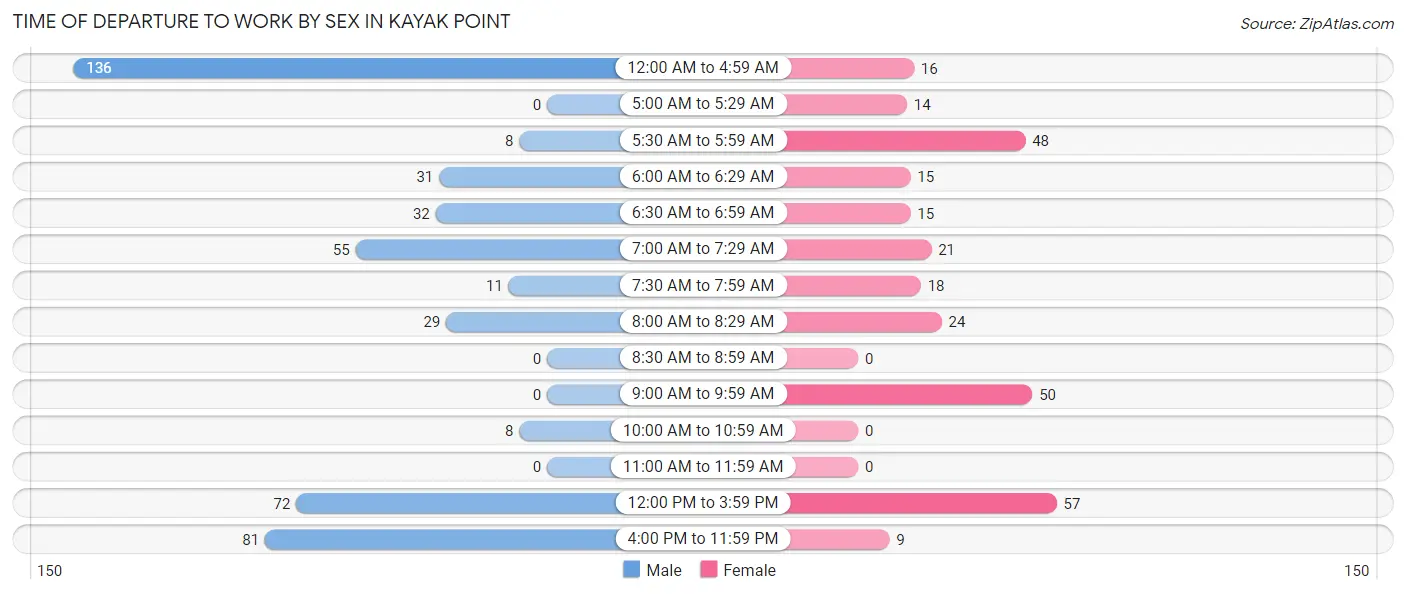
| Time of Departure | Male | Female |
| 12:00 AM to 4:59 AM | 136 (29.4%) | 16 (5.6%) |
| 5:00 AM to 5:29 AM | 0 (0.0%) | 14 (4.9%) |
| 5:30 AM to 5:59 AM | 8 (1.7%) | 48 (16.7%) |
| 6:00 AM to 6:29 AM | 31 (6.7%) | 15 (5.2%) |
| 6:30 AM to 6:59 AM | 32 (6.9%) | 15 (5.2%) |
| 7:00 AM to 7:29 AM | 55 (11.9%) | 21 (7.3%) |
| 7:30 AM to 7:59 AM | 11 (2.4%) | 18 (6.3%) |
| 8:00 AM to 8:29 AM | 29 (6.3%) | 24 (8.4%) |
| 8:30 AM to 8:59 AM | 0 (0.0%) | 0 (0.0%) |
| 9:00 AM to 9:59 AM | 0 (0.0%) | 50 (17.4%) |
| 10:00 AM to 10:59 AM | 8 (1.7%) | 0 (0.0%) |
| 11:00 AM to 11:59 AM | 0 (0.0%) | 0 (0.0%) |
| 12:00 PM to 3:59 PM | 72 (15.5%) | 57 (19.9%) |
| 4:00 PM to 11:59 PM | 81 (17.5%) | 9 (3.1%) |
| Total | 463 (100.0%) | 287 (100.0%) |
Housing Occupancy in Kayak Point
Occupancy by Ownership in Kayak Point
Of the total 585 dwellings in Kayak Point, owner-occupied units account for 533 (91.1%), while renter-occupied units make up 52 (8.9%).
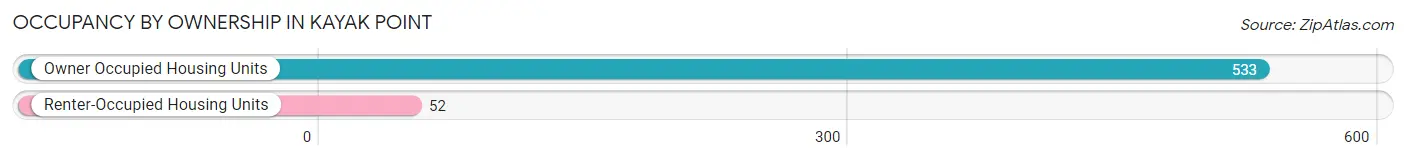
| Occupancy | # Housing Units | % Housing Units |
| Owner Occupied Housing Units | 533 | 91.1% |
| Renter-Occupied Housing Units | 52 | 8.9% |
| Total Occupied Housing Units | 585 | 100.0% |
Occupancy by Household Size in Kayak Point
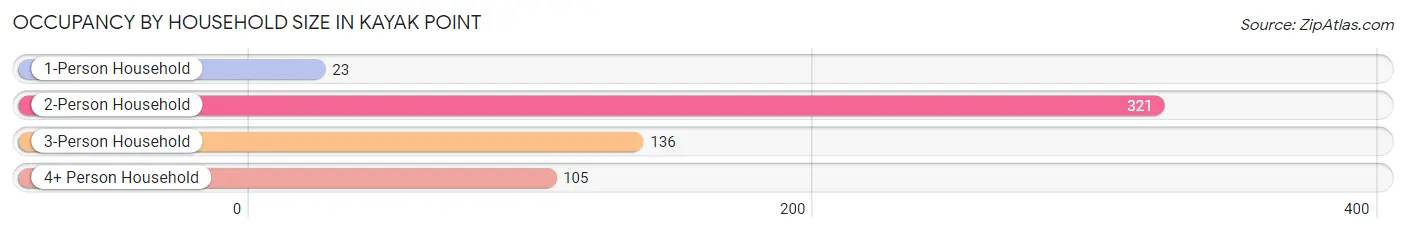
| Household Size | # Housing Units | % Housing Units |
| 1-Person Household | 23 | 3.9% |
| 2-Person Household | 321 | 54.9% |
| 3-Person Household | 136 | 23.3% |
| 4+ Person Household | 105 | 17.9% |
| Total Housing Units | 585 | 100.0% |
Occupancy by Ownership by Household Size in Kayak Point
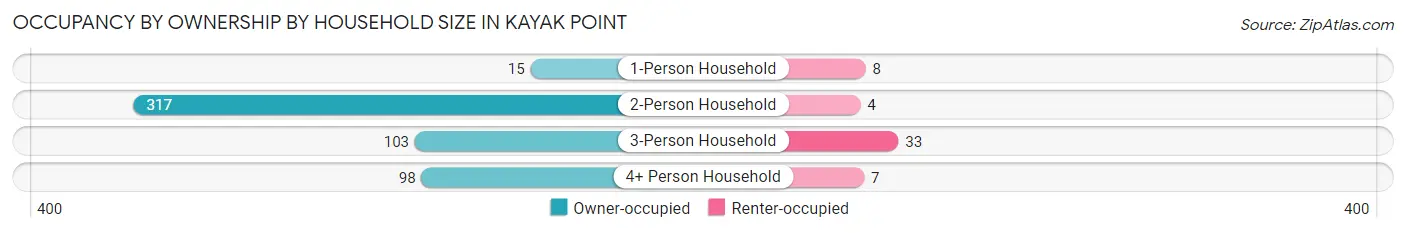
| Household Size | Owner-occupied | Renter-occupied |
| 1-Person Household | 15 (65.2%) | 8 (34.8%) |
| 2-Person Household | 317 (98.8%) | 4 (1.3%) |
| 3-Person Household | 103 (75.7%) | 33 (24.3%) |
| 4+ Person Household | 98 (93.3%) | 7 (6.7%) |
| Total Housing Units | 533 (91.1%) | 52 (8.9%) |
Occupancy by Educational Attainment in Kayak Point
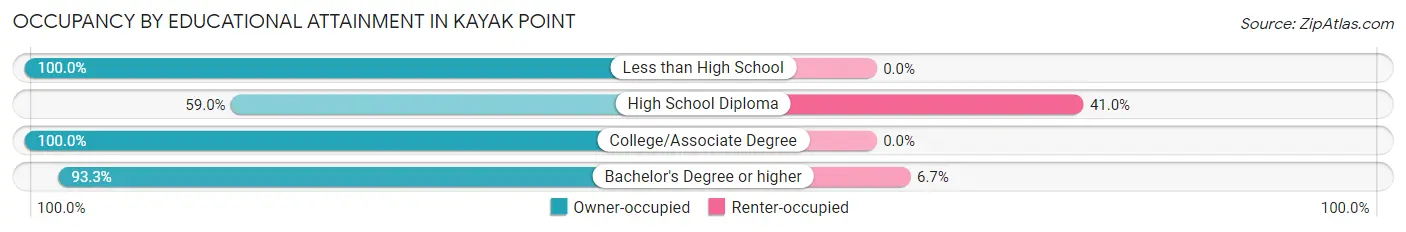
| Household Size | Owner-occupied | Renter-occupied |
| Less than High School | 34 (100.0%) | 0 (0.0%) |
| High School Diploma | 59 (59.0%) | 41 (41.0%) |
| College/Associate Degree | 287 (100.0%) | 0 (0.0%) |
| Bachelor's Degree or higher | 153 (93.3%) | 11 (6.7%) |
Occupancy by Age of Householder in Kayak Point
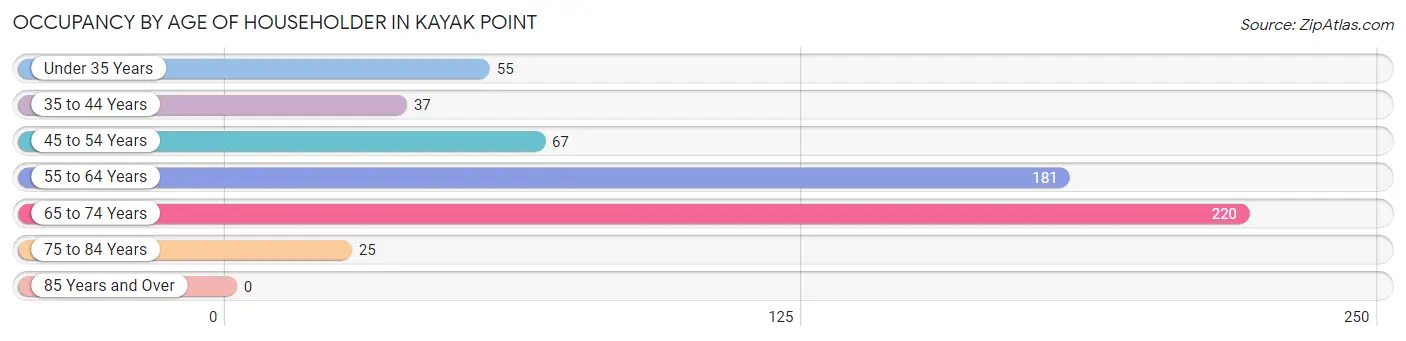
| Age Bracket | # Households | % Households |
| Under 35 Years | 55 | 9.4% |
| 35 to 44 Years | 37 | 6.3% |
| 45 to 54 Years | 67 | 11.5% |
| 55 to 64 Years | 181 | 30.9% |
| 65 to 74 Years | 220 | 37.6% |
| 75 to 84 Years | 25 | 4.3% |
| 85 Years and Over | 0 | 0.0% |
| Total | 585 | 100.0% |
Housing Finances in Kayak Point
Median Income by Occupancy in Kayak Point
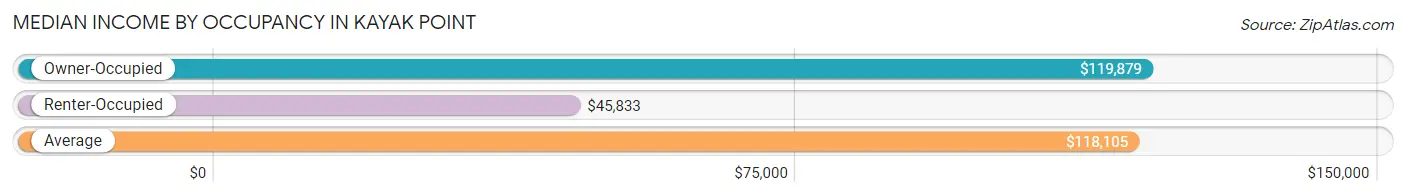
| Occupancy Type | # Households | Median Income |
| Owner-Occupied | 533 (91.1%) | $119,879 |
| Renter-Occupied | 52 (8.9%) | $45,833 |
| Average | 585 (100.0%) | $118,105 |
Occupancy by Householder Income Bracket in Kayak Point
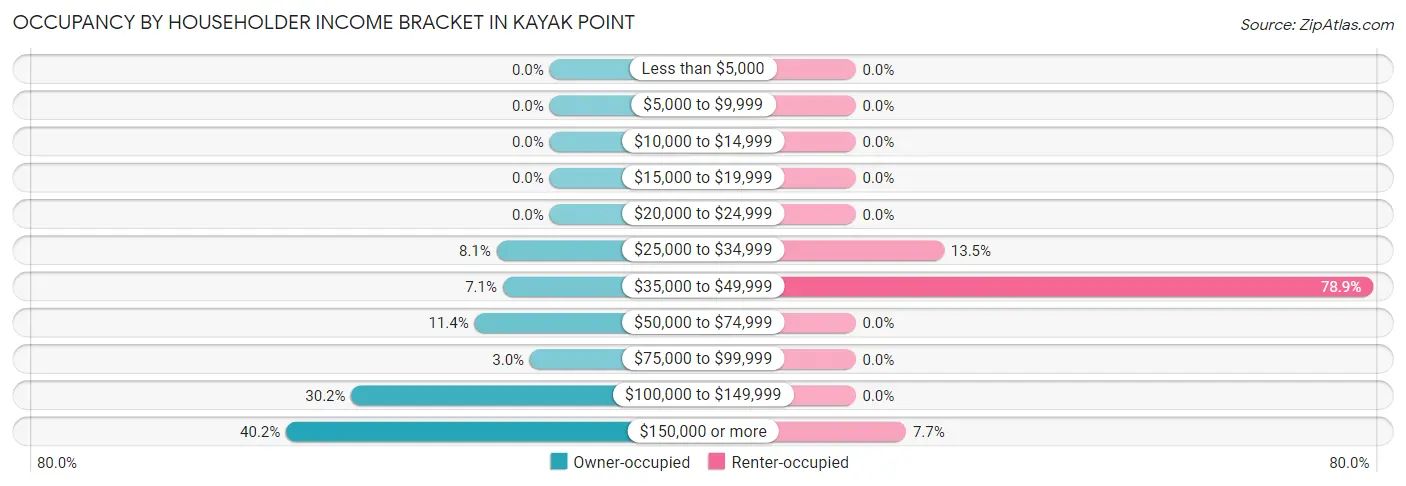
| Income Bracket | Owner-occupied | Renter-occupied |
| Less than $5,000 | 0 (0.0%) | 0 (0.0%) |
| $5,000 to $9,999 | 0 (0.0%) | 0 (0.0%) |
| $10,000 to $14,999 | 0 (0.0%) | 0 (0.0%) |
| $15,000 to $19,999 | 0 (0.0%) | 0 (0.0%) |
| $20,000 to $24,999 | 0 (0.0%) | 0 (0.0%) |
| $25,000 to $34,999 | 43 (8.1%) | 7 (13.5%) |
| $35,000 to $49,999 | 38 (7.1%) | 41 (78.8%) |
| $50,000 to $74,999 | 61 (11.4%) | 0 (0.0%) |
| $75,000 to $99,999 | 16 (3.0%) | 0 (0.0%) |
| $100,000 to $149,999 | 161 (30.2%) | 0 (0.0%) |
| $150,000 or more | 214 (40.2%) | 4 (7.7%) |
| Total | 533 (100.0%) | 52 (100.0%) |
Monthly Housing Cost Tiers in Kayak Point
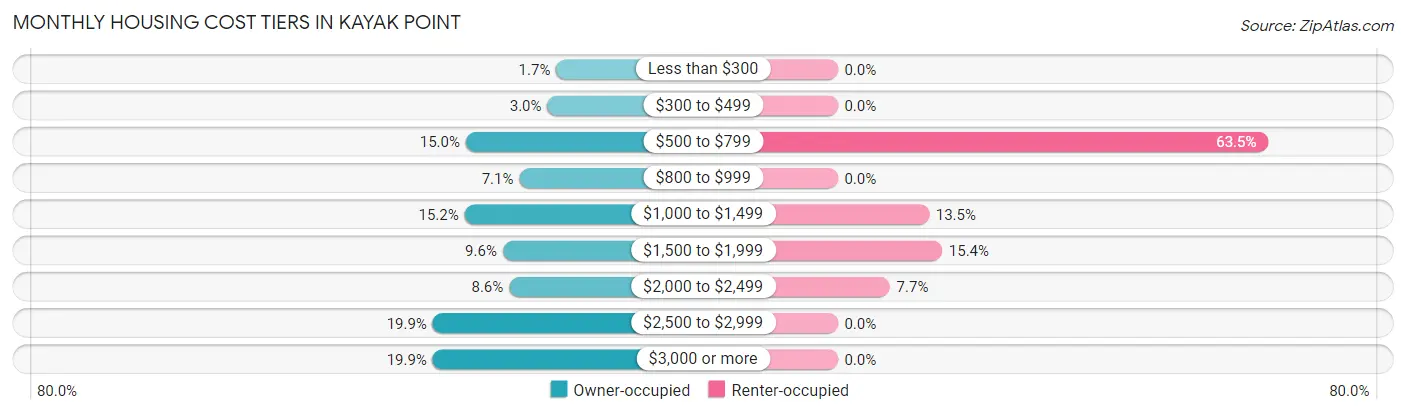
| Monthly Cost | Owner-occupied | Renter-occupied |
| Less than $300 | 9 (1.7%) | 0 (0.0%) |
| $300 to $499 | 16 (3.0%) | 0 (0.0%) |
| $500 to $799 | 80 (15.0%) | 33 (63.5%) |
| $800 to $999 | 38 (7.1%) | 0 (0.0%) |
| $1,000 to $1,499 | 81 (15.2%) | 7 (13.5%) |
| $1,500 to $1,999 | 51 (9.6%) | 8 (15.4%) |
| $2,000 to $2,499 | 46 (8.6%) | 4 (7.7%) |
| $2,500 to $2,999 | 106 (19.9%) | 0 (0.0%) |
| $3,000 or more | 106 (19.9%) | 0 (0.0%) |
| Total | 533 (100.0%) | 52 (100.0%) |
Physical Housing Characteristics in Kayak Point
Housing Structures in Kayak Point
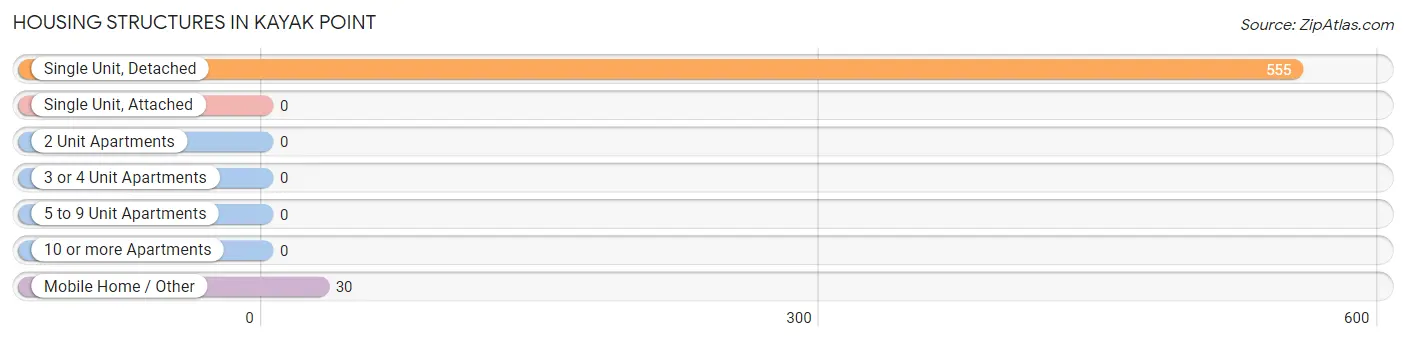
| Structure Type | # Housing Units | % Housing Units |
| Single Unit, Detached | 555 | 94.9% |
| Single Unit, Attached | 0 | 0.0% |
| 2 Unit Apartments | 0 | 0.0% |
| 3 or 4 Unit Apartments | 0 | 0.0% |
| 5 to 9 Unit Apartments | 0 | 0.0% |
| 10 or more Apartments | 0 | 0.0% |
| Mobile Home / Other | 30 | 5.1% |
| Total | 585 | 100.0% |
Housing Structures by Occupancy in Kayak Point
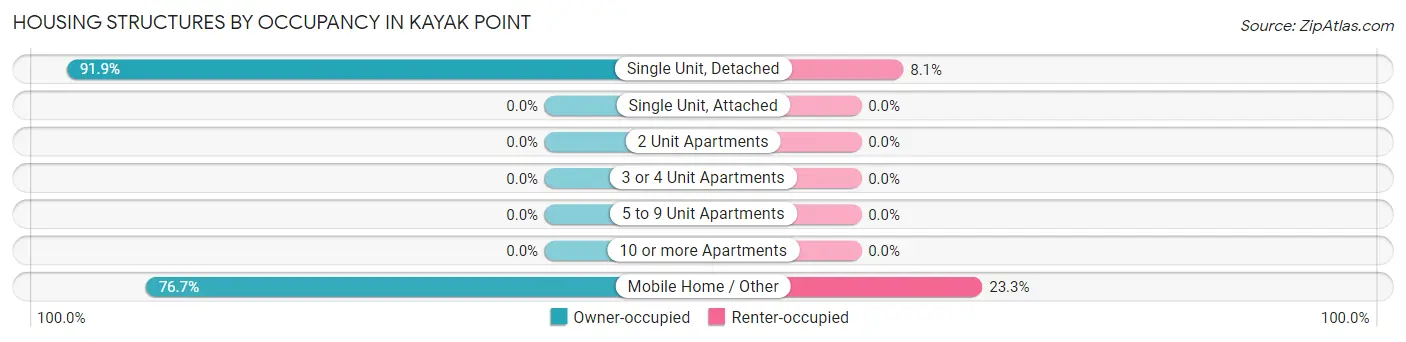
| Structure Type | Owner-occupied | Renter-occupied |
| Single Unit, Detached | 510 (91.9%) | 45 (8.1%) |
| Single Unit, Attached | 0 (0.0%) | 0 (0.0%) |
| 2 Unit Apartments | 0 (0.0%) | 0 (0.0%) |
| 3 or 4 Unit Apartments | 0 (0.0%) | 0 (0.0%) |
| 5 to 9 Unit Apartments | 0 (0.0%) | 0 (0.0%) |
| 10 or more Apartments | 0 (0.0%) | 0 (0.0%) |
| Mobile Home / Other | 23 (76.7%) | 7 (23.3%) |
| Total | 533 (91.1%) | 52 (8.9%) |
Housing Structures by Number of Rooms in Kayak Point
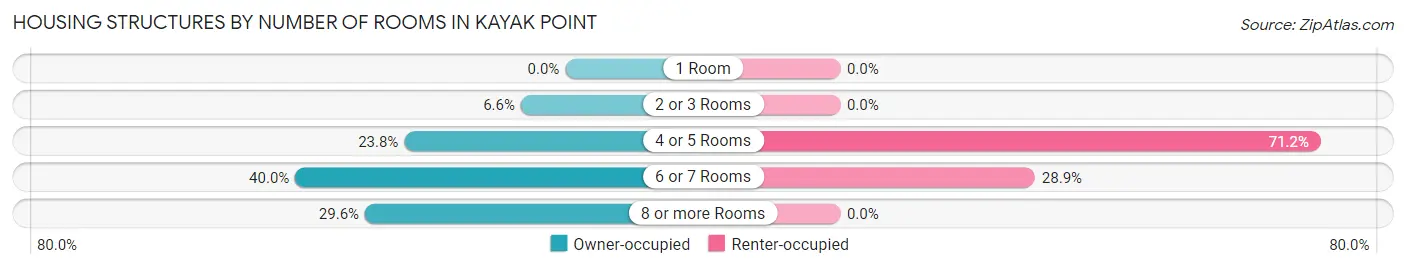
| Number of Rooms | Owner-occupied | Renter-occupied |
| 1 Room | 0 (0.0%) | 0 (0.0%) |
| 2 or 3 Rooms | 35 (6.6%) | 0 (0.0%) |
| 4 or 5 Rooms | 127 (23.8%) | 37 (71.2%) |
| 6 or 7 Rooms | 213 (40.0%) | 15 (28.8%) |
| 8 or more Rooms | 158 (29.6%) | 0 (0.0%) |
| Total | 533 (100.0%) | 52 (100.0%) |
Housing Structure by Heating Type in Kayak Point
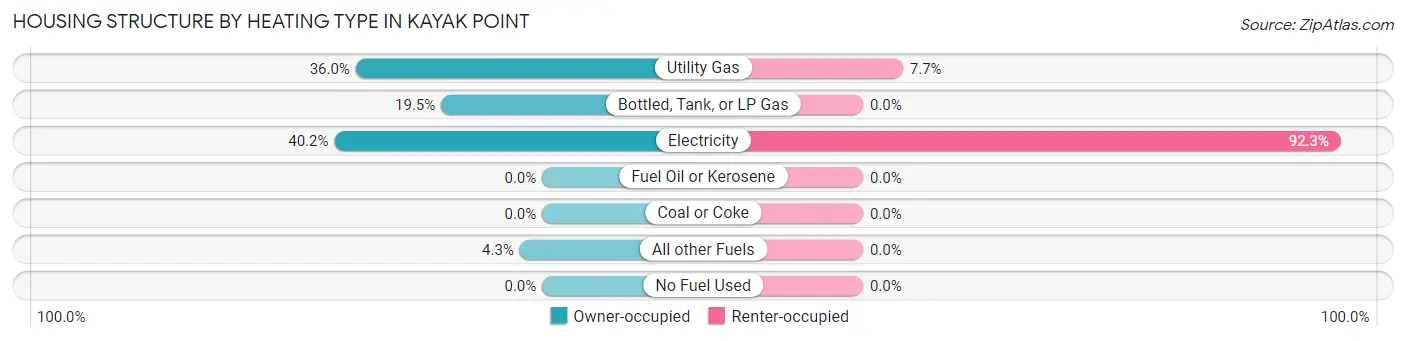
| Heating Type | Owner-occupied | Renter-occupied |
| Utility Gas | 192 (36.0%) | 4 (7.7%) |
| Bottled, Tank, or LP Gas | 104 (19.5%) | 0 (0.0%) |
| Electricity | 214 (40.2%) | 48 (92.3%) |
| Fuel Oil or Kerosene | 0 (0.0%) | 0 (0.0%) |
| Coal or Coke | 0 (0.0%) | 0 (0.0%) |
| All other Fuels | 23 (4.3%) | 0 (0.0%) |
| No Fuel Used | 0 (0.0%) | 0 (0.0%) |
| Total | 533 (100.0%) | 52 (100.0%) |
Household Vehicle Usage in Kayak Point
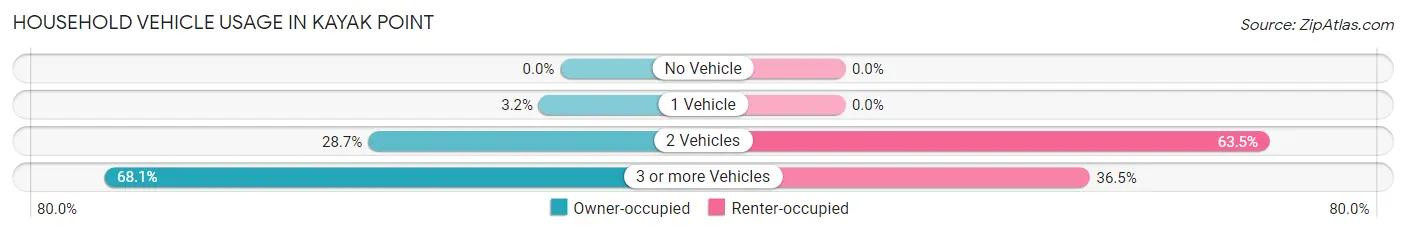
| Vehicles per Household | Owner-occupied | Renter-occupied |
| No Vehicle | 0 (0.0%) | 0 (0.0%) |
| 1 Vehicle | 17 (3.2%) | 0 (0.0%) |
| 2 Vehicles | 153 (28.7%) | 33 (63.5%) |
| 3 or more Vehicles | 363 (68.1%) | 19 (36.5%) |
| Total | 533 (100.0%) | 52 (100.0%) |
Real Estate & Mortgages in Kayak Point
Real Estate and Mortgage Overview in Kayak Point
| Characteristic | Without Mortgage | With Mortgage |
| Housing Units | 170 | 363 |
| Median Property Value | $541,000 | $650,100 |
| Median Household Income | - | - |
| Monthly Housing Costs | $696 | $106 |
| Real Estate Taxes | $4,905 | $0 |
Property Value by Mortgage Status in Kayak Point
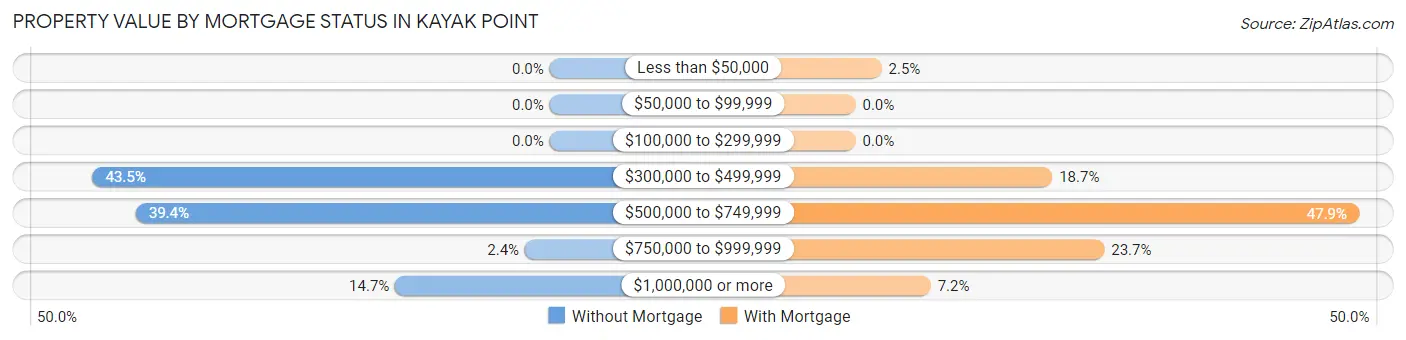
| Property Value | Without Mortgage | With Mortgage |
| Less than $50,000 | 0 (0.0%) | 9 (2.5%) |
| $50,000 to $99,999 | 0 (0.0%) | 0 (0.0%) |
| $100,000 to $299,999 | 0 (0.0%) | 0 (0.0%) |
| $300,000 to $499,999 | 74 (43.5%) | 68 (18.7%) |
| $500,000 to $749,999 | 67 (39.4%) | 174 (47.9%) |
| $750,000 to $999,999 | 4 (2.4%) | 86 (23.7%) |
| $1,000,000 or more | 25 (14.7%) | 26 (7.2%) |
| Total | 170 (100.0%) | 363 (100.0%) |
Household Income by Mortgage Status in Kayak Point
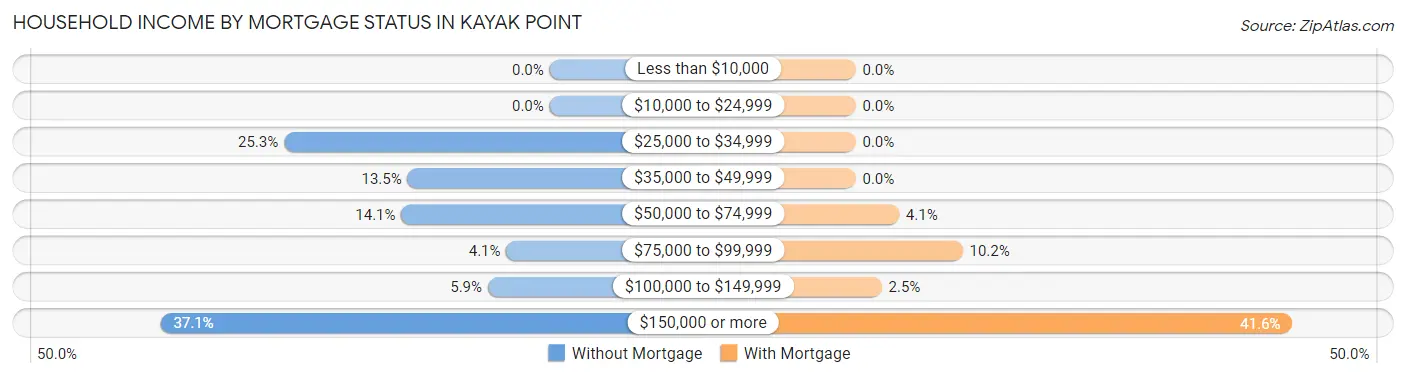
| Household Income | Without Mortgage | With Mortgage |
| Less than $10,000 | 0 (0.0%) | 0 (0.0%) |
| $10,000 to $24,999 | 0 (0.0%) | 0 (0.0%) |
| $25,000 to $34,999 | 43 (25.3%) | 0 (0.0%) |
| $35,000 to $49,999 | 23 (13.5%) | 0 (0.0%) |
| $50,000 to $74,999 | 24 (14.1%) | 15 (4.1%) |
| $75,000 to $99,999 | 7 (4.1%) | 37 (10.2%) |
| $100,000 to $149,999 | 10 (5.9%) | 9 (2.5%) |
| $150,000 or more | 63 (37.1%) | 151 (41.6%) |
| Total | 170 (100.0%) | 363 (100.0%) |
Property Value to Household Income Ratio in Kayak Point
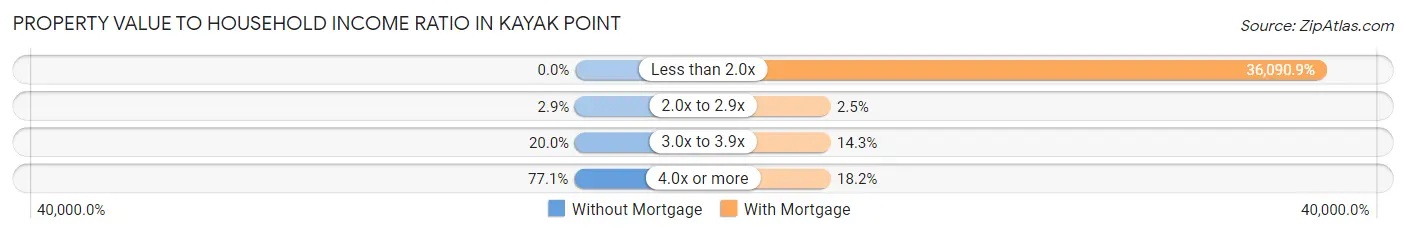
| Value-to-Income Ratio | Without Mortgage | With Mortgage |
| Less than 2.0x | 0 (0.0%) | 131,010 (36,090.9%) |
| 2.0x to 2.9x | 5 (2.9%) | 9 (2.5%) |
| 3.0x to 3.9x | 34 (20.0%) | 52 (14.3%) |
| 4.0x or more | 131 (77.1%) | 66 (18.2%) |
| Total | 170 (100.0%) | 363 (100.0%) |
Real Estate Taxes by Mortgage Status in Kayak Point
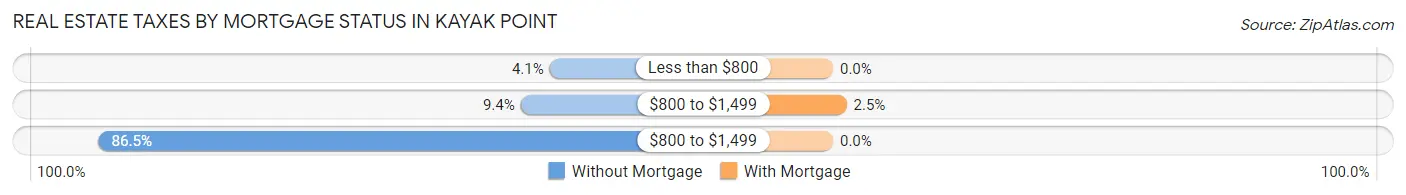
| Property Taxes | Without Mortgage | With Mortgage |
| Less than $800 | 7 (4.1%) | 0 (0.0%) |
| $800 to $1,499 | 16 (9.4%) | 9 (2.5%) |
| $800 to $1,499 | 147 (86.5%) | 0 (0.0%) |
| Total | 170 (100.0%) | 363 (100.0%) |
Health & Disability in Kayak Point
Health Insurance Coverage by Age in Kayak Point
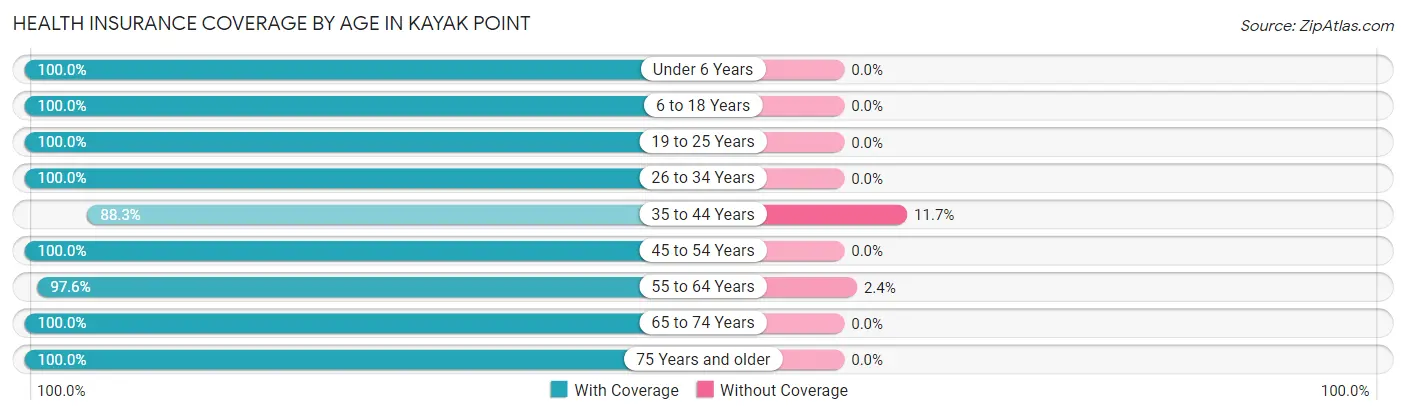
| Age Bracket | With Coverage | Without Coverage |
| Under 6 Years | 50 (100.0%) | 0 (0.0%) |
| 6 to 18 Years | 186 (100.0%) | 0 (0.0%) |
| 19 to 25 Years | 108 (100.0%) | 0 (0.0%) |
| 26 to 34 Years | 194 (100.0%) | 0 (0.0%) |
| 35 to 44 Years | 128 (88.3%) | 17 (11.7%) |
| 45 to 54 Years | 137 (100.0%) | 0 (0.0%) |
| 55 to 64 Years | 371 (97.6%) | 9 (2.4%) |
| 65 to 74 Years | 403 (100.0%) | 0 (0.0%) |
| 75 Years and older | 58 (100.0%) | 0 (0.0%) |
| Total | 1,635 (98.4%) | 26 (1.6%) |
Health Insurance Coverage by Citizenship Status in Kayak Point
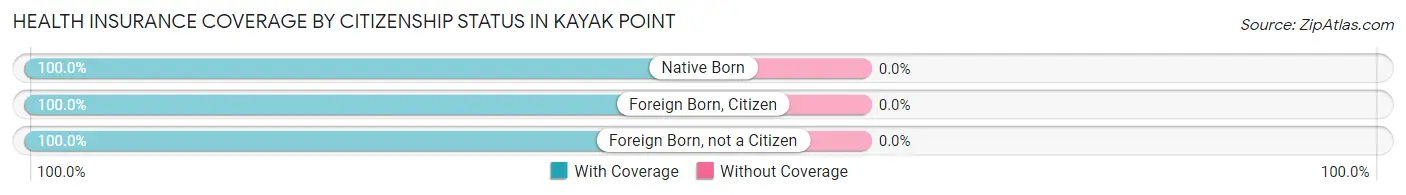
| Citizenship Status | With Coverage | Without Coverage |
| Native Born | 50 (100.0%) | 0 (0.0%) |
| Foreign Born, Citizen | 186 (100.0%) | 0 (0.0%) |
| Foreign Born, not a Citizen | 108 (100.0%) | 0 (0.0%) |
Health Insurance Coverage by Household Income in Kayak Point
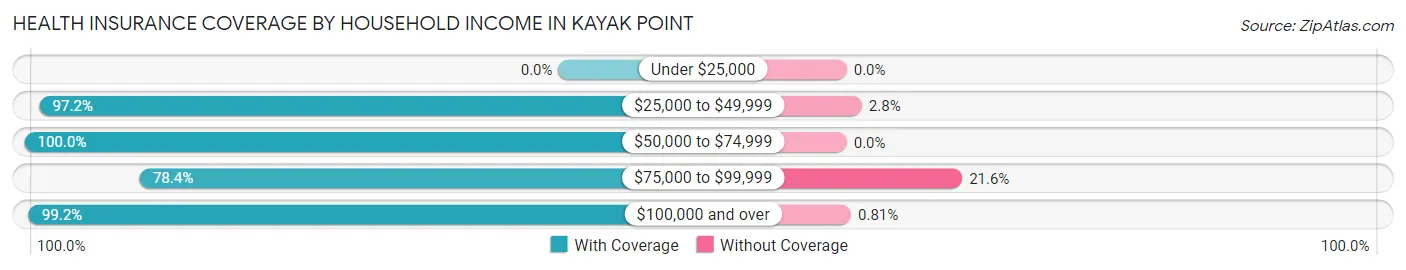
| Household Income | With Coverage | Without Coverage |
| Under $25,000 | 0 (0.0%) | 0 (0.0%) |
| $25,000 to $49,999 | 309 (97.2%) | 9 (2.8%) |
| $50,000 to $74,999 | 188 (100.0%) | 0 (0.0%) |
| $75,000 to $99,999 | 29 (78.4%) | 8 (21.6%) |
| $100,000 and over | 1,109 (99.2%) | 9 (0.8%) |
Public vs Private Health Insurance Coverage by Age in Kayak Point
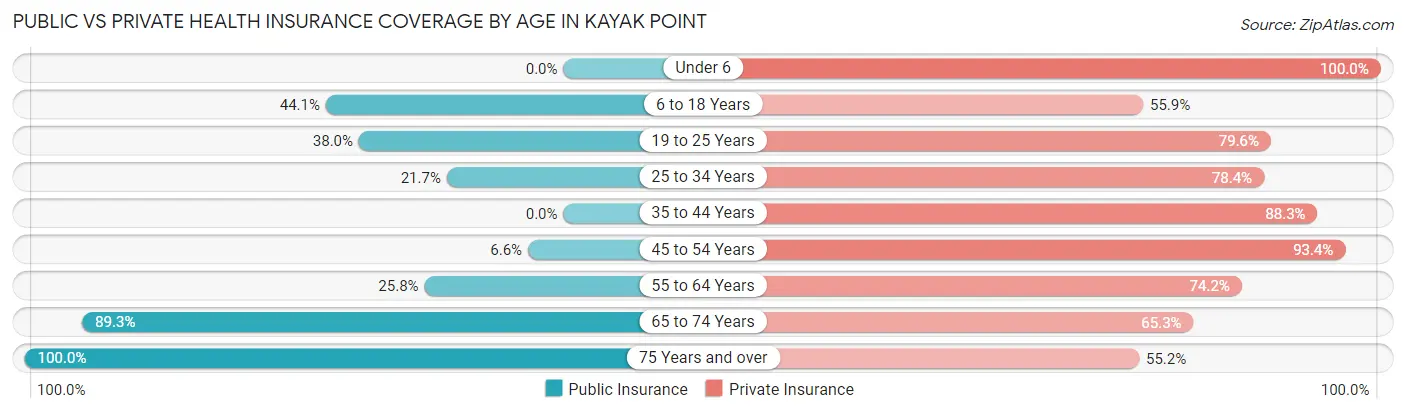
| Age Bracket | Public Insurance | Private Insurance |
| Under 6 | 0 (0.0%) | 50 (100.0%) |
| 6 to 18 Years | 82 (44.1%) | 104 (55.9%) |
| 19 to 25 Years | 41 (38.0%) | 86 (79.6%) |
| 25 to 34 Years | 42 (21.6%) | 152 (78.3%) |
| 35 to 44 Years | 0 (0.0%) | 128 (88.3%) |
| 45 to 54 Years | 9 (6.6%) | 128 (93.4%) |
| 55 to 64 Years | 98 (25.8%) | 282 (74.2%) |
| 65 to 74 Years | 360 (89.3%) | 263 (65.3%) |
| 75 Years and over | 58 (100.0%) | 32 (55.2%) |
| Total | 690 (41.5%) | 1,225 (73.8%) |
Disability Status by Sex by Age in Kayak Point
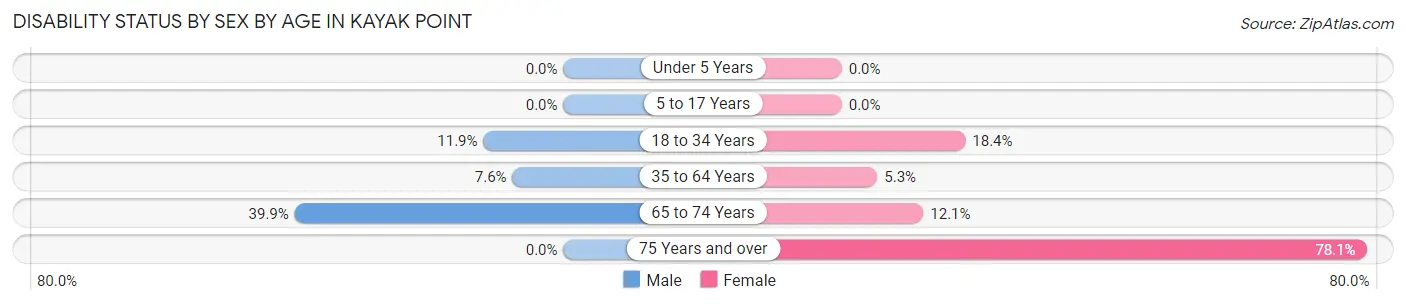
| Age Bracket | Male | Female |
| Under 5 Years | 0 (0.0%) | 0 (0.0%) |
| 5 to 17 Years | 0 (0.0%) | 0 (0.0%) |
| 18 to 34 Years | 19 (11.9%) | 29 (18.3%) |
| 35 to 64 Years | 30 (7.6%) | 14 (5.3%) |
| 65 to 74 Years | 85 (39.9%) | 23 (12.1%) |
| 75 Years and over | 0 (0.0%) | 32 (78.0%) |
Disability Class by Sex by Age in Kayak Point
Disability Class: Hearing Difficulty
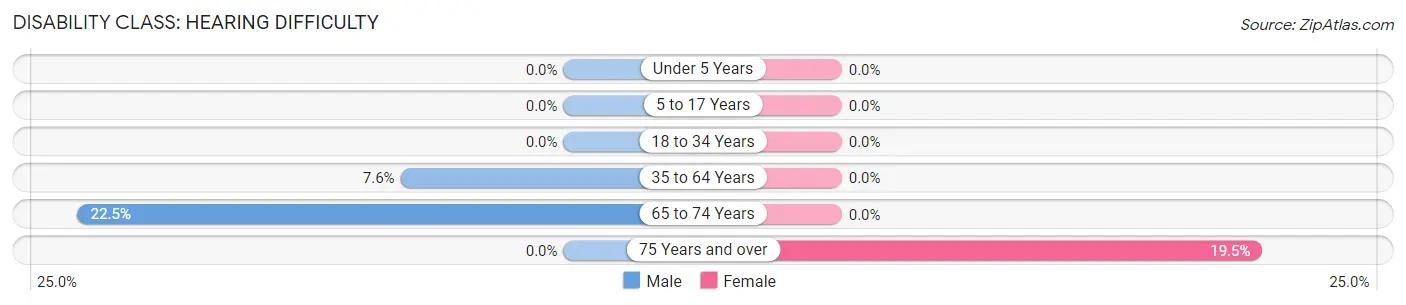
| Age Bracket | Male | Female |
| Under 5 Years | 0 (0.0%) | 0 (0.0%) |
| 5 to 17 Years | 0 (0.0%) | 0 (0.0%) |
| 18 to 34 Years | 0 (0.0%) | 0 (0.0%) |
| 35 to 64 Years | 30 (7.6%) | 0 (0.0%) |
| 65 to 74 Years | 48 (22.5%) | 0 (0.0%) |
| 75 Years and over | 0 (0.0%) | 8 (19.5%) |
Disability Class: Vision Difficulty
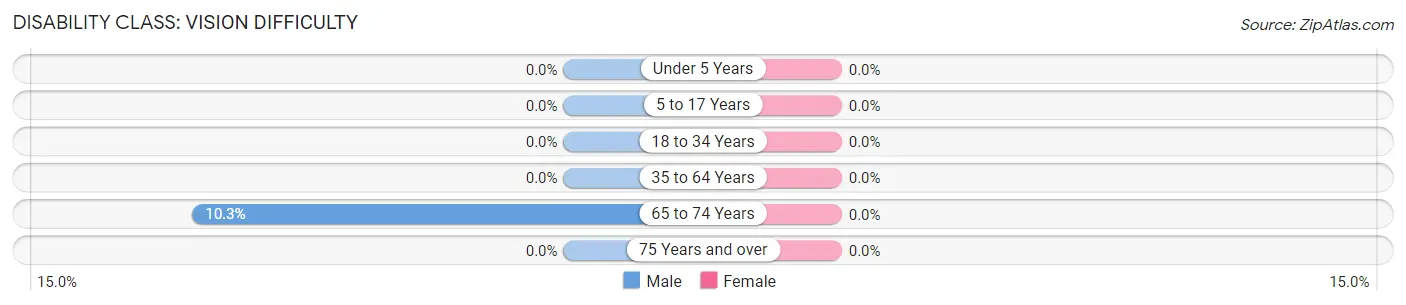
| Age Bracket | Male | Female |
| Under 5 Years | 0 (0.0%) | 0 (0.0%) |
| 5 to 17 Years | 0 (0.0%) | 0 (0.0%) |
| 18 to 34 Years | 0 (0.0%) | 0 (0.0%) |
| 35 to 64 Years | 0 (0.0%) | 0 (0.0%) |
| 65 to 74 Years | 22 (10.3%) | 0 (0.0%) |
| 75 Years and over | 0 (0.0%) | 0 (0.0%) |
Disability Class: Cognitive Difficulty
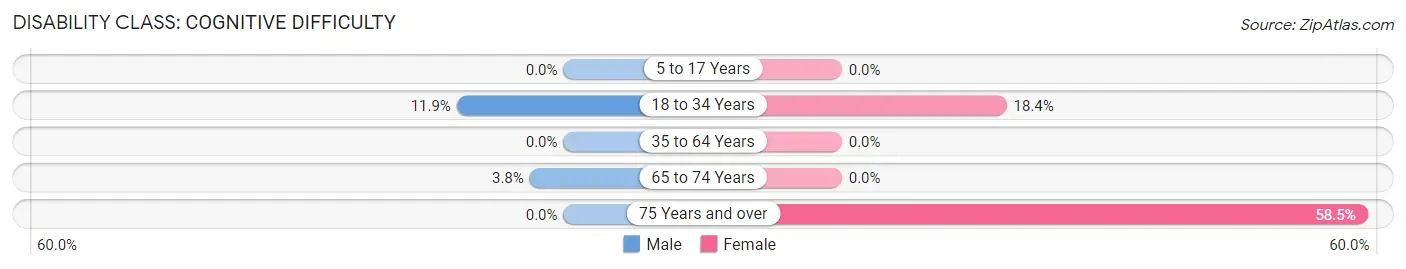
| Age Bracket | Male | Female |
| 5 to 17 Years | 0 (0.0%) | 0 (0.0%) |
| 18 to 34 Years | 19 (11.9%) | 29 (18.3%) |
| 35 to 64 Years | 0 (0.0%) | 0 (0.0%) |
| 65 to 74 Years | 8 (3.8%) | 0 (0.0%) |
| 75 Years and over | 0 (0.0%) | 24 (58.5%) |
Disability Class: Ambulatory Difficulty
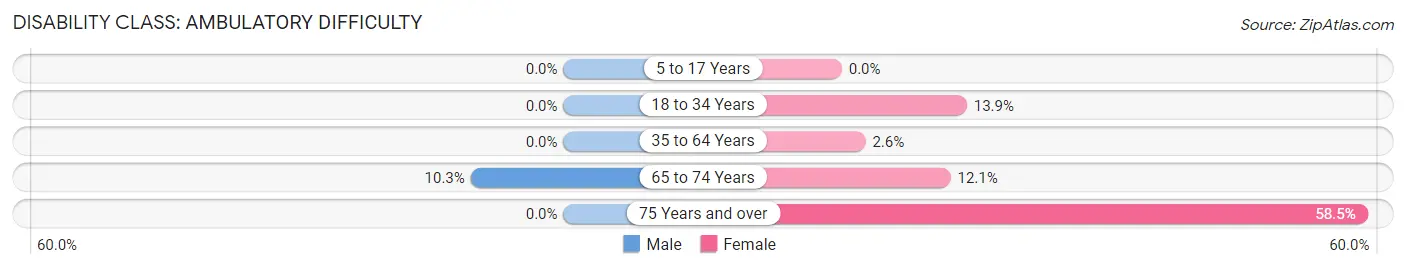
| Age Bracket | Male | Female |
| 5 to 17 Years | 0 (0.0%) | 0 (0.0%) |
| 18 to 34 Years | 0 (0.0%) | 22 (13.9%) |
| 35 to 64 Years | 0 (0.0%) | 7 (2.6%) |
| 65 to 74 Years | 22 (10.3%) | 23 (12.1%) |
| 75 Years and over | 0 (0.0%) | 24 (58.5%) |
Disability Class: Self-Care Difficulty
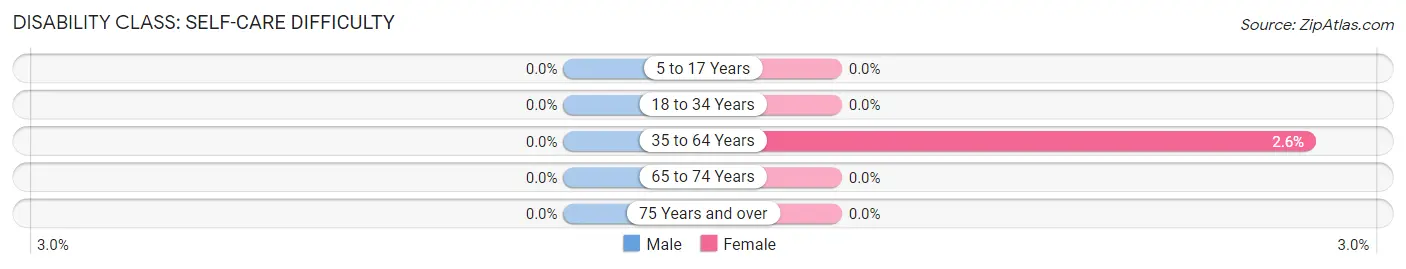
| Age Bracket | Male | Female |
| 5 to 17 Years | 0 (0.0%) | 0 (0.0%) |
| 18 to 34 Years | 0 (0.0%) | 0 (0.0%) |
| 35 to 64 Years | 0 (0.0%) | 7 (2.6%) |
| 65 to 74 Years | 0 (0.0%) | 0 (0.0%) |
| 75 Years and over | 0 (0.0%) | 0 (0.0%) |
Technology Access in Kayak Point
Computing Device Access in Kayak Point
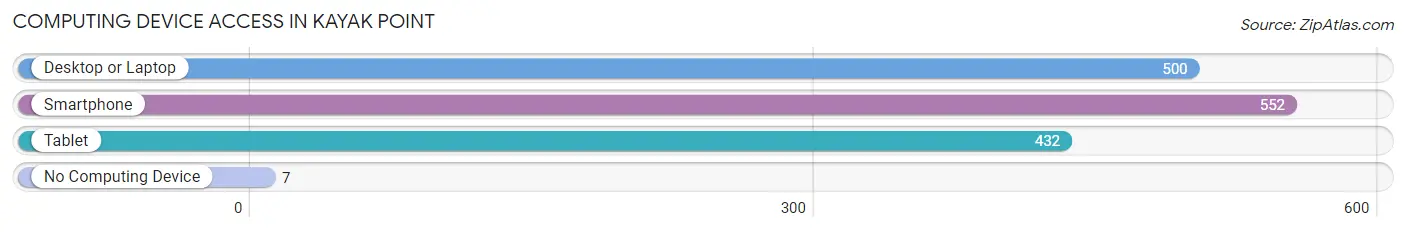
| Device Type | # Households | % Households |
| Desktop or Laptop | 500 | 85.5% |
| Smartphone | 552 | 94.4% |
| Tablet | 432 | 73.9% |
| No Computing Device | 7 | 1.2% |
| Total | 585 | 100.0% |
Internet Access in Kayak Point
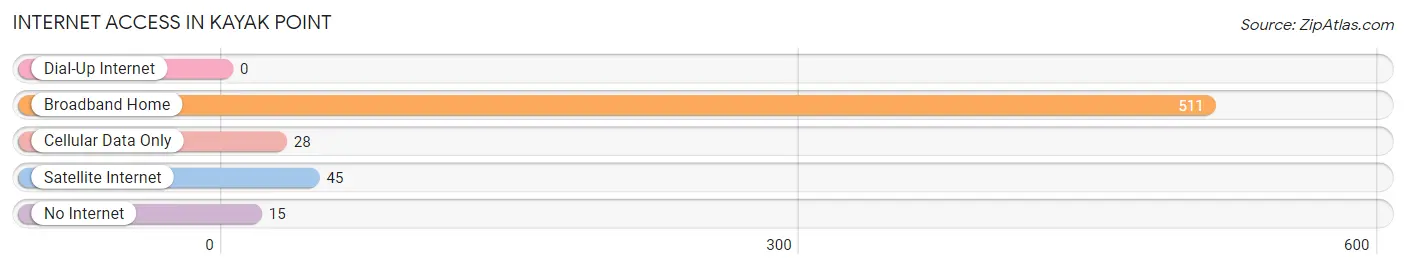
| Internet Type | # Households | % Households |
| Dial-Up Internet | 0 | 0.0% |
| Broadband Home | 511 | 87.4% |
| Cellular Data Only | 28 | 4.8% |
| Satellite Internet | 45 | 7.7% |
| No Internet | 15 | 2.6% |
| Total | 585 | 100.0% |
Kayak Point Summary
Kayak Point is a small unincorporated community located in Snohomish County, Washington, United States. It is situated on the western shore of Port Susan, a large bay in the Puget Sound. The community is located approximately 25 miles north of Seattle and is part of the Seattle metropolitan area.
History
The area now known as Kayak Point was first inhabited by the Snohomish people, who lived in the area for thousands of years before the arrival of European settlers. The first European settlers arrived in the area in the late 19th century, and the community was officially established in 1891. The community was named after the nearby Kayak Point, which was a popular spot for kayaking and fishing.
The area was primarily used for logging and fishing until the early 20th century, when the area began to be developed for residential and recreational use. The first golf course in the area was built in the 1920s, and the community has since become a popular destination for golfers.
Geography
Kayak Point is located on the western shore of Port Susan, a large bay in the Puget Sound. The community is located approximately 25 miles north of Seattle and is part of the Seattle metropolitan area. The area is characterized by its rolling hills, lush forests, and sandy beaches. The nearby Kayak Point State Park offers a variety of recreational activities, including camping, fishing, and hiking.
Economy
The economy of Kayak Point is largely based on tourism and recreation. The area is home to several golf courses, as well as a variety of restaurants and shops. The nearby Kayak Point State Park is a popular destination for camping, fishing, and hiking. The area is also home to a number of marinas, which offer boat rentals and other services.
Demographics
As of the 2010 census, the population of Kayak Point was 1,845. The population is primarily white (90.2%), with the remaining population being made up of Asian (3.2%), African American (2.2%), and other races (4.4%). The median household income in the area is $63,917, and the median age is 44.7 years. The area is served by the Marysville School District.
Conclusion
Kayak Point is a small unincorporated community located in Snohomish County, Washington, United States. It is situated on the western shore of Port Susan, a large bay in the Puget Sound. The community is located approximately 25 miles north of Seattle and is part of the Seattle metropolitan area. The area is characterized by its rolling hills, lush forests, and sandy beaches. The economy of Kayak Point is largely based on tourism and recreation, and the population is primarily white. The area is served by the Marysville School District and is home to a variety of recreational activities, including camping, fishing, and hiking.
Common Questions
What is Per Capita Income in Kayak Point?
Per Capita income in Kayak Point is $47,528.
What is the Median Family Income in Kayak Point?
Median Family Income in Kayak Point is $117,063.
What is the Median Household income in Kayak Point?
Median Household Income in Kayak Point is $118,105.
What is Income or Wage Gap in Kayak Point?
Income or Wage Gap in Kayak Point is 22.8%.
Women in Kayak Point earn 77.2 cents for every dollar earned by a man.
What is Inequality or Gini Index in Kayak Point?
Inequality or Gini Index in Kayak Point is 0.33.
What is the Total Population of Kayak Point?
Total Population of Kayak Point is 1,661.
What is the Total Male Population of Kayak Point?
Total Male Population of Kayak Point is 934.
What is the Total Female Population of Kayak Point?
Total Female Population of Kayak Point is 727.
What is the Ratio of Males per 100 Females in Kayak Point?
There are 128.47 Males per 100 Females in Kayak Point.
What is the Ratio of Females per 100 Males in Kayak Point?
There are 77.84 Females per 100 Males in Kayak Point.
What is the Median Population Age in Kayak Point?
Median Population Age in Kayak Point is 56.1 Years.
What is the Average Family Size in Kayak Point
Average Family Size in Kayak Point is 2.9 People.
What is the Average Household Size in Kayak Point
Average Household Size in Kayak Point is 2.8 People.
How Large is the Labor Force in Kayak Point?
There are 886 People in the Labor Forcein in Kayak Point.
What is the Percentage of People in the Labor Force in Kayak Point?
59.2% of People are in the Labor Force in Kayak Point.
What is the Unemployment Rate in Kayak Point?
Unemployment Rate in Kayak Point is 4.6%.