Cities with the Most Immigrants from Italy in Washington
RELATED REPORTS & OPTIONS
Italy
Washington
Compare Cities
Map of Cities with the Most Immigrants from Italy in Washington
0
800
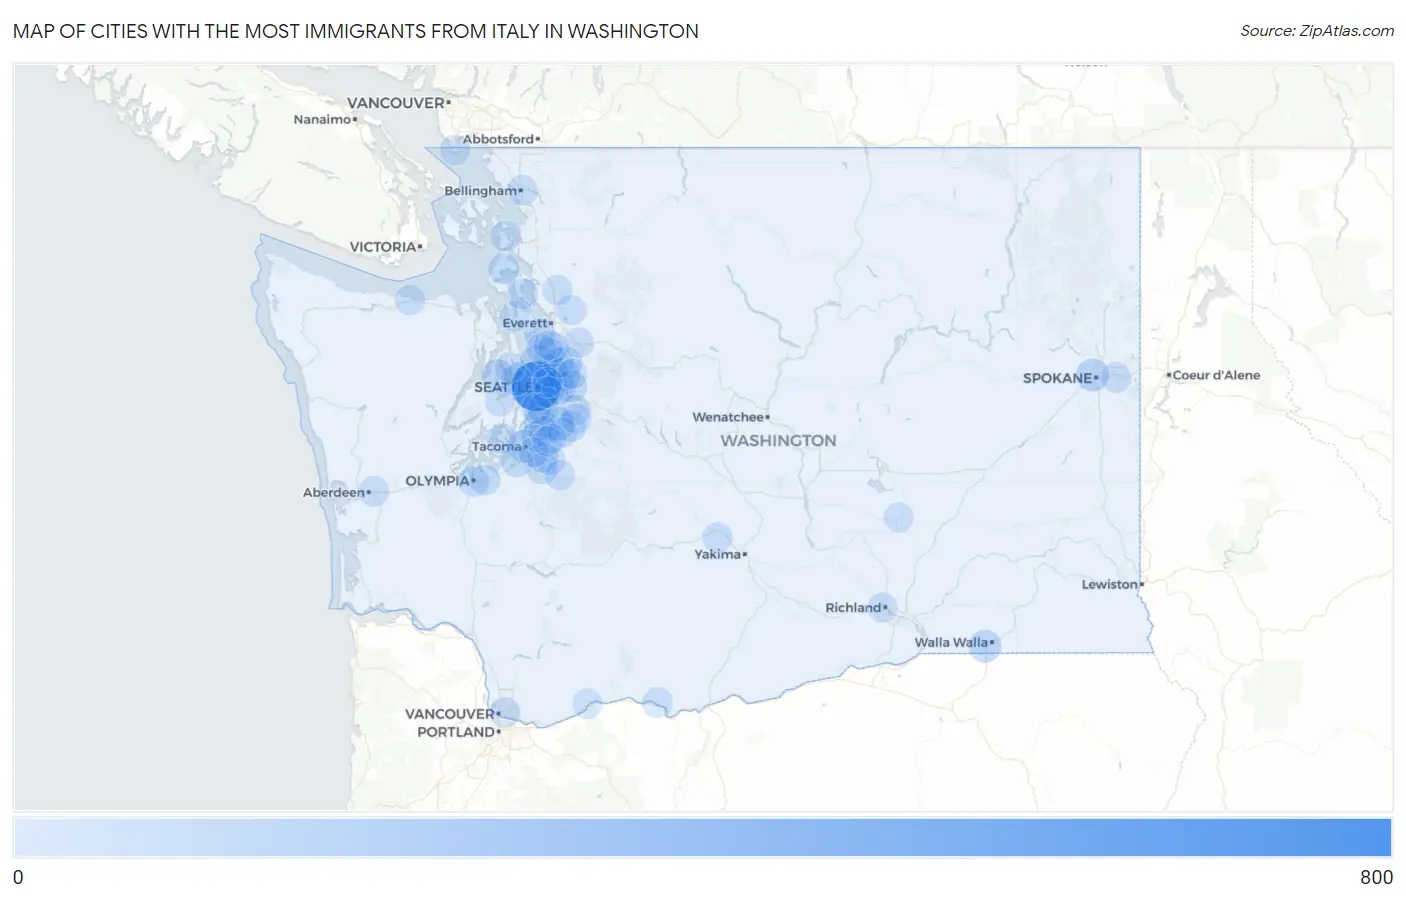
Cities with the Most Immigrants from Italy in Washington
| City | Italy | vs State | vs National | |
| 1. | Seattle | 627 | 2,551(24.58%)#1 | 312,941(0.20%)#28 |
| 2. | Kent | 106 | 2,551(4.16%)#2 | 312,941(0.03%)#473 |
| 3. | Bellevue | 104 | 2,551(4.08%)#3 | 312,941(0.03%)#485 |
| 4. | Spokane | 88 | 2,551(3.45%)#4 | 312,941(0.03%)#578 |
| 5. | Redmond | 80 | 2,551(3.14%)#5 | 312,941(0.03%)#646 |
| 6. | Kirkland | 76 | 2,551(2.98%)#6 | 312,941(0.02%)#673 |
| 7. | Des Moines | 75 | 2,551(2.94%)#7 | 312,941(0.02%)#690 |
| 8. | Tacoma | 74 | 2,551(2.90%)#8 | 312,941(0.02%)#698 |
| 9. | College Place | 73 | 2,551(2.86%)#9 | 312,941(0.02%)#711 |
| 10. | Tukwila | 63 | 2,551(2.47%)#10 | 312,941(0.02%)#813 |
| 11. | Shoreline | 61 | 2,551(2.39%)#11 | 312,941(0.02%)#831 |
| 12. | Silverdale | 60 | 2,551(2.35%)#12 | 312,941(0.02%)#846 |
| 13. | Cottage Lake | 55 | 2,551(2.16%)#13 | 312,941(0.02%)#914 |
| 14. | Sammamish | 54 | 2,551(2.12%)#14 | 312,941(0.02%)#927 |
| 15. | Lakewood | 45 | 2,551(1.76%)#15 | 312,941(0.01%)#1,083 |
| 16. | Mercer Island | 42 | 2,551(1.65%)#16 | 312,941(0.01%)#1,141 |
| 17. | Mukilteo | 42 | 2,551(1.65%)#17 | 312,941(0.01%)#1,143 |
| 18. | Bainbridge Island | 37 | 2,551(1.45%)#18 | 312,941(0.01%)#1,264 |
| 19. | South Hill | 32 | 2,551(1.25%)#19 | 312,941(0.01%)#1,375 |
| 20. | Maple Valley | 32 | 2,551(1.25%)#20 | 312,941(0.01%)#1,383 |
| 21. | Oak Harbor | 31 | 2,551(1.22%)#21 | 312,941(0.01%)#1,424 |
| 22. | Olympia | 29 | 2,551(1.14%)#22 | 312,941(0.01%)#1,487 |
| 23. | Bothell West | 28 | 2,551(1.10%)#23 | 312,941(0.01%)#1,542 |
| 24. | Camano | 27 | 2,551(1.06%)#24 | 312,941(0.01%)#1,574 |
| 25. | Mirrormont | 26 | 2,551(1.02%)#25 | 312,941(0.01%)#1,632 |
| 26. | Federal Way | 22 | 2,551(0.86%)#26 | 312,941(0.01%)#1,759 |
| 27. | Lacey | 18 | 2,551(0.71%)#27 | 312,941(0.01%)#1,961 |
| 28. | Puyallup | 18 | 2,551(0.71%)#28 | 312,941(0.01%)#1,964 |
| 29. | Artondale | 17 | 2,551(0.67%)#29 | 312,941(0.01%)#2,060 |
| 30. | Woodinville | 16 | 2,551(0.63%)#30 | 312,941(0.01%)#2,127 |
| 31. | Vancouver | 15 | 2,551(0.59%)#31 | 312,941(0.00%)#2,167 |
| 32. | Port Orchard | 15 | 2,551(0.59%)#32 | 312,941(0.00%)#2,198 |
| 33. | Freeland | 15 | 2,551(0.59%)#33 | 312,941(0.00%)#2,236 |
| 34. | Bellingham | 14 | 2,551(0.55%)#34 | 312,941(0.00%)#2,247 |
| 35. | Spokane Valley | 13 | 2,551(0.51%)#35 | 312,941(0.00%)#2,311 |
| 36. | Aberdeen | 13 | 2,551(0.51%)#36 | 312,941(0.00%)#2,344 |
| 37. | Port Angeles | 12 | 2,551(0.47%)#37 | 312,941(0.00%)#2,429 |
| 38. | Mill Creek East | 11 | 2,551(0.43%)#38 | 312,941(0.00%)#2,503 |
| 39. | Lakeland North | 11 | 2,551(0.43%)#39 | 312,941(0.00%)#2,513 |
| 40. | Burien | 10 | 2,551(0.39%)#40 | 312,941(0.00%)#2,596 |
| 41. | Lynnwood | 10 | 2,551(0.39%)#41 | 312,941(0.00%)#2,602 |
| 42. | Monroe | 10 | 2,551(0.39%)#42 | 312,941(0.00%)#2,619 |
| 43. | Hobart | 10 | 2,551(0.39%)#43 | 312,941(0.00%)#2,663 |
| 44. | Lochsloy | 10 | 2,551(0.39%)#44 | 312,941(0.00%)#2,701 |
| 45. | Arlington | 9 | 2,551(0.35%)#45 | 312,941(0.00%)#2,747 |
| 46. | Alderton | 9 | 2,551(0.35%)#46 | 312,941(0.00%)#2,797 |
| 47. | Tieton | 9 | 2,551(0.35%)#47 | 312,941(0.00%)#2,808 |
| 48. | Lyle | 9 | 2,551(0.35%)#48 | 312,941(0.00%)#2,822 |
| 49. | Union Hill Novelty Hill | 8 | 2,551(0.31%)#49 | 312,941(0.00%)#2,858 |
| 50. | Crocker | 8 | 2,551(0.31%)#50 | 312,941(0.00%)#2,937 |
| 51. | Auburn | 6 | 2,551(0.24%)#51 | 312,941(0.00%)#3,080 |
| 52. | Waller | 6 | 2,551(0.24%)#52 | 312,941(0.00%)#3,109 |
| 53. | Suquamish | 6 | 2,551(0.24%)#53 | 312,941(0.00%)#3,123 |
| 54. | Medina | 6 | 2,551(0.24%)#54 | 312,941(0.00%)#3,135 |
| 55. | Point Roberts | 6 | 2,551(0.24%)#55 | 312,941(0.00%)#3,158 |
| 56. | Algona | 5 | 2,551(0.20%)#56 | 312,941(0.00%)#3,225 |
| 57. | Stevenson | 5 | 2,551(0.20%)#57 | 312,941(0.00%)#3,257 |
| 58. | Roche Harbor | 5 | 2,551(0.20%)#58 | 312,941(0.00%)#3,271 |
| 59. | Richland | 4 | 2,551(0.16%)#59 | 312,941(0.00%)#3,289 |
| 60. | Lake Morton Berrydale | 4 | 2,551(0.16%)#60 | 312,941(0.00%)#3,304 |
| 61. | Anacortes | 3 | 2,551(0.12%)#61 | 312,941(0.00%)#3,391 |
| 62. | Martha Lake | 2 | 2,551(0.08%)#62 | 312,941(0.00%)#3,483 |
| 63. | Othello | 2 | 2,551(0.08%)#63 | 312,941(0.00%)#3,491 |
Common Questions
What are the Top 10 Cities with the Most Immigrants from Italy in Washington?
Top 10 Cities with the Most Immigrants from Italy in Washington are:
#1
627
#2
106
#3
104
#4
88
#5
80
#6
76
#7
75
#8
74
#9
73
#10
63
What city has the Most Immigrants from Italy in Washington?
Seattle has the Most Immigrants from Italy in Washington with 627.
What is the Total Immigrants from Italy in the State of Washington?
Total Immigrants from Italy in Washington is 2,551.
What is the Total Immigrants from Italy in the United States?
Total Immigrants from Italy in the United States is 312,941.