Cities with the Largest Finnish Community in Washington
RELATED REPORTS & OPTIONS
Finnish
Washington
Compare Cities
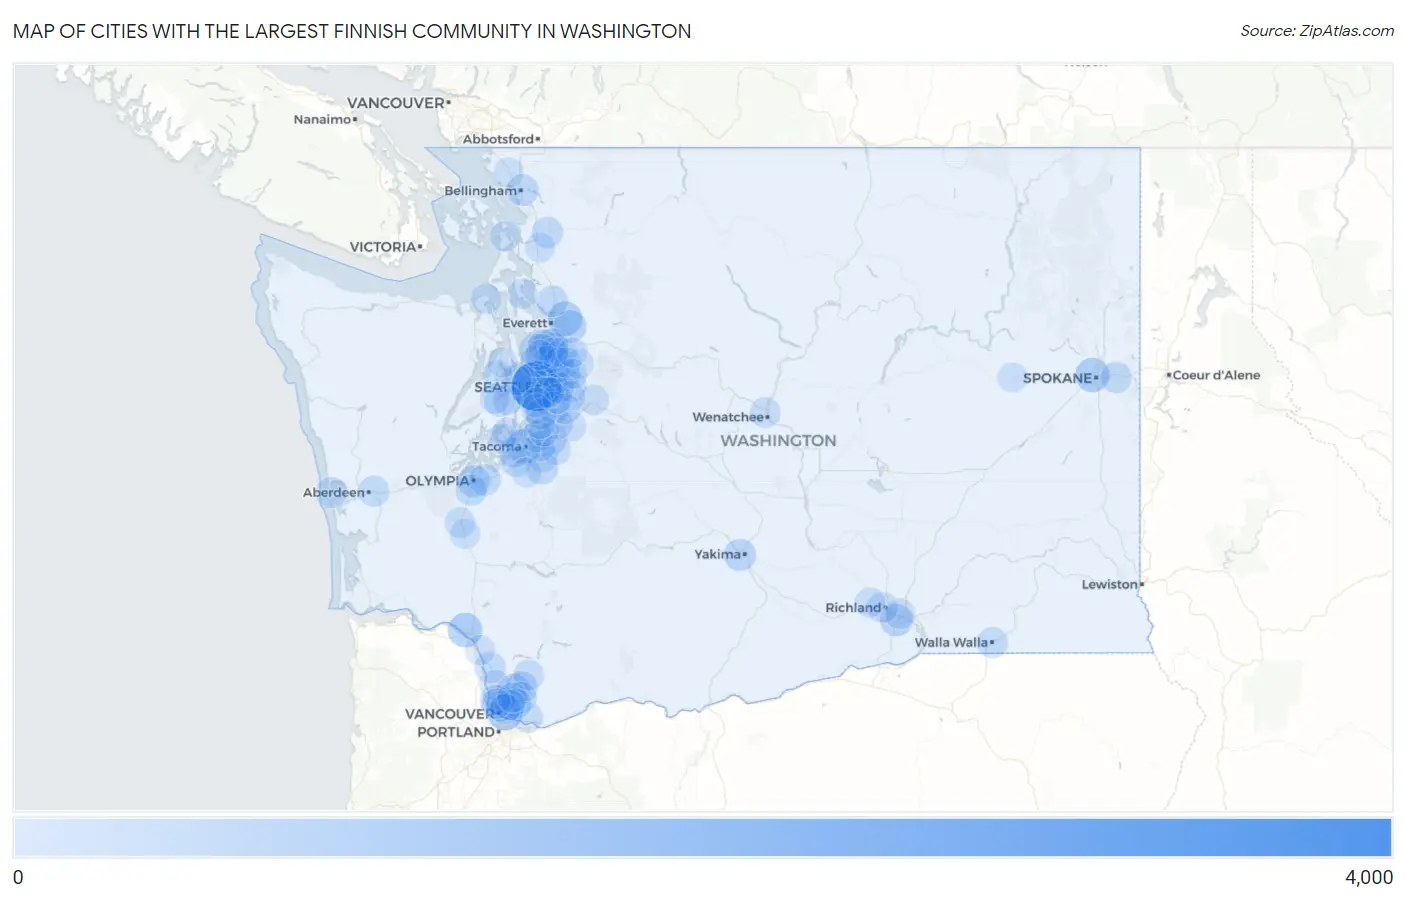
Map of Cities with the Largest Finnish Community in Washington
0
4,000
Cities with the Largest Finnish Community in Washington
| City | Finnish | vs State | vs National | |
| 1. | Seattle | 3,832 | 47,192(8.12%)#1 | 628,742(0.61%)#4 |
| 2. | Vancouver | 1,127 | 47,192(2.39%)#2 | 628,742(0.18%)#25 |
| 3. | Tacoma | 916 | 47,192(1.94%)#3 | 628,742(0.15%)#34 |
| 4. | Spokane | 904 | 47,192(1.92%)#4 | 628,742(0.14%)#37 |
| 5. | Lake Stevens | 894 | 47,192(1.89%)#5 | 628,742(0.14%)#40 |
| 6. | Longview | 890 | 47,192(1.89%)#6 | 628,742(0.14%)#41 |
| 7. | Kirkland | 675 | 47,192(1.43%)#7 | 628,742(0.11%)#73 |
| 8. | Everett | 584 | 47,192(1.24%)#8 | 628,742(0.09%)#94 |
| 9. | Kennewick | 580 | 47,192(1.23%)#9 | 628,742(0.09%)#96 |
| 10. | Battle Ground | 541 | 47,192(1.15%)#10 | 628,742(0.09%)#109 |
| 11. | Olympia | 503 | 47,192(1.07%)#11 | 628,742(0.08%)#122 |
| 12. | Yakima | 495 | 47,192(1.05%)#12 | 628,742(0.08%)#126 |
| 13. | Redmond | 476 | 47,192(1.01%)#13 | 628,742(0.08%)#140 |
| 14. | Venersborg | 475 | 47,192(1.01%)#14 | 628,742(0.08%)#141 |
| 15. | Edmonds | 428 | 47,192(0.91%)#15 | 628,742(0.07%)#159 |
| 16. | Auburn | 418 | 47,192(0.89%)#16 | 628,742(0.07%)#163 |
| 17. | Martha Lake | 417 | 47,192(0.88%)#17 | 628,742(0.07%)#164 |
| 18. | Bellingham | 401 | 47,192(0.85%)#18 | 628,742(0.06%)#176 |
| 19. | Shoreline | 390 | 47,192(0.83%)#19 | 628,742(0.06%)#188 |
| 20. | Renton | 372 | 47,192(0.79%)#20 | 628,742(0.06%)#196 |
| 21. | South Hill | 347 | 47,192(0.74%)#21 | 628,742(0.06%)#220 |
| 22. | Marysville | 346 | 47,192(0.73%)#22 | 628,742(0.06%)#222 |
| 23. | Lacey | 336 | 47,192(0.71%)#23 | 628,742(0.05%)#228 |
| 24. | Sedro Woolley | 335 | 47,192(0.71%)#24 | 628,742(0.05%)#229 |
| 25. | Spokane Valley | 334 | 47,192(0.71%)#25 | 628,742(0.05%)#230 |
| 26. | Federal Way | 324 | 47,192(0.69%)#26 | 628,742(0.05%)#241 |
| 27. | Tumwater | 320 | 47,192(0.68%)#27 | 628,742(0.05%)#245 |
| 28. | Sammamish | 318 | 47,192(0.67%)#28 | 628,742(0.05%)#248 |
| 29. | Woodland | 314 | 47,192(0.67%)#29 | 628,742(0.05%)#252 |
| 30. | Port Orchard | 296 | 47,192(0.63%)#30 | 628,742(0.05%)#282 |
| 31. | Bellevue | 293 | 47,192(0.62%)#31 | 628,742(0.05%)#284 |
| 32. | Walla Walla | 285 | 47,192(0.60%)#32 | 628,742(0.05%)#297 |
| 33. | Hockinson | 281 | 47,192(0.60%)#33 | 628,742(0.04%)#303 |
| 34. | Aberdeen | 269 | 47,192(0.57%)#34 | 628,742(0.04%)#321 |
| 35. | Fairwood Cdp Spokane County | 251 | 47,192(0.53%)#35 | 628,742(0.04%)#352 |
| 36. | Mill Creek | 243 | 47,192(0.51%)#36 | 628,742(0.04%)#368 |
| 37. | Ocean Shores | 240 | 47,192(0.51%)#37 | 628,742(0.04%)#374 |
| 38. | Bainbridge Island | 239 | 47,192(0.51%)#38 | 628,742(0.04%)#375 |
| 39. | Kent | 237 | 47,192(0.50%)#39 | 628,742(0.04%)#379 |
| 40. | Richland | 230 | 47,192(0.49%)#40 | 628,742(0.04%)#394 |
| 41. | Camas | 223 | 47,192(0.47%)#41 | 628,742(0.04%)#406 |
| 42. | Bothell | 222 | 47,192(0.47%)#42 | 628,742(0.04%)#409 |
| 43. | Seatac | 221 | 47,192(0.47%)#43 | 628,742(0.04%)#412 |
| 44. | North Lynnwood | 212 | 47,192(0.45%)#44 | 628,742(0.03%)#432 |
| 45. | Lakewood | 207 | 47,192(0.44%)#45 | 628,742(0.03%)#447 |
| 46. | Grand Mound | 205 | 47,192(0.43%)#46 | 628,742(0.03%)#451 |
| 47. | Wenatchee | 204 | 47,192(0.43%)#47 | 628,742(0.03%)#453 |
| 48. | Hazel Dell | 200 | 47,192(0.42%)#48 | 628,742(0.03%)#463 |
| 49. | Yacolt | 189 | 47,192(0.40%)#49 | 628,742(0.03%)#508 |
| 50. | Snoqualmie | 183 | 47,192(0.39%)#50 | 628,742(0.03%)#530 |
| 51. | Issaquah | 180 | 47,192(0.38%)#51 | 628,742(0.03%)#539 |
| 52. | East Renton Highlands | 176 | 47,192(0.37%)#52 | 628,742(0.03%)#551 |
| 53. | Burien | 164 | 47,192(0.35%)#53 | 628,742(0.03%)#598 |
| 54. | University Place | 164 | 47,192(0.35%)#54 | 628,742(0.03%)#600 |
| 55. | Salmon Creek | 163 | 47,192(0.35%)#55 | 628,742(0.03%)#604 |
| 56. | Ridgefield | 163 | 47,192(0.35%)#56 | 628,742(0.03%)#606 |
| 57. | Orchards | 158 | 47,192(0.33%)#57 | 628,742(0.03%)#620 |
| 58. | Parkwood | 152 | 47,192(0.32%)#58 | 628,742(0.02%)#644 |
| 59. | Pasco | 147 | 47,192(0.31%)#59 | 628,742(0.02%)#658 |
| 60. | Five Corners | 146 | 47,192(0.31%)#60 | 628,742(0.02%)#667 |
| 61. | Camano | 146 | 47,192(0.31%)#61 | 628,742(0.02%)#668 |
| 62. | Felida | 145 | 47,192(0.31%)#62 | 628,742(0.02%)#673 |
| 63. | Silverdale | 144 | 47,192(0.31%)#63 | 628,742(0.02%)#678 |
| 64. | Bremerton | 137 | 47,192(0.29%)#64 | 628,742(0.02%)#712 |
| 65. | Minnehaha | 131 | 47,192(0.28%)#65 | 628,742(0.02%)#748 |
| 66. | West Richland | 129 | 47,192(0.27%)#66 | 628,742(0.02%)#762 |
| 67. | Puyallup | 126 | 47,192(0.27%)#67 | 628,742(0.02%)#781 |
| 68. | Mill Creek East | 126 | 47,192(0.27%)#68 | 628,742(0.02%)#786 |
| 69. | Gig Harbor | 126 | 47,192(0.27%)#69 | 628,742(0.02%)#787 |
| 70. | Newcastle | 125 | 47,192(0.26%)#70 | 628,742(0.02%)#796 |
| 71. | Port Townsend | 123 | 47,192(0.26%)#71 | 628,742(0.02%)#808 |
| 72. | Mercer Island | 121 | 47,192(0.26%)#72 | 628,742(0.02%)#824 |
| 73. | Anacortes | 119 | 47,192(0.25%)#73 | 628,742(0.02%)#837 |
| 74. | Artondale | 119 | 47,192(0.25%)#74 | 628,742(0.02%)#838 |
| 75. | Kenmore | 117 | 47,192(0.25%)#75 | 628,742(0.02%)#851 |
| 76. | Milton | 116 | 47,192(0.25%)#76 | 628,742(0.02%)#859 |
| 77. | Beacon Hill | 115 | 47,192(0.24%)#77 | 628,742(0.02%)#868 |
| 78. | Centralia | 114 | 47,192(0.24%)#78 | 628,742(0.02%)#876 |
| 79. | Lake Shore | 109 | 47,192(0.23%)#79 | 628,742(0.02%)#917 |
| 80. | Brush Prairie | 109 | 47,192(0.23%)#80 | 628,742(0.02%)#919 |
| 81. | Lynnwood | 108 | 47,192(0.23%)#81 | 628,742(0.02%)#921 |
| 82. | Maple Valley | 107 | 47,192(0.23%)#82 | 628,742(0.02%)#931 |
| 83. | Ferndale | 105 | 47,192(0.22%)#83 | 628,742(0.02%)#952 |
| 84. | Lakeland North | 105 | 47,192(0.22%)#84 | 628,742(0.02%)#953 |
| 85. | Spanaway | 103 | 47,192(0.22%)#85 | 628,742(0.02%)#971 |
| 86. | Lake Tapps | 102 | 47,192(0.22%)#86 | 628,742(0.02%)#982 |
| 87. | Davenport | 102 | 47,192(0.22%)#87 | 628,742(0.02%)#983 |
| 88. | Mount Vernon | 100 | 47,192(0.21%)#88 | 628,742(0.02%)#997 |
| 89. | Duvall | 98 | 47,192(0.21%)#89 | 628,742(0.02%)#1,015 |
| 90. | Kalama | 98 | 47,192(0.21%)#90 | 628,742(0.02%)#1,017 |
| 91. | Woodinville | 97 | 47,192(0.21%)#91 | 628,742(0.02%)#1,029 |
| 92. | Maltby | 97 | 47,192(0.21%)#92 | 628,742(0.02%)#1,031 |
| 93. | Cottage Lake | 94 | 47,192(0.20%)#93 | 628,742(0.01%)#1,060 |
| 94. | Union Hill Novelty Hill | 94 | 47,192(0.20%)#94 | 628,742(0.01%)#1,061 |
| 95. | Bothell East | 94 | 47,192(0.20%)#95 | 628,742(0.01%)#1,065 |
| 96. | Poulsbo | 94 | 47,192(0.20%)#96 | 628,742(0.01%)#1,067 |
| 97. | White Center | 93 | 47,192(0.20%)#97 | 628,742(0.01%)#1,084 |
| 98. | High Bridge | 93 | 47,192(0.20%)#98 | 628,742(0.01%)#1,087 |
| 99. | Des Moines | 92 | 47,192(0.19%)#99 | 628,742(0.01%)#1,091 |
| 100. | Mountlake Terrace | 90 | 47,192(0.19%)#100 | 628,742(0.01%)#1,115 |
Common Questions
What are the Top 10 Cities with the Largest Finnish Community in Washington?
Top 10 Cities with the Largest Finnish Community in Washington are:
#1
3,832
#2
1,127
#3
916
#4
904
#5
894
#6
890
#7
675
#8
584
#9
580
#10
541
What city has the Largest Finnish Community in Washington?
Seattle has the Largest Finnish Community in Washington with 3,832.
What is the Total Finnish Population in the State of Washington?
Total Finnish Population in Washington is 47,192.
What is the Total Finnish Population in the United States?
Total Finnish Population in the United States is 628,742.