Cities with the Highest Percentage of Immigrants from Israel in Washington
RELATED REPORTS & OPTIONS
Israel
Washington
Compare Cities
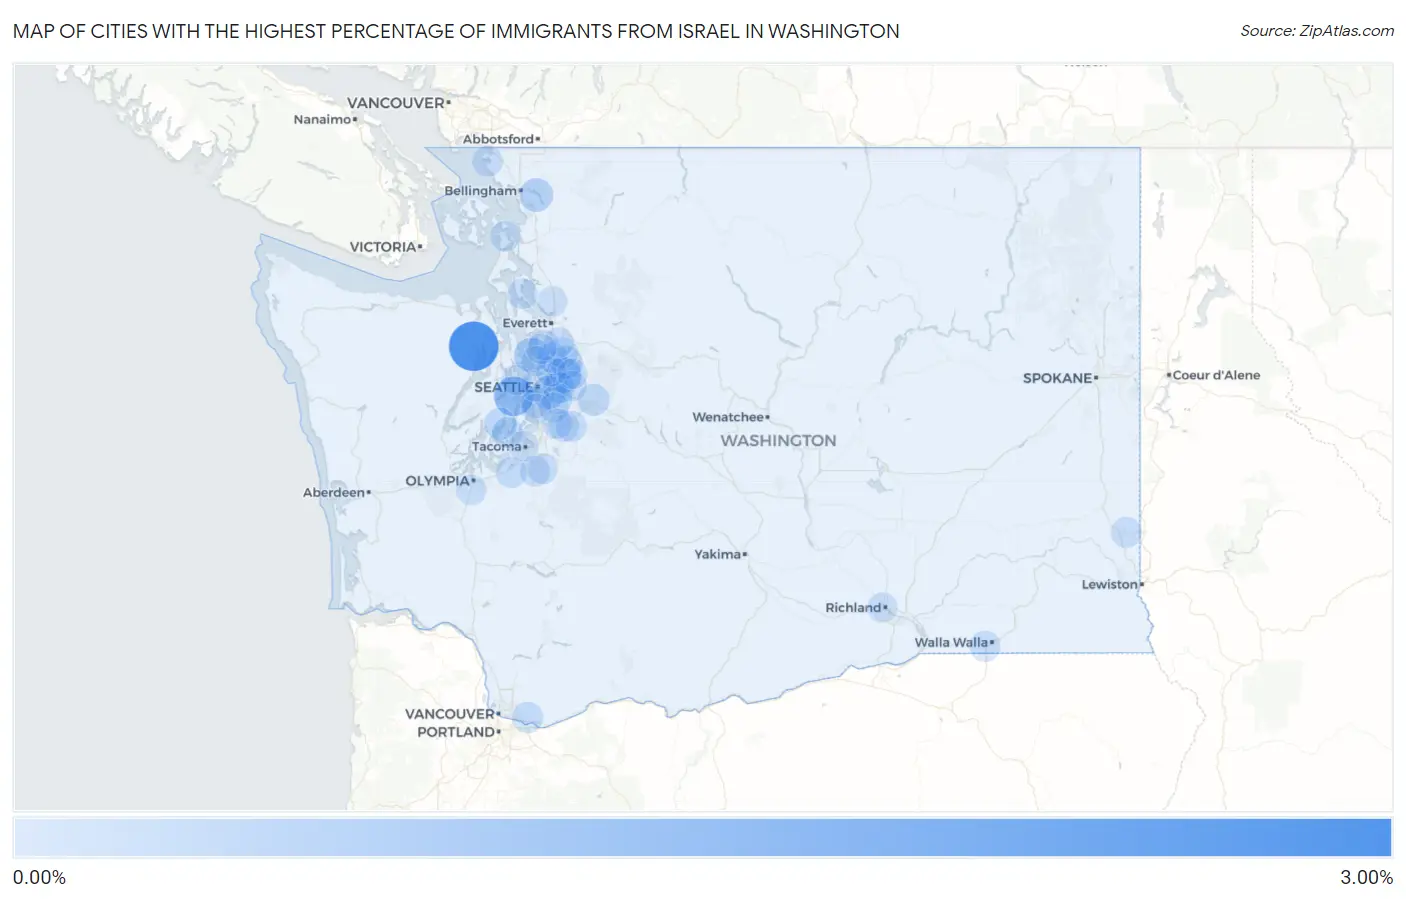
Map of Cities with the Highest Percentage of Immigrants from Israel in Washington
0.00%
3.00%
Cities with the Highest Percentage of Immigrants from Israel in Washington
| City | Israel | vs State | vs National | |
| 1. | Quilcene | 2.95% | 0.033%(+2.92)#-1 | 0.042%(+2.91)#0 |
| 2. | Manchester | 1.39% | 0.033%(+1.36)#0 | 0.042%(+1.35)#1 |
| 3. | Redmond | 0.77% | 0.033%(+0.736)#15 | 0.042%(+0.727)#181 |
| 4. | Woodway | 0.63% | 0.033%(+0.594)#16 | 0.042%(+0.584)#182 |
| 5. | Sudden Valley | 0.48% | 0.033%(+0.446)#17 | 0.042%(+0.437)#183 |
| 6. | Mercer Island | 0.48% | 0.033%(+0.443)#18 | 0.042%(+0.433)#184 |
| 7. | Cottage Lake | 0.39% | 0.033%(+0.355)#19 | 0.042%(+0.345)#185 |
| 8. | Snoqualmie | 0.26% | 0.033%(+0.229)#20 | 0.042%(+0.220)#186 |
| 9. | Wauna | 0.26% | 0.033%(+0.223)#21 | 0.042%(+0.214)#187 |
| 10. | Bellevue | 0.20% | 0.033%(+0.171)#22 | 0.042%(+0.162)#188 |
| 11. | Maltby | 0.17% | 0.033%(+0.135)#23 | 0.042%(+0.125)#189 |
| 12. | Camas | 0.16% | 0.033%(+0.130)#24 | 0.042%(+0.121)#190 |
| 13. | Fort Lewis | 0.13% | 0.033%(+0.094)#25 | 0.042%(+0.084)#191 |
| 14. | Gig Harbor | 0.13% | 0.033%(+0.093)#26 | 0.042%(+0.084)#192 |
| 15. | White Center | 0.12% | 0.033%(+0.090)#27 | 0.042%(+0.081)#193 |
| 16. | Maple Valley | 0.12% | 0.033%(+0.086)#28 | 0.042%(+0.076)#194 |
| 17. | Sammamish | 0.11% | 0.033%(+0.082)#29 | 0.042%(+0.072)#299 |
| 18. | College Place | 0.11% | 0.033%(+0.080)#30 | 0.042%(+0.070)#300 |
| 19. | Birch Bay | 0.11% | 0.033%(+0.075)#31 | 0.042%(+0.066)#301 |
| 20. | Covington | 0.096% | 0.033%(+0.063)#32 | 0.042%(+0.054)#302 |
| 21. | Pullman | 0.094% | 0.033%(+0.061)#33 | 0.042%(+0.052)#303 |
| 22. | Seattle | 0.074% | 0.033%(+0.041)#34 | 0.042%(+0.032)#355 |
| 23. | Bothell | 0.071% | 0.033%(+0.038)#35 | 0.042%(+0.029)#356 |
| 24. | Frederickson | 0.065% | 0.033%(+0.032)#36 | 0.042%(+0.023)#357 |
| 25. | Newcastle | 0.062% | 0.033%(+0.029)#37 | 0.042%(+0.020)#358 |
| 26. | Kirkland | 0.060% | 0.033%(+0.027)#38 | 0.042%(+0.018)#359 |
| 27. | North Lynnwood | 0.054% | 0.033%(+0.021)#39 | 0.042%(+0.012)#360 |
| 28. | Camano | 0.040% | 0.033%(+0.007)#40 | 0.042%(-0.002)#361 |
| 29. | South Hill | 0.037% | 0.033%(+0.004)#41 | 0.042%(-0.005)#362 |
| 30. | Tumwater | 0.035% | 0.033%(+0.003)#42 | 0.042%(-0.007)#363 |
| 31. | Union Hill Novelty Hill | 0.035% | 0.033%(+0.002)#43 | 0.042%(-0.007)#364 |
| 32. | Bainbridge Island | 0.032% | 0.033%(-0.000)#44 | 0.042%(-0.010)#365 |
| 33. | Shoreline | 0.027% | 0.033%(-0.005)#45 | 0.042%(-0.015)#366 |
| 34. | Silver Firs | 0.027% | 0.033%(-0.006)#46 | 0.042%(-0.015)#367 |
| 35. | Burien | 0.023% | 0.033%(-0.009)#47 | 0.042%(-0.019)#368 |
| 36. | Richland | 0.023% | 0.033%(-0.010)#48 | 0.042%(-0.019)#369 |
| 37. | Tacoma | 0.017% | 0.033%(-0.015)#49 | 0.042%(-0.025)#370 |
| 38. | Lynnwood | 0.015% | 0.033%(-0.018)#50 | 0.042%(-0.027)#371 |
| 39. | Renton | 0.012% | 0.033%(-0.020)#51 | 0.042%(-0.030)#372 |
| 40. | Anacortes | 0.011% | 0.033%(-0.021)#52 | 0.042%(-0.031)#373 |
| 41. | Marysville | 0.0099% | 0.033%(-0.023)#53 | 0.042%(-0.032)#374 |
| 42. | Kent | 0.0059% | 0.033%(-0.027)#54 | 0.042%(-0.036)#375 |
Common Questions
What are the Top 10 Cities with the Highest Percentage of Immigrants from Israel in Washington?
Top 10 Cities with the Highest Percentage of Immigrants from Israel in Washington are:
#1
2.95%
#2
1.39%
#3
0.77%
#4
0.63%
#5
0.48%
#6
0.48%
#7
0.39%
#8
0.26%
#9
0.26%
#10
0.20%
What city has the Highest Percentage of Immigrants from Israel in Washington?
Quilcene has the Highest Percentage of Immigrants from Israel in Washington with 2.95%.
What is the Percentage of Immigrants from Israel in the State of Washington?
Percentage of Immigrants from Israel in Washington is 0.033%.
What is the Percentage of Immigrants from Israel in the United States?
Percentage of Immigrants from Israel in the United States is 0.042%.