Cities with the Largest Native Hawaiian Community in Washington
RELATED REPORTS & OPTIONS
Native Hawaiian
Washington
Compare Cities
Map of Cities with the Largest Native Hawaiian Community in Washington
0
2,500
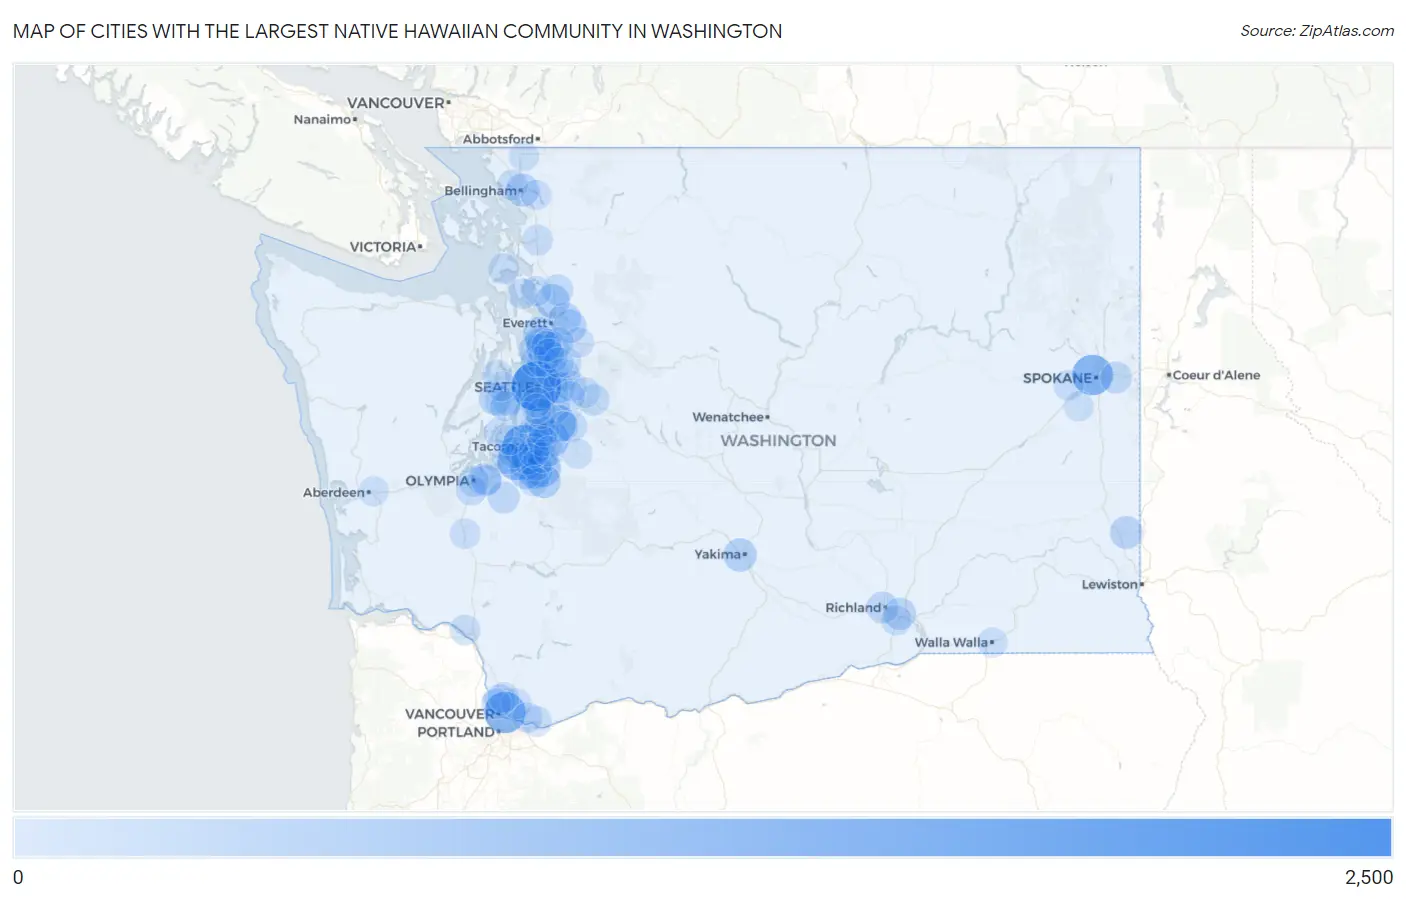
Cities with the Largest Native Hawaiian Community in Washington
| City | Native Hawaiian | vs State | vs National | |
| 1. | Seattle | 2,055 | 30,431(6.75%)#1 | 654,614(0.31%)#53 |
| 2. | Tacoma | 1,316 | 30,431(4.32%)#2 | 654,614(0.20%)#80 |
| 3. | Vancouver | 1,195 | 30,431(3.93%)#3 | 654,614(0.18%)#87 |
| 4. | Spokane | 1,113 | 30,431(3.66%)#4 | 654,614(0.17%)#95 |
| 5. | Lakewood | 851 | 30,431(2.80%)#5 | 654,614(0.13%)#111 |
| 6. | Kent | 786 | 30,431(2.58%)#6 | 654,614(0.12%)#119 |
| 7. | South Hill | 700 | 30,431(2.30%)#7 | 654,614(0.11%)#132 |
| 8. | Auburn | 673 | 30,431(2.21%)#8 | 654,614(0.10%)#137 |
| 9. | Frederickson | 530 | 30,431(1.74%)#9 | 654,614(0.08%)#172 |
| 10. | Federal Way | 497 | 30,431(1.63%)#10 | 654,614(0.08%)#187 |
| 11. | Marysville | 464 | 30,431(1.52%)#11 | 654,614(0.07%)#202 |
| 12. | North Lynnwood | 444 | 30,431(1.46%)#12 | 654,614(0.07%)#215 |
| 13. | Mukilteo | 414 | 30,431(1.36%)#13 | 654,614(0.06%)#231 |
| 14. | Graham | 410 | 30,431(1.35%)#14 | 654,614(0.06%)#233 |
| 15. | Parkland | 402 | 30,431(1.32%)#15 | 654,614(0.06%)#236 |
| 16. | Yakima | 381 | 30,431(1.25%)#16 | 654,614(0.06%)#250 |
| 17. | Fairwood Cdp King County | 374 | 30,431(1.23%)#17 | 654,614(0.06%)#255 |
| 18. | Lacey | 363 | 30,431(1.19%)#18 | 654,614(0.06%)#263 |
| 19. | Everett | 360 | 30,431(1.18%)#19 | 654,614(0.05%)#265 |
| 20. | Bellingham | 356 | 30,431(1.17%)#20 | 654,614(0.05%)#271 |
| 21. | Spanaway | 354 | 30,431(1.16%)#21 | 654,614(0.05%)#274 |
| 22. | Pullman | 318 | 30,431(1.04%)#22 | 654,614(0.05%)#297 |
| 23. | Renton | 308 | 30,431(1.01%)#23 | 654,614(0.05%)#303 |
| 24. | Edmonds | 308 | 30,431(1.01%)#24 | 654,614(0.05%)#304 |
| 25. | Lake Stevens | 306 | 30,431(1.01%)#25 | 654,614(0.05%)#305 |
| 26. | Bremerton | 297 | 30,431(0.98%)#26 | 654,614(0.05%)#311 |
| 27. | Pasco | 258 | 30,431(0.85%)#27 | 654,614(0.04%)#340 |
| 28. | Kirkland | 246 | 30,431(0.81%)#28 | 654,614(0.04%)#352 |
| 29. | Redmond | 242 | 30,431(0.80%)#29 | 654,614(0.04%)#358 |
| 30. | Richland | 238 | 30,431(0.78%)#30 | 654,614(0.04%)#365 |
| 31. | Bellevue | 227 | 30,431(0.75%)#31 | 654,614(0.03%)#385 |
| 32. | Martha Lake | 221 | 30,431(0.73%)#32 | 654,614(0.03%)#393 |
| 33. | Yelm | 215 | 30,431(0.71%)#33 | 654,614(0.03%)#404 |
| 34. | Spokane Valley | 211 | 30,431(0.69%)#34 | 654,614(0.03%)#413 |
| 35. | Midland | 207 | 30,431(0.68%)#35 | 654,614(0.03%)#419 |
| 36. | Maple Valley | 197 | 30,431(0.65%)#36 | 654,614(0.03%)#433 |
| 37. | Snoqualmie | 188 | 30,431(0.62%)#37 | 654,614(0.03%)#447 |
| 38. | Shoreline | 177 | 30,431(0.58%)#38 | 654,614(0.03%)#467 |
| 39. | Mill Creek East | 175 | 30,431(0.58%)#39 | 654,614(0.03%)#471 |
| 40. | Lake Forest Park | 175 | 30,431(0.58%)#40 | 654,614(0.03%)#472 |
| 41. | Arlington | 169 | 30,431(0.56%)#41 | 654,614(0.03%)#487 |
| 42. | Fife | 165 | 30,431(0.54%)#42 | 654,614(0.03%)#498 |
| 43. | University Place | 163 | 30,431(0.54%)#43 | 654,614(0.02%)#499 |
| 44. | Parkwood | 158 | 30,431(0.52%)#44 | 654,614(0.02%)#518 |
| 45. | Olympia | 153 | 30,431(0.50%)#45 | 654,614(0.02%)#527 |
| 46. | Salmon Creek | 146 | 30,431(0.48%)#46 | 654,614(0.02%)#550 |
| 47. | Vashon | 144 | 30,431(0.47%)#47 | 654,614(0.02%)#563 |
| 48. | Sammamish | 140 | 30,431(0.46%)#48 | 654,614(0.02%)#575 |
| 49. | Oak Harbor | 140 | 30,431(0.46%)#49 | 654,614(0.02%)#577 |
| 50. | Burlington | 134 | 30,431(0.44%)#50 | 654,614(0.02%)#595 |
| 51. | Washougal | 133 | 30,431(0.44%)#51 | 654,614(0.02%)#601 |
| 52. | Tumwater | 131 | 30,431(0.43%)#52 | 654,614(0.02%)#609 |
| 53. | Port Orchard | 131 | 30,431(0.43%)#53 | 654,614(0.02%)#611 |
| 54. | Steilacoom | 128 | 30,431(0.42%)#54 | 654,614(0.02%)#624 |
| 55. | Marietta Alderwood | 126 | 30,431(0.41%)#55 | 654,614(0.02%)#632 |
| 56. | Summit View | 125 | 30,431(0.41%)#56 | 654,614(0.02%)#641 |
| 57. | Fairchild Afb | 122 | 30,431(0.40%)#57 | 654,614(0.02%)#652 |
| 58. | Puyallup | 116 | 30,431(0.38%)#58 | 654,614(0.02%)#673 |
| 59. | Kennewick | 113 | 30,431(0.37%)#59 | 654,614(0.02%)#688 |
| 60. | Cottage Lake | 111 | 30,431(0.36%)#60 | 654,614(0.02%)#697 |
| 61. | Longview | 110 | 30,431(0.36%)#61 | 654,614(0.02%)#701 |
| 62. | Lynnwood | 104 | 30,431(0.34%)#62 | 654,614(0.02%)#734 |
| 63. | Waller | 103 | 30,431(0.34%)#63 | 654,614(0.02%)#739 |
| 64. | Orchards | 102 | 30,431(0.34%)#64 | 654,614(0.02%)#747 |
| 65. | Bothell | 101 | 30,431(0.33%)#65 | 654,614(0.02%)#750 |
| 66. | Des Moines | 99 | 30,431(0.33%)#66 | 654,614(0.02%)#765 |
| 67. | Silverdale | 99 | 30,431(0.33%)#67 | 654,614(0.02%)#767 |
| 68. | Tanglewilde | 97 | 30,431(0.32%)#68 | 654,614(0.01%)#779 |
| 69. | Mount Vista | 96 | 30,431(0.32%)#69 | 654,614(0.01%)#785 |
| 70. | Lakeland North | 93 | 30,431(0.31%)#70 | 654,614(0.01%)#809 |
| 71. | Warm Beach | 91 | 30,431(0.30%)#71 | 654,614(0.01%)#822 |
| 72. | Monroe | 89 | 30,431(0.29%)#72 | 654,614(0.01%)#838 |
| 73. | Centralia | 89 | 30,431(0.29%)#73 | 654,614(0.01%)#840 |
| 74. | Fall City | 88 | 30,431(0.29%)#74 | 654,614(0.01%)#847 |
| 75. | Picnic Point | 87 | 30,431(0.29%)#75 | 654,614(0.01%)#851 |
| 76. | Sudden Valley | 85 | 30,431(0.28%)#76 | 654,614(0.01%)#868 |
| 77. | Camano | 84 | 30,431(0.28%)#77 | 654,614(0.01%)#875 |
| 78. | Silver Firs | 83 | 30,431(0.27%)#78 | 654,614(0.01%)#882 |
| 79. | Seatac | 82 | 30,431(0.27%)#79 | 654,614(0.01%)#887 |
| 80. | Burien | 79 | 30,431(0.26%)#80 | 654,614(0.01%)#915 |
| 81. | Lake Shore | 77 | 30,431(0.25%)#81 | 654,614(0.01%)#936 |
| 82. | Larch Way | 77 | 30,431(0.25%)#82 | 654,614(0.01%)#937 |
| 83. | Covington | 76 | 30,431(0.25%)#83 | 654,614(0.01%)#944 |
| 84. | Lynden | 76 | 30,431(0.25%)#84 | 654,614(0.01%)#945 |
| 85. | Lakeland South | 76 | 30,431(0.25%)#85 | 654,614(0.01%)#946 |
| 86. | Raft Island | 76 | 30,431(0.25%)#86 | 654,614(0.01%)#948 |
| 87. | Camas | 75 | 30,431(0.25%)#87 | 654,614(0.01%)#951 |
| 88. | Sumner | 74 | 30,431(0.24%)#88 | 654,614(0.01%)#960 |
| 89. | Bethel | 73 | 30,431(0.24%)#89 | 654,614(0.01%)#974 |
| 90. | Tracyton | 67 | 30,431(0.22%)#90 | 654,614(0.01%)#1,024 |
| 91. | Aberdeen | 66 | 30,431(0.22%)#91 | 654,614(0.01%)#1,032 |
| 92. | Bothell West | 65 | 30,431(0.21%)#92 | 654,614(0.01%)#1,044 |
| 93. | Elk Plain | 65 | 30,431(0.21%)#93 | 654,614(0.01%)#1,045 |
| 94. | Walla Walla | 64 | 30,431(0.21%)#94 | 654,614(0.01%)#1,059 |
| 95. | Woodinville | 62 | 30,431(0.20%)#95 | 654,614(0.01%)#1,087 |
| 96. | Wollochet | 62 | 30,431(0.20%)#96 | 654,614(0.01%)#1,090 |
| 97. | Cheney | 61 | 30,431(0.20%)#97 | 654,614(0.01%)#1,097 |
| 98. | Enumclaw | 61 | 30,431(0.20%)#98 | 654,614(0.01%)#1,098 |
| 99. | Issaquah | 57 | 30,431(0.19%)#99 | 654,614(0.01%)#1,138 |
| 100. | White Center | 57 | 30,431(0.19%)#100 | 654,614(0.01%)#1,146 |
Common Questions
What are the Top 10 Cities with the Largest Native Hawaiian Community in Washington?
Top 10 Cities with the Largest Native Hawaiian Community in Washington are:
#1
2,055
#2
1,316
#3
1,195
#4
1,113
#5
851
#6
786
#7
700
#8
673
#9
530
#10
497
What city has the Largest Native Hawaiian Community in Washington?
Seattle has the Largest Native Hawaiian Community in Washington with 2,055.
What is the Total Native Hawaiian Population in the State of Washington?
Total Native Hawaiian Population in Washington is 30,431.
What is the Total Native Hawaiian Population in the United States?
Total Native Hawaiian Population in the United States is 654,614.