Cities with the Highest Percentage of Navajo Population in Washington
RELATED REPORTS & OPTIONS
Navajo
Washington
Compare Cities
Map of Cities with the Highest Percentage of Navajo Population in Washington
0.00%
15.00%
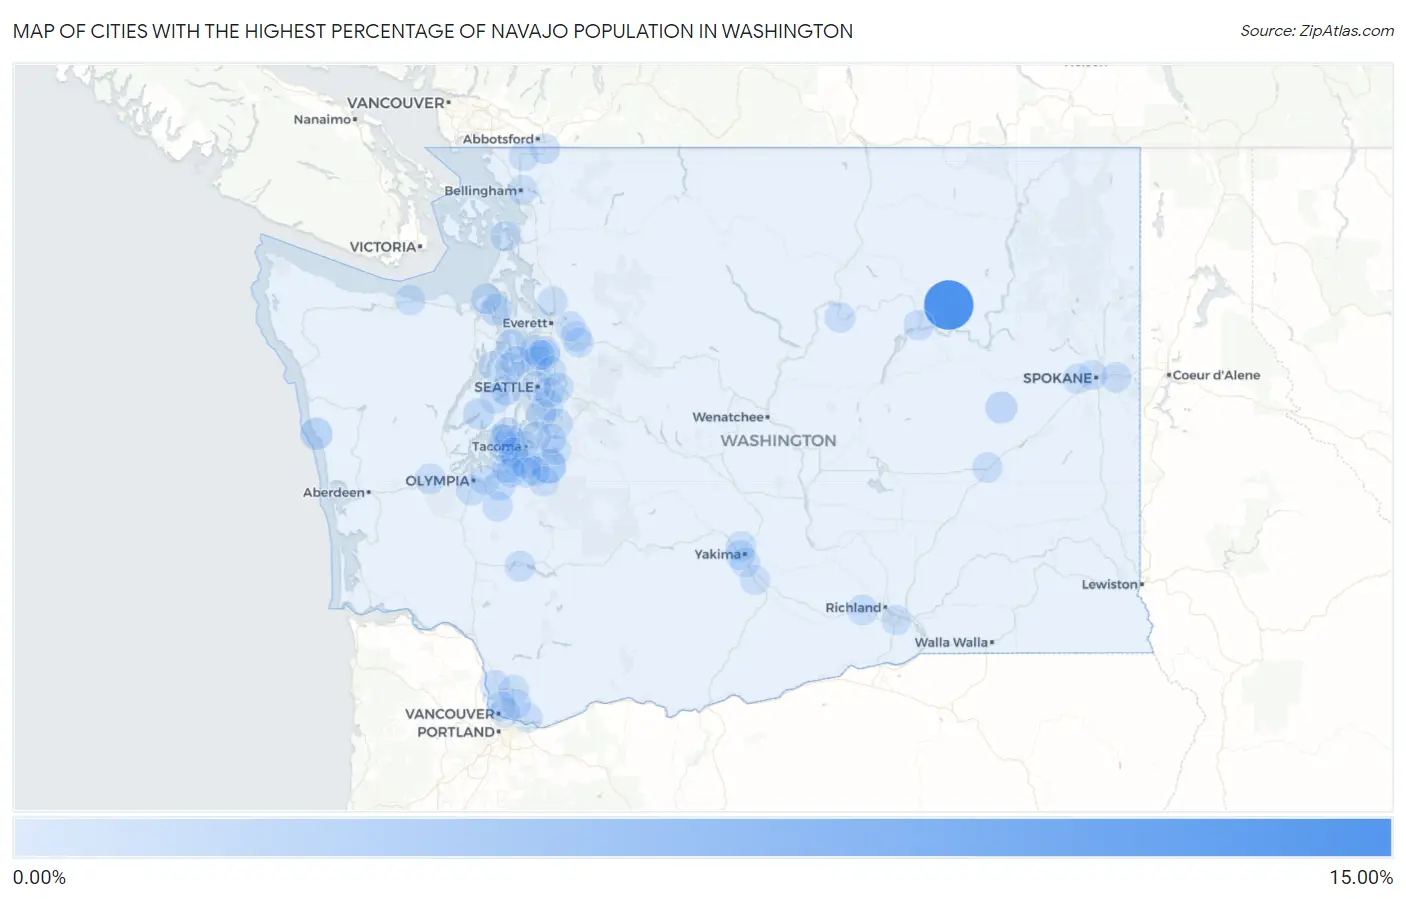
Cities with the Highest Percentage of Navajo Population in Washington
| City | Navajo | vs State | vs National | |
| 1. | Keller | 13.28% | 0.055% (+13.2)#1 | 0.12% (+13.2)#149 |
| 2. | Mcmillin | 3.02% | 0.055% (+2.96)#2 | 0.12% (+2.89)#253 |
| 3. | Taholah | 1.46% | 0.055% (+1.40)#3 | 0.12% (+1.33)#397 |
| 4. | Marrowstone | 1.13% | 0.055% (+1.08)#4 | 0.12% (+1.01)#455 |
| 5. | Harrington | 1.11% | 0.055% (+1.06)#5 | 0.12% (+0.987)#467 |
| 6. | Port Gamble Tribal Community | 0.82% | 0.055% (+0.769)#6 | 0.12% (+0.700)#556 |
| 7. | Belfair | 0.77% | 0.055% (+0.712)#7 | 0.12% (+0.643)#574 |
| 8. | Nisqually Indian Community | 0.67% | 0.055% (+0.620)#8 | 0.12% (+0.551)#617 |
| 9. | Bryn Mawr Skyway | 0.64% | 0.055% (+0.589)#9 | 0.12% (+0.520)#641 |
| 10. | Mossyrock | 0.44% | 0.055% (+0.385)#10 | 0.12% (+0.315)#765 |
| 11. | Enetai | 0.43% | 0.055% (+0.374)#11 | 0.12% (+0.304)#774 |
| 12. | North Fort Lewis | 0.42% | 0.055% (+0.361)#12 | 0.12% (+0.292)#789 |
| 13. | Port Townsend | 0.41% | 0.055% (+0.359)#13 | 0.12% (+0.290)#791 |
| 14. | Tumwater | 0.36% | 0.055% (+0.305)#14 | 0.12% (+0.236)#850 |
| 15. | Benton City | 0.34% | 0.055% (+0.289)#15 | 0.12% (+0.219)#876 |
| 16. | Tacoma | 0.33% | 0.055% (+0.273)#16 | 0.12% (+0.204)#890 |
| 17. | Port Angeles | 0.30% | 0.055% (+0.245)#17 | 0.12% (+0.176)#928 |
| 18. | Coulee Dam | 0.30% | 0.055% (+0.245)#18 | 0.12% (+0.176)#929 |
| 19. | Mccleary | 0.29% | 0.055% (+0.234)#19 | 0.12% (+0.165)#949 |
| 20. | Fox Island | 0.25% | 0.055% (+0.192)#20 | 0.12% (+0.123)#1,023 |
| 21. | Lakewood | 0.24% | 0.055% (+0.185)#21 | 0.12% (+0.116)#1,039 |
| 22. | Sumas | 0.21% | 0.055% (+0.160)#22 | 0.12% (+0.091)#1,092 |
| 23. | Bridgeport | 0.21% | 0.055% (+0.152)#23 | 0.12% (+0.083)#1,107 |
| 24. | Bangor Base | 0.20% | 0.055% (+0.144)#24 | 0.12% (+0.075)#1,121 |
| 25. | Spokane Valley | 0.19% | 0.055% (+0.140)#25 | 0.12% (+0.071)#1,131 |
| 26. | Rainier | 0.18% | 0.055% (+0.130)#26 | 0.12% (+0.061)#1,152 |
| 27. | Gig Harbor | 0.18% | 0.055% (+0.130)#27 | 0.12% (+0.061)#1,153 |
| 28. | Chain Lake | 0.18% | 0.055% (+0.121)#28 | 0.12% (+0.052)#1,176 |
| 29. | Bremerton | 0.17% | 0.055% (+0.118)#29 | 0.12% (+0.049)#1,180 |
| 30. | Tehaleh | 0.17% | 0.055% (+0.117)#30 | 0.12% (+0.047)#1,193 |
| 31. | Wollochet | 0.16% | 0.055% (+0.110)#31 | 0.12% (+0.041)#1,211 |
| 32. | Seatac | 0.16% | 0.055% (+0.110)#32 | 0.12% (+0.041)#1,212 |
| 33. | Shoreline | 0.16% | 0.055% (+0.106)#33 | 0.12% (+0.037)#1,228 |
| 34. | Selah | 0.16% | 0.055% (+0.104)#34 | 0.12% (+0.035)#1,231 |
| 35. | Kent | 0.16% | 0.055% (+0.103)#35 | 0.12% (+0.034)#1,233 |
| 36. | Artondale | 0.15% | 0.055% (+0.097)#36 | 0.12% (+0.028)#1,249 |
| 37. | Indianola | 0.14% | 0.055% (+0.086)#37 | 0.12% (+0.017)#1,282 |
| 38. | Graham | 0.14% | 0.055% (+0.081)#38 | 0.12% (+0.012)#1,303 |
| 39. | Ridgefield | 0.12% | 0.055% (+0.067)#39 | 0.12% (-0.002)#1,354 |
| 40. | Ritzville | 0.12% | 0.055% (+0.061)#40 | 0.12% (-0.008)#1,382 |
| 41. | Airway Heights | 0.11% | 0.055% (+0.059)#41 | 0.12% (-0.010)#1,391 |
| 42. | Wapato | 0.11% | 0.055% (+0.054)#42 | 0.12% (-0.015)#1,415 |
| 43. | Fairwood Cdp Spokane County | 0.11% | 0.055% (+0.053)#43 | 0.12% (-0.016)#1,421 |
| 44. | University Place | 0.089% | 0.055% (+0.035)#44 | 0.12% (-0.034)#1,503 |
| 45. | Lynden | 0.076% | 0.055% (+0.022)#45 | 0.12% (-0.047)#1,571 |
| 46. | Camas | 0.076% | 0.055% (+0.021)#46 | 0.12% (-0.048)#1,579 |
| 47. | Everett | 0.076% | 0.055% (+0.021)#47 | 0.12% (-0.048)#1,580 |
| 48. | Edmonds | 0.075% | 0.055% (+0.020)#48 | 0.12% (-0.049)#1,588 |
| 49. | Bellingham | 0.074% | 0.055% (+0.020)#49 | 0.12% (-0.049)#1,593 |
| 50. | Lake Tapps | 0.074% | 0.055% (+0.019)#50 | 0.12% (-0.050)#1,603 |
| 51. | Spanaway | 0.071% | 0.055% (+0.016)#51 | 0.12% (-0.053)#1,629 |
| 52. | Mercer Island | 0.063% | 0.055% (+0.008)#52 | 0.12% (-0.061)#1,664 |
| 53. | Parkland | 0.061% | 0.055% (+0.006)#53 | 0.12% (-0.063)#1,683 |
| 54. | Federal Way | 0.048% | 0.055% (-0.006)#54 | 0.12% (-0.075)#1,773 |
| 55. | Suquamish | 0.046% | 0.055% (-0.008)#55 | 0.12% (-0.077)#1,787 |
| 56. | Brier | 0.046% | 0.055% (-0.009)#56 | 0.12% (-0.078)#1,791 |
| 57. | Kennewick | 0.042% | 0.055% (-0.013)#57 | 0.12% (-0.082)#1,824 |
| 58. | Alderwood Manor | 0.038% | 0.055% (-0.017)#58 | 0.12% (-0.086)#1,859 |
| 59. | Lacey | 0.037% | 0.055% (-0.017)#59 | 0.12% (-0.086)#1,864 |
| 60. | Fort Lewis | 0.037% | 0.055% (-0.017)#60 | 0.12% (-0.086)#1,868 |
| 61. | Spokane | 0.036% | 0.055% (-0.019)#61 | 0.12% (-0.088)#1,879 |
| 62. | Kirkland | 0.036% | 0.055% (-0.019)#62 | 0.12% (-0.088)#1,884 |
| 63. | Battle Ground | 0.034% | 0.055% (-0.021)#63 | 0.12% (-0.090)#1,910 |
| 64. | Frederickson | 0.032% | 0.055% (-0.022)#64 | 0.12% (-0.091)#1,926 |
| 65. | Vancouver | 0.031% | 0.055% (-0.024)#65 | 0.12% (-0.093)#1,947 |
| 66. | Seattle | 0.031% | 0.055% (-0.024)#66 | 0.12% (-0.093)#1,948 |
| 67. | Orchards | 0.031% | 0.055% (-0.024)#67 | 0.12% (-0.093)#1,950 |
| 68. | Union Gap | 0.031% | 0.055% (-0.024)#68 | 0.12% (-0.093)#1,952 |
| 69. | Monroe | 0.031% | 0.055% (-0.024)#69 | 0.12% (-0.093)#1,953 |
| 70. | Auburn | 0.030% | 0.055% (-0.024)#70 | 0.12% (-0.093)#1,956 |
| 71. | Marysville | 0.030% | 0.055% (-0.025)#71 | 0.12% (-0.094)#1,963 |
| 72. | Anacortes | 0.028% | 0.055% (-0.026)#72 | 0.12% (-0.095)#1,985 |
| 73. | Mountlake Terrace | 0.019% | 0.055% (-0.036)#73 | 0.12% (-0.105)#2,103 |
| 74. | Bellevue | 0.0086% | 0.055% (-0.046)#74 | 0.12% (-0.115)#2,233 |
| 75. | Yakima | 0.0052% | 0.055% (-0.049)#75 | 0.12% (-0.118)#2,292 |
| 76. | Hazel Dell | 0.0044% | 0.055% (-0.050)#76 | 0.12% (-0.119)#2,302 |
Common Questions
What are the Top 10 Cities with the Highest Percentage of Navajo Population in Washington?
Top 10 Cities with the Highest Percentage of Navajo Population in Washington are:
#1
13.28%
#2
3.02%
#3
1.46%
#4
1.13%
#5
1.11%
#6
0.82%
#7
0.77%
#8
0.67%
#9
0.64%
#10
0.44%
What city has the Highest Percentage of Navajo Population in Washington?
Keller has the Highest Percentage of Navajo Population in Washington with 13.28%.
What is the Percentage of Navajo Population in the State of Washington?
Percentage of Navajo Population in Washington is 0.055%.
What is the Percentage of Navajo Population in the United States?
Percentage of Navajo Population in the United States is 0.12%.