Zip Codes with the Highest Percentage of Population Employed in Food Preparation & Serving in Marysville, WA
RELATED REPORTS & OPTIONS
Food Preparation & Serving
Marysville
Compare Zip Codes
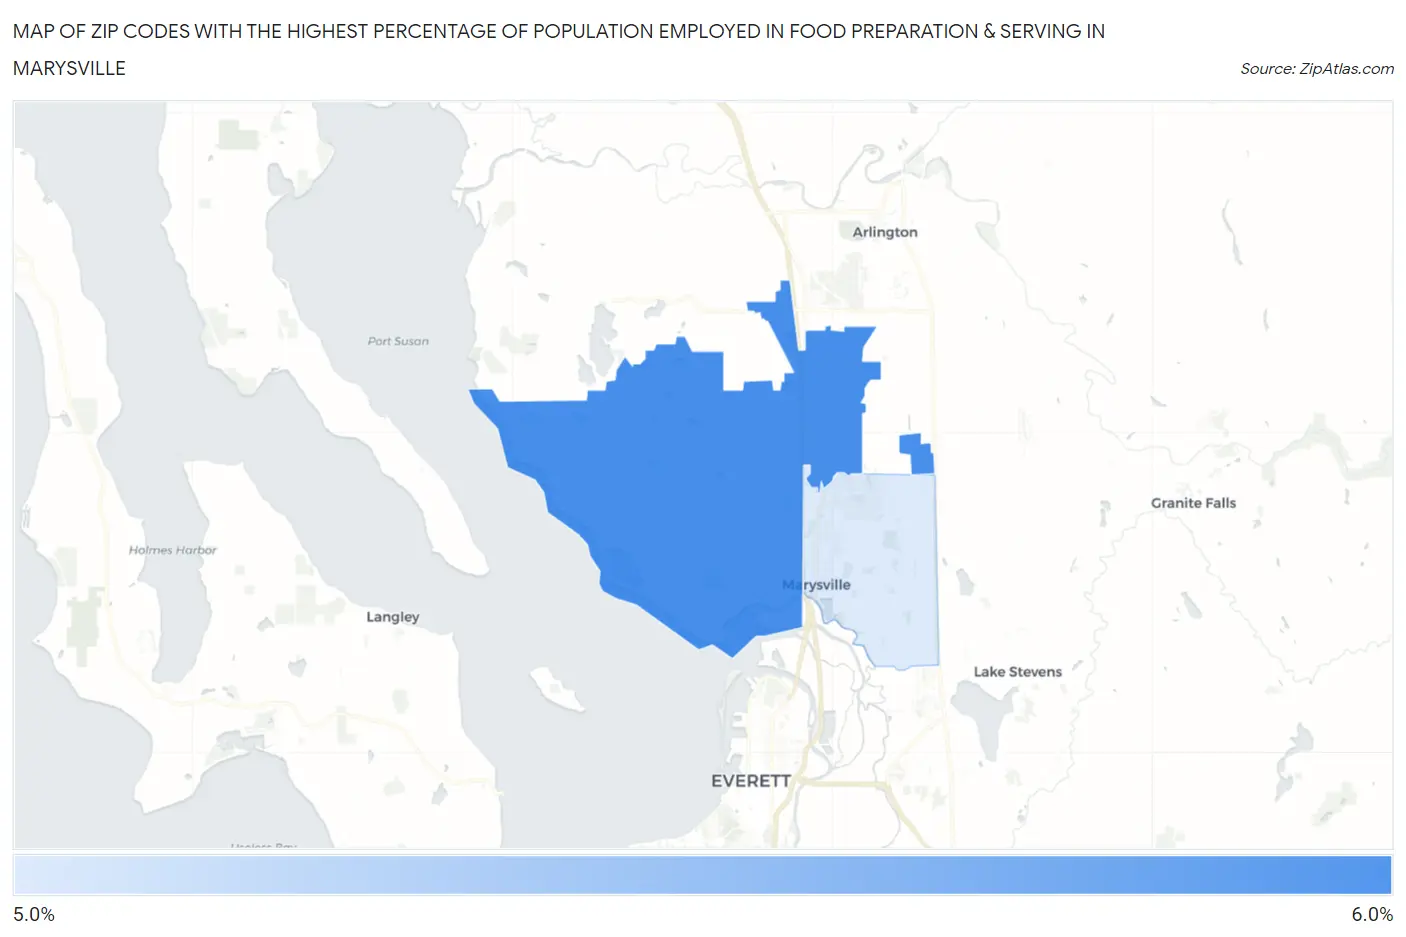
Map of Zip Codes with the Highest Percentage of Population Employed in Food Preparation & Serving in Marysville
5.3%
5.5%
Zip Codes with the Highest Percentage of Population Employed in Food Preparation & Serving in Marysville, WA
| Zip Code | % Employed | vs State | vs National | |
| 1. | 98271 | 5.5% | 5.1%(+0.376)#192 | 5.3%(+0.233)#11,005 |
| 2. | 98270 | 5.3% | 5.1%(+0.206)#209 | 5.3%(+0.063)#11,583 |
1
Common Questions
What are the Top Zip Codes with the Highest Percentage of Population Employed in Food Preparation & Serving in Marysville, WA?
Top Zip Codes with the Highest Percentage of Population Employed in Food Preparation & Serving in Marysville, WA are:
What zip code has the Highest Percentage of Population Employed in Food Preparation & Serving in Marysville, WA?
98271 has the Highest Percentage of Population Employed in Food Preparation & Serving in Marysville, WA with 5.5%.
What is the Percentage of Population Employed in Food Preparation & Serving in Marysville, WA?
Percentage of Population Employed in Food Preparation & Serving in Marysville is 5.7%.
What is the Percentage of Population Employed in Food Preparation & Serving in Washington?
Percentage of Population Employed in Food Preparation & Serving in Washington is 5.1%.
What is the Percentage of Population Employed in Food Preparation & Serving in the United States?
Percentage of Population Employed in Food Preparation & Serving in the United States is 5.3%.