Zip Codes with the Highest Percentage of Population Employed in Food Preparation & Serving in Federal Way, WA
RELATED REPORTS & OPTIONS
Food Preparation & Serving
Federal Way
Compare Zip Codes
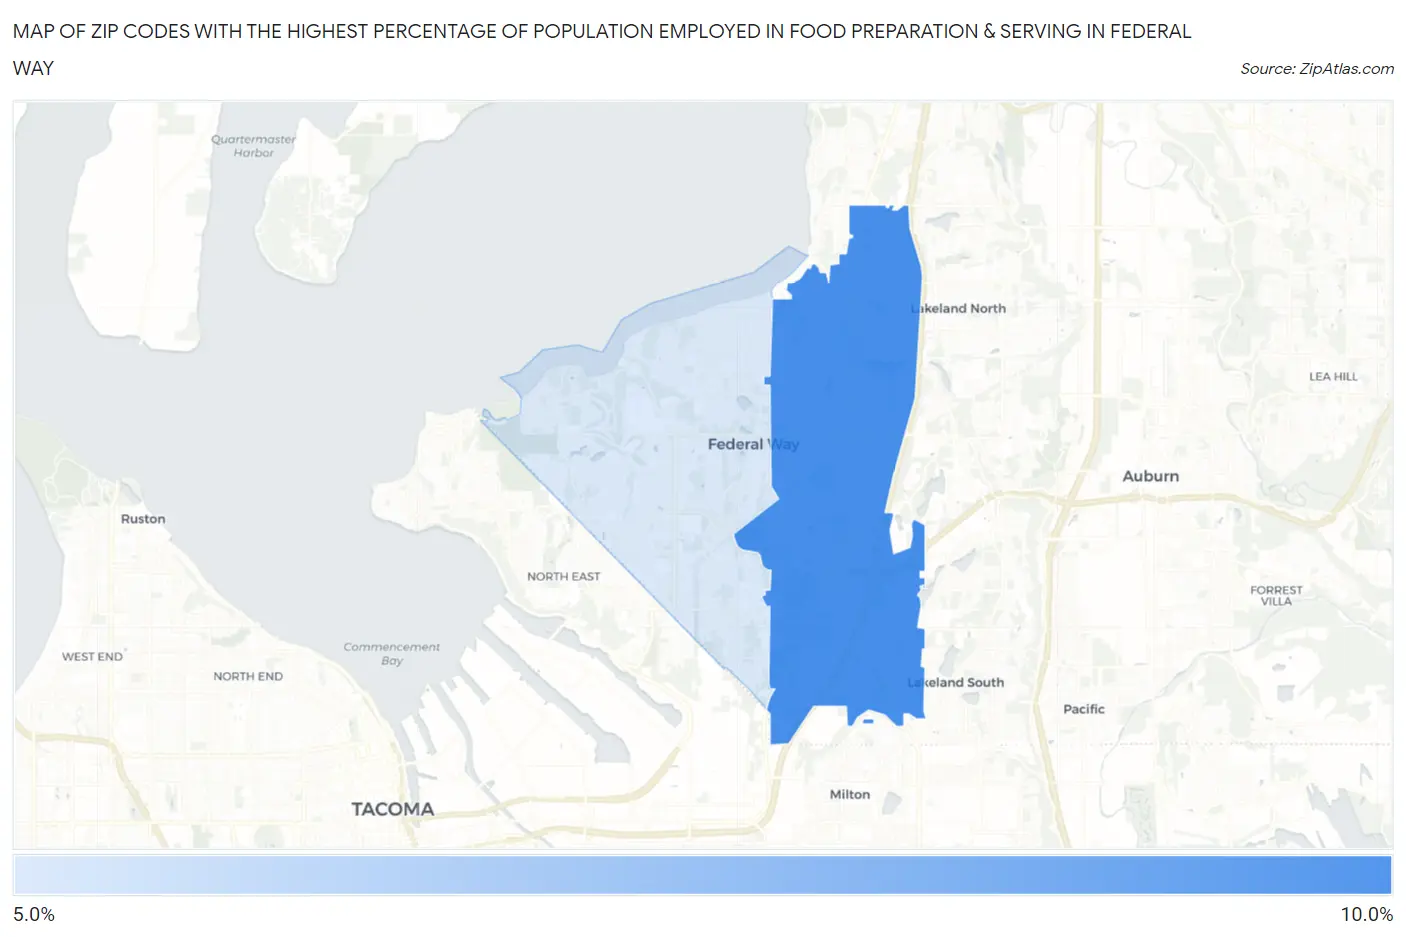
Map of Zip Codes with the Highest Percentage of Population Employed in Food Preparation & Serving in Federal Way
5.6%
8.2%
Zip Codes with the Highest Percentage of Population Employed in Food Preparation & Serving in Federal Way, WA
| Zip Code | % Employed | vs State | vs National | |
| 1. | 98003 | 8.2% | 5.1%(+3.08)#76 | 5.3%(+2.94)#4,405 |
| 2. | 98023 | 5.6% | 5.1%(+0.428)#188 | 5.3%(+0.285)#10,801 |
1
Common Questions
What are the Top Zip Codes with the Highest Percentage of Population Employed in Food Preparation & Serving in Federal Way, WA?
Top Zip Codes with the Highest Percentage of Population Employed in Food Preparation & Serving in Federal Way, WA are:
What zip code has the Highest Percentage of Population Employed in Food Preparation & Serving in Federal Way, WA?
98003 has the Highest Percentage of Population Employed in Food Preparation & Serving in Federal Way, WA with 8.2%.
What is the Percentage of Population Employed in Food Preparation & Serving in Federal Way, WA?
Percentage of Population Employed in Food Preparation & Serving in Federal Way is 6.8%.
What is the Percentage of Population Employed in Food Preparation & Serving in Washington?
Percentage of Population Employed in Food Preparation & Serving in Washington is 5.1%.
What is the Percentage of Population Employed in Food Preparation & Serving in the United States?
Percentage of Population Employed in Food Preparation & Serving in the United States is 5.3%.