Cities with the Highest Percentage of Panamanian Population in Washington
RELATED REPORTS & OPTIONS
Panamanian
Washington
Compare Cities
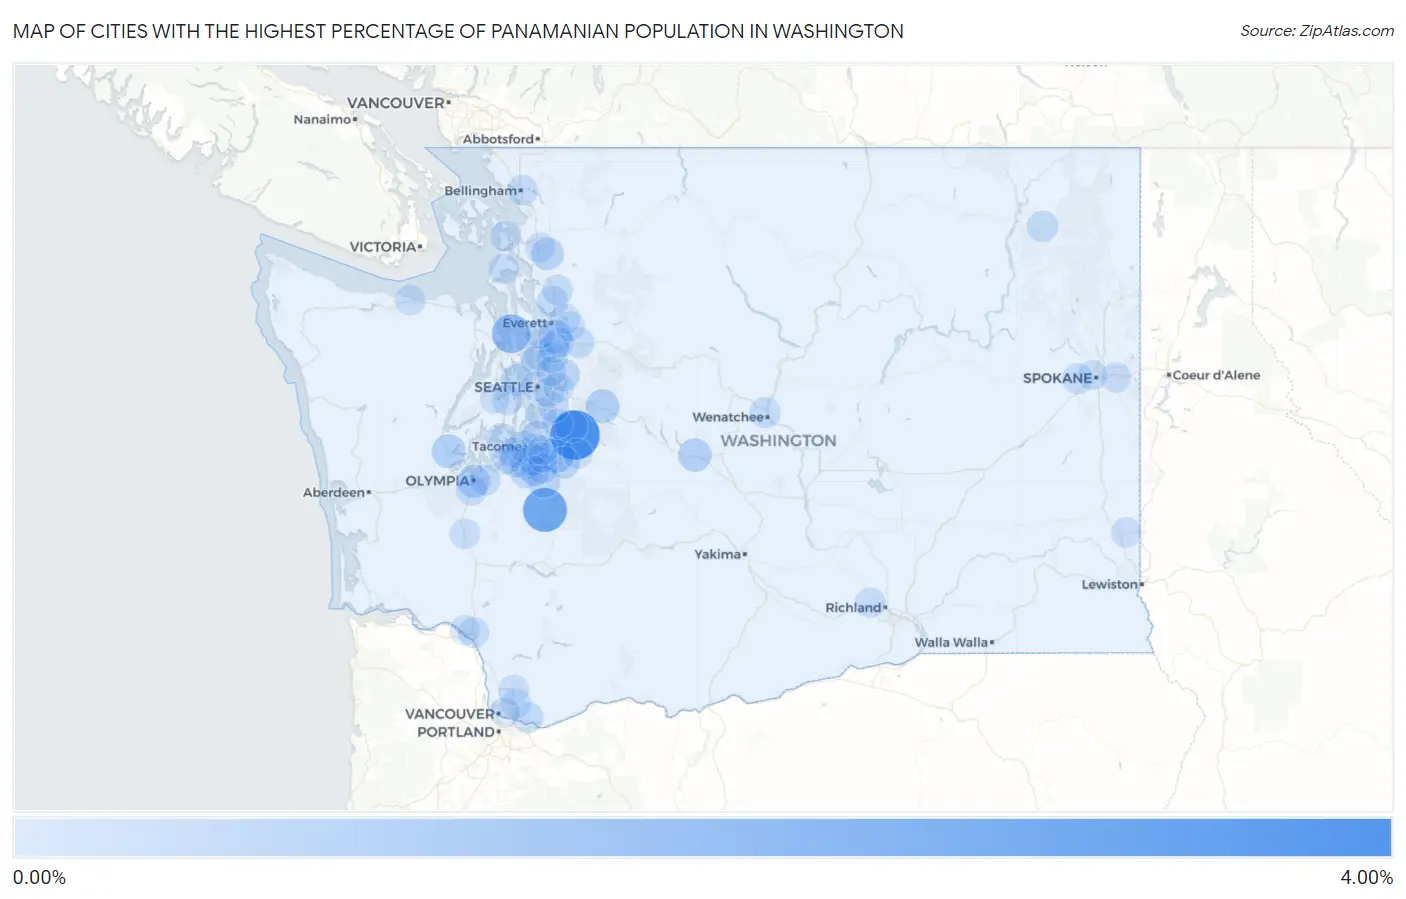
Map of Cities with the Highest Percentage of Panamanian Population in Washington
0.00%
4.00%
Cities with the Highest Percentage of Panamanian Population in Washington
| City | Panamanian | vs State | vs National | |
| 1. | Black Diamond | 3.42% | 0.063%(+3.36)#1 | 0.068%(+3.36)#32 |
| 2. | Eatonville | 2.39% | 0.063%(+2.33)#2 | 0.068%(+2.32)#59 |
| 3. | Hansville | 1.48% | 0.063%(+1.42)#3 | 0.068%(+1.41)#113 |
| 4. | Bonney Lake | 0.89% | 0.063%(+0.826)#4 | 0.068%(+0.822)#220 |
| 5. | Shelton | 0.66% | 0.063%(+0.595)#5 | 0.068%(+0.590)#320 |
| 6. | North Bend | 0.62% | 0.063%(+0.559)#6 | 0.068%(+0.555)#341 |
| 7. | Cle Elum | 0.57% | 0.063%(+0.504)#7 | 0.068%(+0.499)#377 |
| 8. | Eastmont | 0.55% | 0.063%(+0.485)#8 | 0.068%(+0.480)#387 |
| 9. | Olympia | 0.49% | 0.063%(+0.426)#9 | 0.068%(+0.422)#441 |
| 10. | Graham | 0.48% | 0.063%(+0.417)#10 | 0.068%(+0.412)#449 |
| 11. | Big Lake | 0.44% | 0.063%(+0.378)#11 | 0.068%(+0.373)#491 |
| 12. | Maple Valley | 0.43% | 0.063%(+0.370)#12 | 0.068%(+0.366)#504 |
| 13. | Prairie Heights | 0.37% | 0.063%(+0.308)#13 | 0.068%(+0.304)#579 |
| 14. | Redmond | 0.36% | 0.063%(+0.292)#14 | 0.068%(+0.288)#604 |
| 15. | Lakewood | 0.34% | 0.063%(+0.277)#15 | 0.068%(+0.273)#631 |
| 16. | Parkland | 0.29% | 0.063%(+0.231)#16 | 0.068%(+0.227)#708 |
| 17. | Bainbridge Island | 0.29% | 0.063%(+0.224)#17 | 0.068%(+0.220)#726 |
| 18. | Spanaway | 0.23% | 0.063%(+0.169)#18 | 0.068%(+0.164)#843 |
| 19. | Camas | 0.21% | 0.063%(+0.149)#19 | 0.068%(+0.144)#915 |
| 20. | Mountlake Terrace | 0.21% | 0.063%(+0.147)#20 | 0.068%(+0.143)#919 |
| 21. | Tacoma | 0.21% | 0.063%(+0.144)#21 | 0.068%(+0.139)#929 |
| 22. | Colville | 0.20% | 0.063%(+0.140)#22 | 0.068%(+0.135)#946 |
| 23. | Wenatchee | 0.20% | 0.063%(+0.137)#23 | 0.068%(+0.133)#952 |
| 24. | Tumwater | 0.20% | 0.063%(+0.136)#24 | 0.068%(+0.131)#959 |
| 25. | Marysville | 0.20% | 0.063%(+0.136)#25 | 0.068%(+0.131)#961 |
| 26. | Monroe | 0.18% | 0.063%(+0.115)#26 | 0.068%(+0.111)#1,051 |
| 27. | Summit | 0.17% | 0.063%(+0.107)#27 | 0.068%(+0.102)#1,089 |
| 28. | Artondale | 0.14% | 0.063%(+0.081)#28 | 0.068%(+0.077)#1,186 |
| 29. | Fife | 0.14% | 0.063%(+0.074)#29 | 0.068%(+0.070)#1,214 |
| 30. | Parkwood | 0.14% | 0.063%(+0.074)#30 | 0.068%(+0.069)#1,218 |
| 31. | Bothell | 0.14% | 0.063%(+0.072)#31 | 0.068%(+0.068)#1,225 |
| 32. | Kelso | 0.13% | 0.063%(+0.071)#32 | 0.068%(+0.067)#1,234 |
| 33. | Federal Way | 0.13% | 0.063%(+0.067)#33 | 0.068%(+0.063)#1,257 |
| 34. | Arlington | 0.12% | 0.063%(+0.060)#34 | 0.068%(+0.056)#1,304 |
| 35. | Mill Creek East | 0.12% | 0.063%(+0.055)#35 | 0.068%(+0.051)#1,328 |
| 36. | Airway Heights | 0.11% | 0.063%(+0.050)#36 | 0.068%(+0.046)#1,360 |
| 37. | Seatac | 0.11% | 0.063%(+0.047)#37 | 0.068%(+0.042)#1,382 |
| 38. | Lacey | 0.11% | 0.063%(+0.043)#38 | 0.068%(+0.039)#1,395 |
| 39. | Shoreline | 0.10% | 0.063%(+0.037)#39 | 0.068%(+0.033)#1,430 |
| 40. | Bellingham | 0.097% | 0.063%(+0.034)#40 | 0.068%(+0.030)#1,453 |
| 41. | Renton | 0.091% | 0.063%(+0.028)#41 | 0.068%(+0.023)#1,490 |
| 42. | University Place | 0.078% | 0.063%(+0.014)#42 | 0.068%(+0.010)#1,588 |
| 43. | Port Angeles | 0.075% | 0.063%(+0.012)#43 | 0.068%(+0.007)#1,608 |
| 44. | Steilacoom | 0.075% | 0.063%(+0.011)#44 | 0.068%(+0.007)#1,612 |
| 45. | Silver Firs | 0.072% | 0.063%(+0.009)#45 | 0.068%(+0.004)#1,638 |
| 46. | Centralia | 0.066% | 0.063%(+0.002)#46 | 0.068%(-0.002)#1,687 |
| 47. | Lake Stevens | 0.064% | 0.063%(+0.001)#47 | 0.068%(-0.003)#1,701 |
| 48. | Anacortes | 0.062% | 0.063%(-0.001)#48 | 0.068%(-0.006)#1,722 |
| 49. | Spokane Valley | 0.062% | 0.063%(-0.002)#49 | 0.068%(-0.006)#1,728 |
| 50. | Orchards | 0.058% | 0.063%(-0.005)#50 | 0.068%(-0.010)#1,760 |
| 51. | Oak Harbor | 0.057% | 0.063%(-0.006)#51 | 0.068%(-0.011)#1,768 |
| 52. | Enumclaw | 0.055% | 0.063%(-0.008)#52 | 0.068%(-0.012)#1,786 |
| 53. | Mount Vernon | 0.051% | 0.063%(-0.012)#53 | 0.068%(-0.017)#1,815 |
| 54. | Battle Ground | 0.048% | 0.063%(-0.016)#54 | 0.068%(-0.020)#1,853 |
| 55. | Mukilteo | 0.047% | 0.063%(-0.017)#55 | 0.068%(-0.021)#1,867 |
| 56. | South Hill | 0.046% | 0.063%(-0.018)#56 | 0.068%(-0.022)#1,874 |
| 57. | Pullman | 0.044% | 0.063%(-0.020)#57 | 0.068%(-0.024)#1,896 |
| 58. | West Richland | 0.042% | 0.063%(-0.021)#58 | 0.068%(-0.025)#1,909 |
| 59. | Puyallup | 0.042% | 0.063%(-0.021)#59 | 0.068%(-0.026)#1,912 |
| 60. | Spokane | 0.041% | 0.063%(-0.022)#60 | 0.068%(-0.027)#1,931 |
| 61. | Frederickson | 0.040% | 0.063%(-0.023)#61 | 0.068%(-0.027)#1,938 |
| 62. | Seattle | 0.036% | 0.063%(-0.028)#62 | 0.068%(-0.032)#1,990 |
| 63. | Mercer Island | 0.031% | 0.063%(-0.032)#63 | 0.068%(-0.036)#2,040 |
| 64. | Vancouver | 0.026% | 0.063%(-0.038)#64 | 0.068%(-0.042)#2,109 |
| 65. | Bremerton | 0.018% | 0.063%(-0.045)#65 | 0.068%(-0.050)#2,200 |
| 66. | Edgewood | 0.016% | 0.063%(-0.047)#66 | 0.068%(-0.052)#2,225 |
| 67. | Bellevue | 0.016% | 0.063%(-0.047)#67 | 0.068%(-0.052)#2,228 |
| 68. | Longview | 0.016% | 0.063%(-0.047)#68 | 0.068%(-0.052)#2,229 |
| 69. | Kirkland | 0.0098% | 0.063%(-0.054)#69 | 0.068%(-0.058)#2,297 |
| 70. | Everett | 0.0045% | 0.063%(-0.059)#70 | 0.068%(-0.063)#2,337 |
| 71. | Kent | 0.0037% | 0.063%(-0.060)#71 | 0.068%(-0.064)#2,342 |
Common Questions
What are the Top 10 Cities with the Highest Percentage of Panamanian Population in Washington?
Top 10 Cities with the Highest Percentage of Panamanian Population in Washington are:
#1
3.42%
#2
2.39%
#3
1.48%
#4
0.89%
#5
0.66%
#6
0.62%
#7
0.57%
#8
0.55%
#9
0.49%
#10
0.48%
What city has the Highest Percentage of Panamanian Population in Washington?
Black Diamond has the Highest Percentage of Panamanian Population in Washington with 3.42%.
What is the Percentage of Panamanian Population in the State of Washington?
Percentage of Panamanian Population in Washington is 0.063%.
What is the Percentage of Panamanian Population in the United States?
Percentage of Panamanian Population in the United States is 0.068%.