Cities with the Highest Percentage of Population Employed in Manufacturing in Washington
RELATED REPORTS & OPTIONS
Manufacturing
Washington
Compare Cities
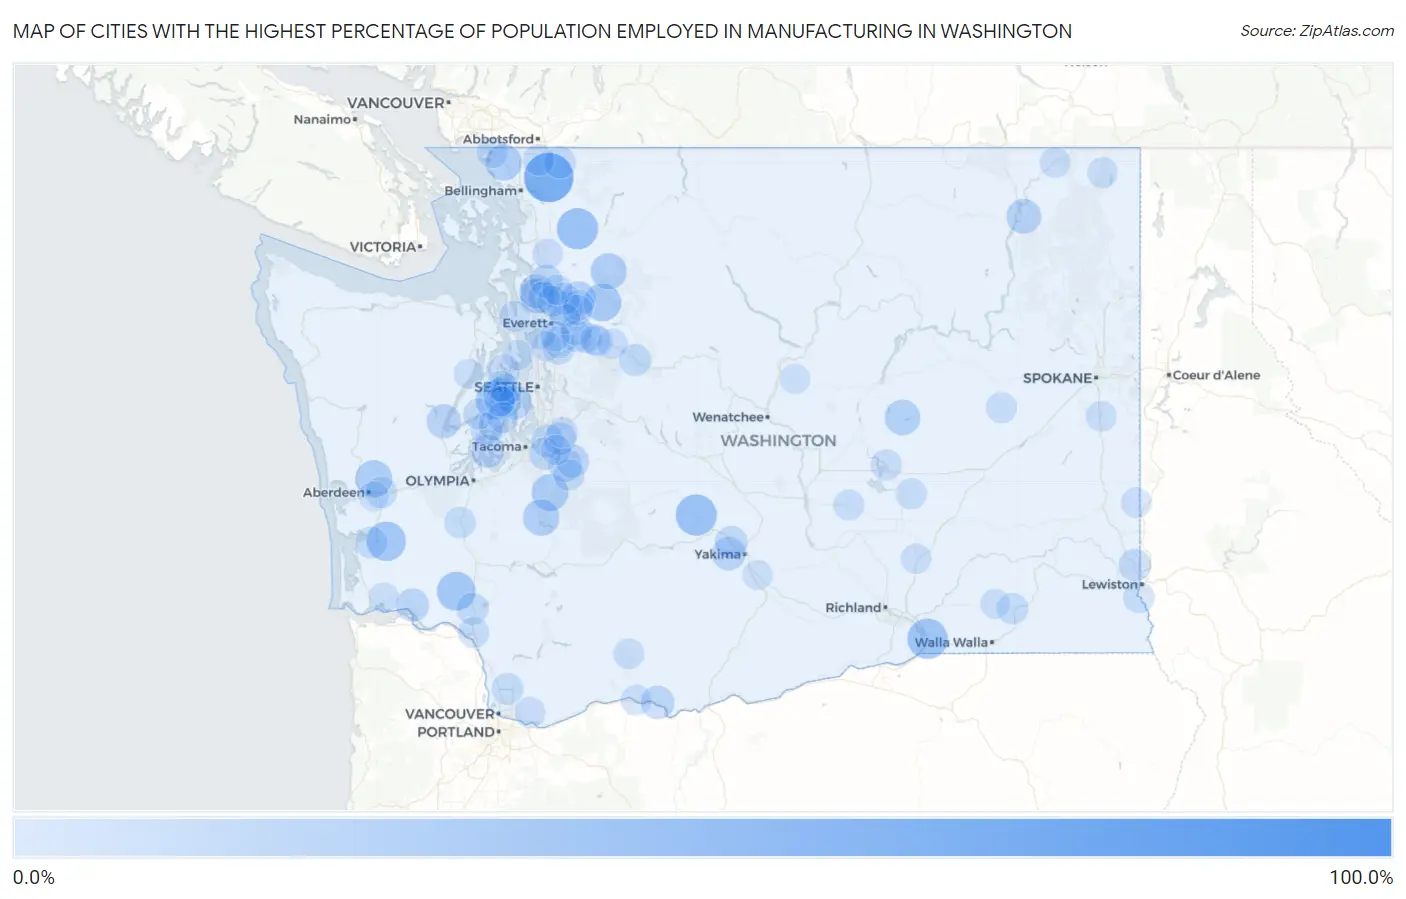
Map of Cities with the Highest Percentage of Population Employed in Manufacturing in Washington
0.0%
100.0%
Cities with the Highest Percentage of Population Employed in Manufacturing in Washington
| City | % Employed | vs State | vs National | |
| 1. | Anatone | 100.0% | 9.2%(+90.8)#1 | 10.0%(+90.0)#66 |
| 2. | Deming | 69.5% | 9.2%(+60.3)#2 | 10.0%(+59.5)#136 |
| 3. | Nile | 45.8% | 9.2%(+36.6)#3 | 10.0%(+35.8)#521 |
| 4. | Hamilton | 45.8% | 9.2%(+36.5)#4 | 10.0%(+35.8)#525 |
| 5. | Wallula | 43.5% | 9.2%(+34.2)#5 | 10.0%(+33.5)#633 |
| 6. | Willapa | 40.8% | 9.2%(+31.6)#6 | 10.0%(+30.9)#771 |
| 7. | Ryderwood | 39.0% | 9.2%(+29.8)#7 | 10.0%(+29.0)#901 |
| 8. | Gorst | 38.9% | 9.2%(+29.6)#8 | 10.0%(+28.9)#908 |
| 9. | Clear Lake Cdp Skagit County | 37.1% | 9.2%(+27.8)#9 | 10.0%(+27.1)#1,058 |
| 10. | Verlot | 36.0% | 9.2%(+26.8)#10 | 10.0%(+26.0)#1,167 |
| 11. | Aberdeen Gardens | 34.3% | 9.2%(+25.1)#11 | 10.0%(+24.3)#1,373 |
| 12. | Kapowsin | 33.7% | 9.2%(+24.5)#12 | 10.0%(+23.7)#1,454 |
| 13. | La Grande | 32.6% | 9.2%(+23.3)#13 | 10.0%(+22.6)#1,612 |
| 14. | Custer | 32.2% | 9.2%(+23.0)#14 | 10.0%(+22.2)#1,655 |
| 15. | Swede Heaven | 31.7% | 9.2%(+22.5)#15 | 10.0%(+21.7)#1,749 |
| 16. | Wilson Creek | 30.4% | 9.2%(+21.1)#16 | 10.0%(+20.4)#2,001 |
| 17. | Lake Cassidy | 29.4% | 9.2%(+20.1)#17 | 10.0%(+19.4)#2,202 |
| 18. | Kettle Falls | 28.4% | 9.2%(+19.2)#18 | 10.0%(+18.4)#2,436 |
| 19. | Canyon Creek | 27.6% | 9.2%(+18.3)#19 | 10.0%(+17.6)#2,669 |
| 20. | Kayak Point | 27.2% | 9.2%(+18.0)#20 | 10.0%(+17.2)#2,792 |
| 21. | Hoodsport | 27.0% | 9.2%(+17.8)#21 | 10.0%(+17.0)#2,851 |
| 22. | Warm Beach | 26.2% | 9.2%(+17.0)#22 | 10.0%(+16.2)#3,066 |
| 23. | Navy Yard City | 25.6% | 9.2%(+16.3)#23 | 10.0%(+15.6)#3,276 |
| 24. | Southworth | 25.3% | 9.2%(+16.1)#24 | 10.0%(+15.3)#3,362 |
| 25. | Summitview | 25.3% | 9.2%(+16.1)#25 | 10.0%(+15.3)#3,368 |
| 26. | Lyle | 24.7% | 9.2%(+15.5)#26 | 10.0%(+14.7)#3,592 |
| 27. | South Prairie | 24.3% | 9.2%(+15.0)#27 | 10.0%(+14.3)#3,736 |
| 28. | Buckley | 23.6% | 9.2%(+14.4)#28 | 10.0%(+13.6)#3,995 |
| 29. | Skamokawa Valley | 23.5% | 9.2%(+14.3)#29 | 10.0%(+13.5)#4,023 |
| 30. | Longbranch | 23.4% | 9.2%(+14.1)#30 | 10.0%(+13.4)#4,090 |
| 31. | Sunday Lake | 23.3% | 9.2%(+14.1)#31 | 10.0%(+13.3)#4,120 |
| 32. | Eschbach | 23.1% | 9.2%(+13.8)#32 | 10.0%(+13.1)#4,181 |
| 33. | Algona | 23.0% | 9.2%(+13.7)#33 | 10.0%(+13.0)#4,239 |
| 34. | Lake Holm | 22.2% | 9.2%(+13.0)#34 | 10.0%(+12.2)#4,564 |
| 35. | Uniontown | 22.0% | 9.2%(+12.8)#35 | 10.0%(+12.0)#4,658 |
| 36. | Sisco Heights | 21.4% | 9.2%(+12.2)#36 | 10.0%(+11.4)#4,980 |
| 37. | East Port Orchard | 21.1% | 9.2%(+11.9)#37 | 10.0%(+11.1)#5,120 |
| 38. | Baring | 20.9% | 9.2%(+11.7)#38 | 10.0%(+10.9)#5,232 |
| 39. | North Puyallup | 20.9% | 9.2%(+11.6)#39 | 10.0%(+10.9)#5,250 |
| 40. | Kendall | 20.8% | 9.2%(+11.5)#40 | 10.0%(+10.8)#5,303 |
| 41. | Castle Rock | 20.5% | 9.2%(+11.3)#41 | 10.0%(+10.5)#5,435 |
| 42. | South Bend | 20.3% | 9.2%(+11.1)#42 | 10.0%(+10.3)#5,558 |
| 43. | Vaughn | 20.3% | 9.2%(+11.1)#43 | 10.0%(+10.3)#5,567 |
| 44. | Lake Goodwin | 20.1% | 9.2%(+10.9)#44 | 10.0%(+10.2)#5,653 |
| 45. | Clearview | 20.1% | 9.2%(+10.9)#45 | 10.0%(+10.1)#5,658 |
| 46. | Dollars Corner | 20.1% | 9.2%(+10.9)#46 | 10.0%(+10.1)#5,667 |
| 47. | Lexington | 19.7% | 9.2%(+10.4)#47 | 10.0%(+9.67)#5,945 |
| 48. | Nooksack | 19.5% | 9.2%(+10.2)#48 | 10.0%(+9.46)#6,083 |
| 49. | Waitsburg | 19.3% | 9.2%(+10.1)#49 | 10.0%(+9.33)#6,177 |
| 50. | Central Park | 19.2% | 9.2%(+9.96)#50 | 10.0%(+9.20)#6,287 |
| 51. | Grand Mound | 19.1% | 9.2%(+9.88)#51 | 10.0%(+9.11)#6,347 |
| 52. | Enetai | 19.0% | 9.2%(+9.79)#52 | 10.0%(+9.03)#6,416 |
| 53. | Chain Lake | 19.0% | 9.2%(+9.76)#53 | 10.0%(+9.00)#6,438 |
| 54. | Keyport | 19.0% | 9.2%(+9.75)#54 | 10.0%(+8.99)#6,447 |
| 55. | Silver Firs | 18.8% | 9.2%(+9.59)#55 | 10.0%(+8.83)#6,543 |
| 56. | Asotin | 18.8% | 9.2%(+9.58)#56 | 10.0%(+8.82)#6,556 |
| 57. | Carbonado | 18.7% | 9.2%(+9.48)#57 | 10.0%(+8.71)#6,619 |
| 58. | Moses Lake | 18.5% | 9.2%(+9.25)#58 | 10.0%(+8.49)#6,779 |
| 59. | Harrington | 18.4% | 9.2%(+9.19)#59 | 10.0%(+8.43)#6,818 |
| 60. | Warden | 18.2% | 9.2%(+9.01)#60 | 10.0%(+8.25)#6,928 |
| 61. | Freeland | 18.2% | 9.2%(+8.96)#61 | 10.0%(+8.20)#6,950 |
| 62. | Blaine | 18.1% | 9.2%(+8.90)#62 | 10.0%(+8.14)#7,014 |
| 63. | Stansberry Lake | 18.0% | 9.2%(+8.76)#63 | 10.0%(+8.00)#7,115 |
| 64. | Tracyton | 18.0% | 9.2%(+8.75)#64 | 10.0%(+7.98)#7,129 |
| 65. | Three Lakes | 18.0% | 9.2%(+8.74)#65 | 10.0%(+7.98)#7,133 |
| 66. | Belfair | 17.9% | 9.2%(+8.63)#66 | 10.0%(+7.87)#7,205 |
| 67. | Mukilteo | 17.6% | 9.2%(+8.41)#67 | 10.0%(+7.65)#7,362 |
| 68. | Woods Creek | 17.6% | 9.2%(+8.40)#68 | 10.0%(+7.64)#7,366 |
| 69. | Burley | 17.6% | 9.2%(+8.39)#69 | 10.0%(+7.62)#7,374 |
| 70. | Royal City | 17.6% | 9.2%(+8.38)#70 | 10.0%(+7.62)#7,379 |
| 71. | Kelso | 17.6% | 9.2%(+8.35)#71 | 10.0%(+7.58)#7,399 |
| 72. | Fern Prairie | 17.5% | 9.2%(+8.27)#72 | 10.0%(+7.51)#7,444 |
| 73. | Metaline Falls | 17.4% | 9.2%(+8.16)#73 | 10.0%(+7.40)#7,516 |
| 74. | Trout Lake | 17.4% | 9.2%(+8.15)#74 | 10.0%(+7.39)#7,522 |
| 75. | Bingen | 17.4% | 9.2%(+8.14)#75 | 10.0%(+7.38)#7,528 |
| 76. | Marysville | 17.3% | 9.2%(+8.05)#76 | 10.0%(+7.29)#7,617 |
| 77. | Spangle | 17.2% | 9.2%(+8.01)#77 | 10.0%(+7.25)#7,635 |
| 78. | Sultan | 17.1% | 9.2%(+7.87)#78 | 10.0%(+7.11)#7,754 |
| 79. | Granite Falls | 17.0% | 9.2%(+7.75)#79 | 10.0%(+6.99)#7,823 |
| 80. | Lake Stevens | 16.9% | 9.2%(+7.64)#80 | 10.0%(+6.88)#7,891 |
| 81. | Palouse | 16.7% | 9.2%(+7.47)#81 | 10.0%(+6.71)#7,986 |
| 82. | Big Lake | 16.7% | 9.2%(+7.46)#82 | 10.0%(+6.70)#7,999 |
| 83. | North Sultan | 16.7% | 9.2%(+7.44)#83 | 10.0%(+6.68)#8,033 |
| 84. | Northport | 16.7% | 9.2%(+7.44)#84 | 10.0%(+6.68)#8,040 |
| 85. | Kingston | 16.6% | 9.2%(+7.36)#85 | 10.0%(+6.60)#8,136 |
| 86. | Lake Morton Berrydale | 16.5% | 9.2%(+7.30)#86 | 10.0%(+6.54)#8,183 |
| 87. | Lake Bosworth | 16.5% | 9.2%(+7.26)#87 | 10.0%(+6.49)#8,214 |
| 88. | May Creek | 16.3% | 9.2%(+7.04)#88 | 10.0%(+6.28)#8,385 |
| 89. | Port Orchard | 16.3% | 9.2%(+7.03)#89 | 10.0%(+6.27)#8,389 |
| 90. | Arlington | 16.2% | 9.2%(+6.97)#90 | 10.0%(+6.21)#8,445 |
| 91. | Mesa | 16.2% | 9.2%(+6.96)#91 | 10.0%(+6.20)#8,452 |
| 92. | Larch Way | 15.8% | 9.2%(+6.57)#92 | 10.0%(+5.81)#8,788 |
| 93. | Deep River | 15.8% | 9.2%(+6.56)#93 | 10.0%(+5.80)#8,805 |
| 94. | Lake Tapps | 15.8% | 9.2%(+6.55)#94 | 10.0%(+5.79)#8,824 |
| 95. | Cosmopolis | 15.7% | 9.2%(+6.49)#95 | 10.0%(+5.73)#8,870 |
| 96. | Eastmont | 15.7% | 9.2%(+6.46)#96 | 10.0%(+5.70)#8,910 |
| 97. | Waterville | 15.6% | 9.2%(+6.33)#97 | 10.0%(+5.57)#9,038 |
| 98. | Brinnon | 15.5% | 9.2%(+6.29)#98 | 10.0%(+5.53)#9,078 |
| 99. | Prescott | 15.5% | 9.2%(+6.27)#99 | 10.0%(+5.51)#9,093 |
| 100. | Donald | 15.5% | 9.2%(+6.23)#100 | 10.0%(+5.47)#9,127 |
Common Questions
What are the Top 10 Cities with the Highest Percentage of Population Employed in Manufacturing in Washington?
Top 10 Cities with the Highest Percentage of Population Employed in Manufacturing in Washington are:
What city has the Highest Percentage of Population Employed in Manufacturing in Washington?
Deming has the Highest Percentage of Population Employed in Manufacturing in Washington with 69.5%.
What is the Percentage of Population Employed in Manufacturing in the State of Washington?
Percentage of Population Employed in Manufacturing in Washington is 9.2%.
What is the Percentage of Population Employed in Manufacturing in the United States?
Percentage of Population Employed in Manufacturing in the United States is 10.0%.