Cities with the Most Immigrants from Oceania in Washington
RELATED REPORTS & OPTIONS
Oceania
Washington
Compare Cities
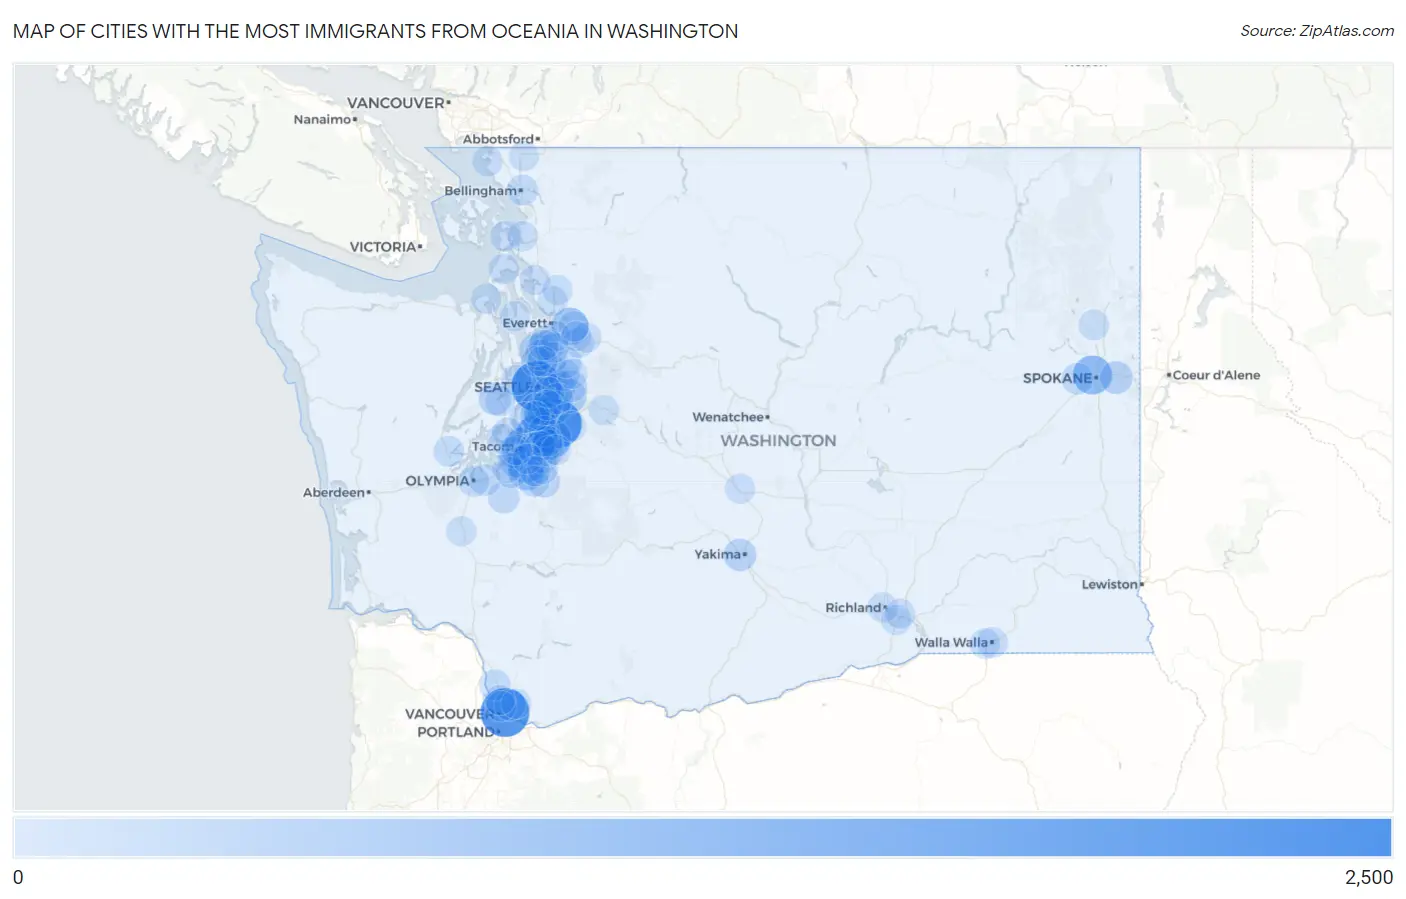
Map of Cities with the Most Immigrants from Oceania in Washington
0
2,500
Cities with the Most Immigrants from Oceania in Washington
| City | Oceania | vs State | vs National | |
| 1. | Seattle | 2,006 | 23,885(8.40%)#1 | 293,459(0.68%)#13 |
| 2. | Vancouver | 1,917 | 23,885(8.03%)#2 | 293,459(0.65%)#16 |
| 3. | Kent | 1,893 | 23,885(7.93%)#3 | 293,459(0.65%)#17 |
| 4. | Federal Way | 1,258 | 23,885(5.27%)#4 | 293,459(0.43%)#26 |
| 5. | Auburn | 973 | 23,885(4.07%)#5 | 293,459(0.33%)#34 |
| 6. | Spokane | 911 | 23,885(3.81%)#6 | 293,459(0.31%)#37 |
| 7. | Tacoma | 844 | 23,885(3.53%)#7 | 293,459(0.29%)#39 |
| 8. | Parkland | 767 | 23,885(3.21%)#8 | 293,459(0.26%)#46 |
| 9. | Everett | 697 | 23,885(2.92%)#9 | 293,459(0.24%)#52 |
| 10. | Spanaway | 557 | 23,885(2.33%)#10 | 293,459(0.19%)#69 |
| 11. | Seatac | 387 | 23,885(1.62%)#11 | 293,459(0.13%)#107 |
| 12. | Tukwila | 361 | 23,885(1.51%)#12 | 293,459(0.12%)#117 |
| 13. | Renton | 360 | 23,885(1.51%)#13 | 293,459(0.12%)#118 |
| 14. | Issaquah | 351 | 23,885(1.47%)#14 | 293,459(0.12%)#123 |
| 15. | Des Moines | 319 | 23,885(1.34%)#15 | 293,459(0.11%)#141 |
| 16. | Spokane Valley | 295 | 23,885(1.24%)#16 | 293,459(0.10%)#160 |
| 17. | Bellevue | 290 | 23,885(1.21%)#17 | 293,459(0.10%)#165 |
| 18. | Bremerton | 282 | 23,885(1.18%)#18 | 293,459(0.10%)#172 |
| 19. | Kirkland | 277 | 23,885(1.16%)#19 | 293,459(0.09%)#174 |
| 20. | Fife | 276 | 23,885(1.16%)#20 | 293,459(0.09%)#176 |
| 21. | Yakima | 253 | 23,885(1.06%)#21 | 293,459(0.09%)#192 |
| 22. | Lakewood | 246 | 23,885(1.03%)#22 | 293,459(0.08%)#201 |
| 23. | Graham | 241 | 23,885(1.01%)#23 | 293,459(0.08%)#207 |
| 24. | Edmonds | 221 | 23,885(0.93%)#24 | 293,459(0.08%)#221 |
| 25. | Edgewood | 209 | 23,885(0.88%)#25 | 293,459(0.07%)#232 |
| 26. | Puyallup | 189 | 23,885(0.79%)#26 | 293,459(0.06%)#259 |
| 27. | Airway Heights | 179 | 23,885(0.75%)#27 | 293,459(0.06%)#278 |
| 28. | Sammamish | 177 | 23,885(0.74%)#28 | 293,459(0.06%)#279 |
| 29. | Redmond | 176 | 23,885(0.74%)#29 | 293,459(0.06%)#281 |
| 30. | Lakeland South | 165 | 23,885(0.69%)#30 | 293,459(0.06%)#299 |
| 31. | Yelm | 151 | 23,885(0.63%)#31 | 293,459(0.05%)#331 |
| 32. | Lynnwood | 147 | 23,885(0.62%)#32 | 293,459(0.05%)#343 |
| 33. | Burien | 144 | 23,885(0.60%)#33 | 293,459(0.05%)#352 |
| 34. | Lacey | 143 | 23,885(0.60%)#34 | 293,459(0.05%)#354 |
| 35. | Ridgefield | 142 | 23,885(0.59%)#35 | 293,459(0.05%)#356 |
| 36. | Five Corners | 141 | 23,885(0.59%)#36 | 293,459(0.05%)#357 |
| 37. | Lake Stickney | 140 | 23,885(0.59%)#37 | 293,459(0.05%)#358 |
| 38. | University Place | 137 | 23,885(0.57%)#38 | 293,459(0.05%)#364 |
| 39. | Newcastle | 130 | 23,885(0.54%)#39 | 293,459(0.04%)#385 |
| 40. | Olympia | 109 | 23,885(0.46%)#40 | 293,459(0.04%)#440 |
| 41. | Fort Lewis | 104 | 23,885(0.44%)#41 | 293,459(0.04%)#461 |
| 42. | Cottage Lake | 100 | 23,885(0.42%)#42 | 293,459(0.03%)#480 |
| 43. | Bellingham | 99 | 23,885(0.41%)#43 | 293,459(0.03%)#483 |
| 44. | Elk Plain | 97 | 23,885(0.41%)#44 | 293,459(0.03%)#493 |
| 45. | Mercer Island | 95 | 23,885(0.40%)#45 | 293,459(0.03%)#504 |
| 46. | Pacific | 93 | 23,885(0.39%)#46 | 293,459(0.03%)#515 |
| 47. | Lakeland North | 91 | 23,885(0.38%)#47 | 293,459(0.03%)#523 |
| 48. | Shelton | 89 | 23,885(0.37%)#48 | 293,459(0.03%)#537 |
| 49. | Vashon | 85 | 23,885(0.36%)#49 | 293,459(0.03%)#557 |
| 50. | Monroe | 78 | 23,885(0.33%)#50 | 293,459(0.03%)#593 |
| 51. | Walla Walla | 71 | 23,885(0.30%)#51 | 293,459(0.02%)#626 |
| 52. | North Fort Lewis | 70 | 23,885(0.29%)#52 | 293,459(0.02%)#635 |
| 53. | Deer Park | 70 | 23,885(0.29%)#53 | 293,459(0.02%)#636 |
| 54. | Martha Lake | 69 | 23,885(0.29%)#54 | 293,459(0.02%)#640 |
| 55. | Mountlake Terrace | 67 | 23,885(0.28%)#55 | 293,459(0.02%)#656 |
| 56. | Bainbridge Island | 60 | 23,885(0.25%)#56 | 293,459(0.02%)#720 |
| 57. | South Hill | 59 | 23,885(0.25%)#57 | 293,459(0.02%)#730 |
| 58. | Bothell | 57 | 23,885(0.24%)#58 | 293,459(0.02%)#753 |
| 59. | Maple Valley | 56 | 23,885(0.23%)#59 | 293,459(0.02%)#763 |
| 60. | Milton | 54 | 23,885(0.23%)#60 | 293,459(0.02%)#786 |
| 61. | Eastmont | 53 | 23,885(0.22%)#61 | 293,459(0.02%)#796 |
| 62. | Garrett | 53 | 23,885(0.22%)#62 | 293,459(0.02%)#801 |
| 63. | Oak Harbor | 49 | 23,885(0.21%)#63 | 293,459(0.02%)#831 |
| 64. | Fircrest | 47 | 23,885(0.20%)#64 | 293,459(0.02%)#864 |
| 65. | Marysville | 46 | 23,885(0.19%)#65 | 293,459(0.02%)#867 |
| 66. | Shoreline | 46 | 23,885(0.19%)#66 | 293,459(0.02%)#869 |
| 67. | Freeland | 46 | 23,885(0.19%)#67 | 293,459(0.02%)#881 |
| 68. | Richland | 45 | 23,885(0.19%)#68 | 293,459(0.02%)#885 |
| 69. | Bryn Mawr Skyway | 45 | 23,885(0.19%)#69 | 293,459(0.02%)#887 |
| 70. | Birch Bay | 44 | 23,885(0.18%)#70 | 293,459(0.01%)#899 |
| 71. | Kennewick | 43 | 23,885(0.18%)#71 | 293,459(0.01%)#908 |
| 72. | Sumner | 43 | 23,885(0.18%)#72 | 293,459(0.01%)#920 |
| 73. | Mill Creek East | 41 | 23,885(0.17%)#73 | 293,459(0.01%)#954 |
| 74. | Port Townsend | 40 | 23,885(0.17%)#74 | 293,459(0.01%)#970 |
| 75. | Anacortes | 38 | 23,885(0.16%)#75 | 293,459(0.01%)#1,006 |
| 76. | Algona | 37 | 23,885(0.15%)#76 | 293,459(0.01%)#1,033 |
| 77. | North Lynnwood | 35 | 23,885(0.15%)#77 | 293,459(0.01%)#1,062 |
| 78. | Hazel Dell | 35 | 23,885(0.15%)#78 | 293,459(0.01%)#1,064 |
| 79. | Lake Forest Park | 35 | 23,885(0.15%)#79 | 293,459(0.01%)#1,067 |
| 80. | Pasco | 34 | 23,885(0.14%)#80 | 293,459(0.01%)#1,076 |
| 81. | Ellensburg | 33 | 23,885(0.14%)#81 | 293,459(0.01%)#1,112 |
| 82. | Gig Harbor | 32 | 23,885(0.13%)#82 | 293,459(0.01%)#1,142 |
| 83. | Arlington | 30 | 23,885(0.13%)#83 | 293,459(0.01%)#1,184 |
| 84. | Lynden | 30 | 23,885(0.13%)#84 | 293,459(0.01%)#1,187 |
| 85. | Midland | 30 | 23,885(0.13%)#85 | 293,459(0.01%)#1,189 |
| 86. | Woods Creek | 30 | 23,885(0.13%)#86 | 293,459(0.01%)#1,192 |
| 87. | Bay View | 30 | 23,885(0.13%)#87 | 293,459(0.01%)#1,201 |
| 88. | Lake Tapps | 27 | 23,885(0.11%)#88 | 293,459(0.01%)#1,274 |
| 89. | Union Hill Novelty Hill | 26 | 23,885(0.11%)#89 | 293,459(0.01%)#1,298 |
| 90. | Port Orchard | 25 | 23,885(0.10%)#90 | 293,459(0.01%)#1,327 |
| 91. | Snohomish | 25 | 23,885(0.10%)#91 | 293,459(0.01%)#1,335 |
| 92. | Riverbend | 25 | 23,885(0.10%)#92 | 293,459(0.01%)#1,345 |
| 93. | Frederickson | 24 | 23,885(0.10%)#93 | 293,459(0.01%)#1,358 |
| 94. | Orchards | 22 | 23,885(0.09%)#94 | 293,459(0.01%)#1,434 |
| 95. | Artondale | 21 | 23,885(0.09%)#95 | 293,459(0.01%)#1,483 |
| 96. | Normandy Park | 21 | 23,885(0.09%)#96 | 293,459(0.01%)#1,488 |
| 97. | Chain Lake | 21 | 23,885(0.09%)#97 | 293,459(0.01%)#1,491 |
| 98. | Fords Prairie | 21 | 23,885(0.09%)#98 | 293,459(0.01%)#1,500 |
| 99. | Salmon Creek | 20 | 23,885(0.08%)#99 | 293,459(0.01%)#1,532 |
| 100. | Stanwood | 20 | 23,885(0.08%)#100 | 293,459(0.01%)#1,542 |
Common Questions
What are the Top 10 Cities with the Most Immigrants from Oceania in Washington?
Top 10 Cities with the Most Immigrants from Oceania in Washington are:
What city has the Most Immigrants from Oceania in Washington?
Seattle has the Most Immigrants from Oceania in Washington with 2,006.
What is the Total Immigrants from Oceania in the State of Washington?
Total Immigrants from Oceania in Washington is 23,885.
What is the Total Immigrants from Oceania in the United States?
Total Immigrants from Oceania in the United States is 293,459.