Cities with the Highest Unemployment Rate Amomg Seniors Over the Age of 65 in Washington
RELATED REPORTS & OPTIONS
Highest Unemployment | Senior > 65
Washington
Compare Cities
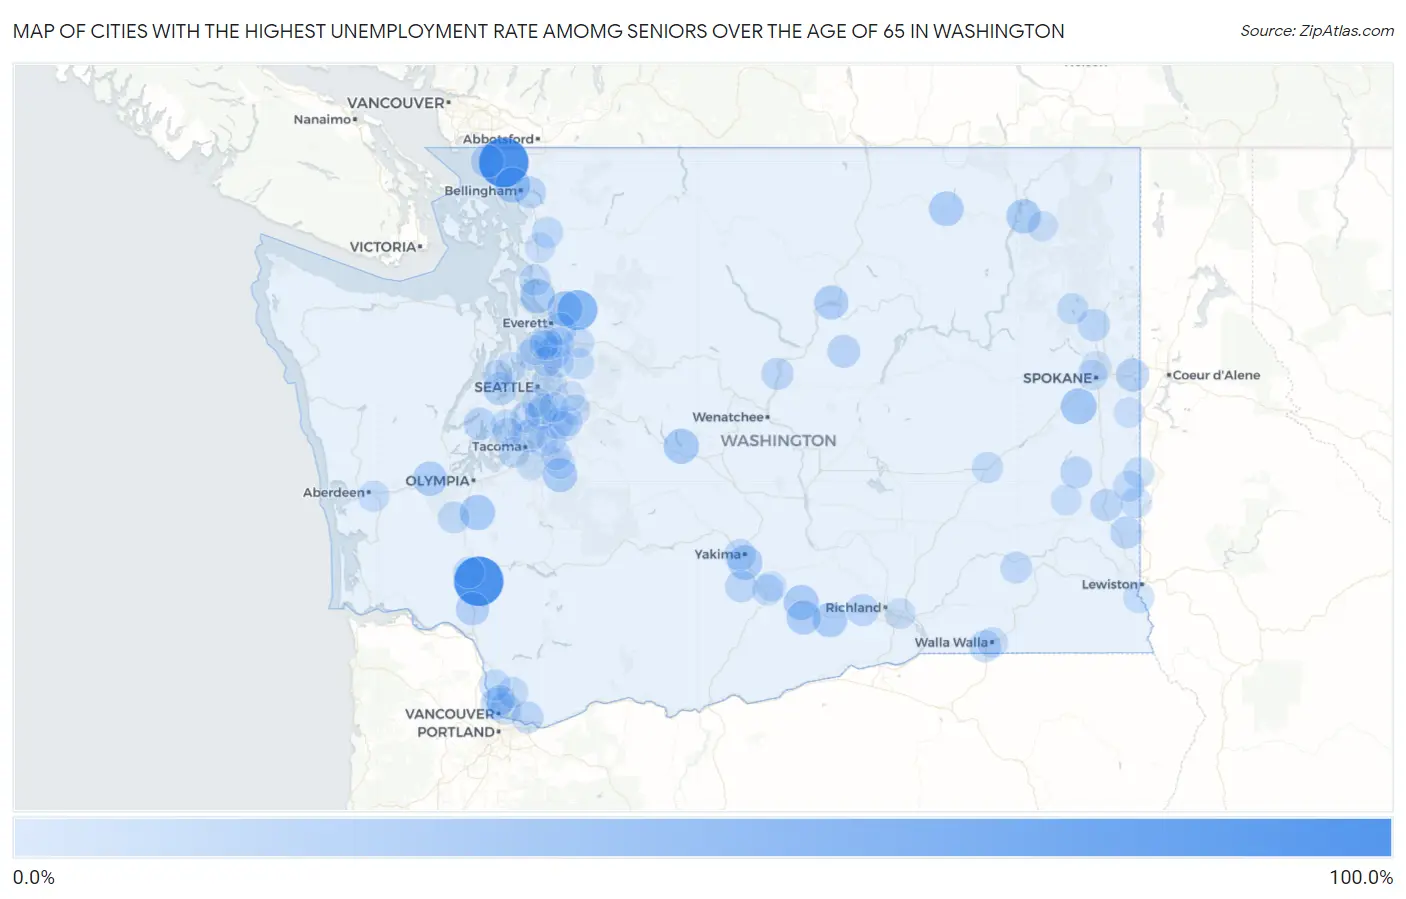
Map of Cities with the Highest Unemployment Rate Amomg Seniors Over the Age of 65 in Washington
0.0%
100.0%
Cities with the Highest Unemployment Rate Amomg Seniors Over the Age of 65 in Washington
| City | Senior Unemployment | vs State | vs National | |
| 1. | Custer | 100.0% | 3.4%(+96.6)#1 | 3.9%(+96.1)#45 |
| 2. | Toledo | 99.9% | 3.4%(+96.5)#2 | 3.9%(+96.0)#85 |
| 3. | Clear Lake Cdp Pierce County | 99.8% | 3.4%(+96.4)#3 | 3.9%(+95.9)#103 |
| 4. | Lake Bosworth | 51.7% | 3.4%(+48.3)#4 | 3.9%(+47.8)#258 |
| 5. | Cheney | 31.6% | 3.4%(+28.2)#5 | 3.9%(+27.7)#628 |
| 6. | Marietta Alderwood | 28.7% | 3.4%(+25.3)#6 | 3.9%(+24.8)#717 |
| 7. | Tenino | 28.6% | 3.4%(+25.2)#7 | 3.9%(+24.7)#722 |
| 8. | Roslyn | 27.9% | 3.4%(+24.5)#8 | 3.9%(+24.0)#763 |
| 9. | Lake Cassidy | 27.8% | 3.4%(+24.4)#9 | 3.9%(+23.9)#767 |
| 10. | Sunnyside | 27.5% | 3.4%(+24.1)#10 | 3.9%(+23.6)#777 |
| 11. | Union Gap | 25.7% | 3.4%(+22.3)#11 | 3.9%(+21.8)#832 |
| 12. | Prosser | 25.6% | 3.4%(+22.2)#12 | 3.9%(+21.7)#836 |
| 13. | Republic | 25.5% | 3.4%(+22.1)#13 | 3.9%(+21.6)#844 |
| 14. | Kayak Point | 25.2% | 3.4%(+21.8)#14 | 3.9%(+21.3)#849 |
| 15. | Kettle Falls | 25.2% | 3.4%(+21.8)#15 | 3.9%(+21.3)#850 |
| 16. | Crocker | 24.4% | 3.4%(+21.0)#16 | 3.9%(+20.5)#914 |
| 17. | Mccleary | 24.3% | 3.4%(+20.9)#17 | 3.9%(+20.4)#917 |
| 18. | Mabton | 24.3% | 3.4%(+20.9)#18 | 3.9%(+20.4)#918 |
| 19. | Brewster | 23.7% | 3.4%(+20.3)#19 | 3.9%(+19.8)#944 |
| 20. | Castle Rock | 19.9% | 3.4%(+16.5)#20 | 3.9%(+16.0)#1,168 |
| 21. | Birch Bay | 19.0% | 3.4%(+15.6)#21 | 3.9%(+15.1)#1,231 |
| 22. | Tehaleh | 18.6% | 3.4%(+15.2)#22 | 3.9%(+14.7)#1,273 |
| 23. | Liberty Lake | 18.5% | 3.4%(+15.1)#23 | 3.9%(+14.6)#1,277 |
| 24. | Rocky Point | 18.3% | 3.4%(+14.9)#24 | 3.9%(+14.4)#1,304 |
| 25. | Mansfield | 17.3% | 3.4%(+13.9)#25 | 3.9%(+13.4)#1,406 |
| 26. | Bothell East | 15.9% | 3.4%(+12.5)#26 | 3.9%(+12.0)#1,573 |
| 27. | Kitsap Lake | 15.9% | 3.4%(+12.5)#27 | 3.9%(+12.0)#1,579 |
| 28. | Deer Park | 15.7% | 3.4%(+12.3)#28 | 3.9%(+11.8)#1,596 |
| 29. | Erlands Point | 15.5% | 3.4%(+12.1)#29 | 3.9%(+11.6)#1,624 |
| 30. | Dash Point | 15.0% | 3.4%(+11.6)#30 | 3.9%(+11.1)#1,680 |
| 31. | Fobes Hill | 14.8% | 3.4%(+11.4)#31 | 3.9%(+10.9)#1,701 |
| 32. | Allyn | 14.8% | 3.4%(+11.4)#32 | 3.9%(+10.9)#1,702 |
| 33. | Harrah | 14.3% | 3.4%(+10.9)#33 | 3.9%(+10.4)#1,743 |
| 34. | Colfax | 14.2% | 3.4%(+10.8)#34 | 3.9%(+10.3)#1,757 |
| 35. | Medina | 14.1% | 3.4%(+10.7)#35 | 3.9%(+10.2)#1,800 |
| 36. | Pullman | 14.0% | 3.4%(+10.6)#36 | 3.9%(+10.1)#1,802 |
| 37. | Benton City | 13.9% | 3.4%(+10.5)#37 | 3.9%(+10.00)#1,814 |
| 38. | St John | 13.7% | 3.4%(+10.3)#38 | 3.9%(+9.80)#1,846 |
| 39. | Seatac | 13.6% | 3.4%(+10.2)#39 | 3.9%(+9.70)#1,848 |
| 40. | Minnehaha | 13.5% | 3.4%(+10.1)#40 | 3.9%(+9.60)#1,864 |
| 41. | Camas | 13.3% | 3.4%(+9.90)#41 | 3.9%(+9.40)#1,888 |
| 42. | Entiat | 13.3% | 3.4%(+9.90)#42 | 3.9%(+9.40)#1,896 |
| 43. | College Place | 13.2% | 3.4%(+9.80)#43 | 3.9%(+9.30)#1,912 |
| 44. | Geneva | 13.2% | 3.4%(+9.80)#44 | 3.9%(+9.30)#1,918 |
| 45. | Yakima | 12.9% | 3.4%(+9.50)#45 | 3.9%(+9.00)#1,947 |
| 46. | Starbuck | 12.5% | 3.4%(+9.10)#46 | 3.9%(+8.60)#2,027 |
| 47. | Lake Shore | 12.4% | 3.4%(+9.00)#47 | 3.9%(+8.50)#2,037 |
| 48. | Rochester | 12.2% | 3.4%(+8.80)#48 | 3.9%(+8.30)#2,088 |
| 49. | Winlock | 11.3% | 3.4%(+7.90)#49 | 3.9%(+7.40)#2,242 |
| 50. | Stanwood | 11.1% | 3.4%(+7.70)#50 | 3.9%(+7.20)#2,268 |
| 51. | Sedro Woolley | 10.9% | 3.4%(+7.50)#51 | 3.9%(+7.00)#2,334 |
| 52. | Meadow Glade | 10.4% | 3.4%(+7.00)#52 | 3.9%(+6.50)#2,437 |
| 53. | Ridgefield | 10.2% | 3.4%(+6.80)#53 | 3.9%(+6.30)#2,482 |
| 54. | Ritzville | 10.1% | 3.4%(+6.70)#54 | 3.9%(+6.20)#2,527 |
| 55. | Toppenish | 10.0% | 3.4%(+6.60)#55 | 3.9%(+6.10)#2,536 |
| 56. | Palouse | 10.0% | 3.4%(+6.60)#56 | 3.9%(+6.10)#2,552 |
| 57. | Loon Lake | 10.0% | 3.4%(+6.60)#57 | 3.9%(+6.10)#2,555 |
| 58. | Garfield | 9.9% | 3.4%(+6.50)#58 | 3.9%(+6.00)#2,584 |
| 59. | Cosmopolis | 9.7% | 3.4%(+6.30)#59 | 3.9%(+5.80)#2,637 |
| 60. | Kent | 9.3% | 3.4%(+5.90)#60 | 3.9%(+5.40)#2,736 |
| 61. | Tukwila | 9.3% | 3.4%(+5.90)#61 | 3.9%(+5.40)#2,742 |
| 62. | Canterwood | 9.3% | 3.4%(+5.90)#62 | 3.9%(+5.40)#2,761 |
| 63. | Lake Stickney | 9.1% | 3.4%(+5.70)#63 | 3.9%(+5.20)#2,808 |
| 64. | Duvall | 9.1% | 3.4%(+5.70)#64 | 3.9%(+5.20)#2,814 |
| 65. | Farmington | 9.0% | 3.4%(+5.60)#65 | 3.9%(+5.10)#2,882 |
| 66. | Asotin | 8.8% | 3.4%(+5.40)#66 | 3.9%(+4.90)#2,935 |
| 67. | Endicott | 8.3% | 3.4%(+4.90)#67 | 3.9%(+4.40)#3,108 |
| 68. | Pasco | 8.0% | 3.4%(+4.60)#68 | 3.9%(+4.10)#3,178 |
| 69. | Woodway | 8.0% | 3.4%(+4.60)#69 | 3.9%(+4.10)#3,206 |
| 70. | Mirrormont | 7.9% | 3.4%(+4.50)#70 | 3.9%(+4.00)#3,235 |
| 71. | Monroe | 7.8% | 3.4%(+4.40)#71 | 3.9%(+3.90)#3,261 |
| 72. | University Place | 7.4% | 3.4%(+4.00)#72 | 3.9%(+3.50)#3,406 |
| 73. | Walla Walla | 7.4% | 3.4%(+4.00)#73 | 3.9%(+3.50)#3,407 |
| 74. | Salmon Creek | 6.8% | 3.4%(+3.40)#74 | 3.9%(+2.90)#3,654 |
| 75. | Auburn | 6.6% | 3.4%(+3.20)#75 | 3.9%(+2.70)#3,722 |
| 76. | Lakeland South | 6.6% | 3.4%(+3.20)#76 | 3.9%(+2.70)#3,740 |
| 77. | Prairie Ridge | 6.6% | 3.4%(+3.20)#77 | 3.9%(+2.70)#3,741 |
| 78. | Zillah | 6.5% | 3.4%(+3.10)#78 | 3.9%(+2.60)#3,829 |
| 79. | Mount Vernon | 6.4% | 3.4%(+3.00)#79 | 3.9%(+2.50)#3,846 |
| 80. | Town And Country | 6.4% | 3.4%(+3.00)#80 | 3.9%(+2.50)#3,881 |
| 81. | Suquamish | 6.3% | 3.4%(+2.90)#81 | 3.9%(+2.40)#3,934 |
| 82. | Spokane | 6.2% | 3.4%(+2.80)#82 | 3.9%(+2.30)#3,944 |
| 83. | Woodinville | 6.2% | 3.4%(+2.80)#83 | 3.9%(+2.30)#3,963 |
| 84. | Vashon | 6.2% | 3.4%(+2.80)#84 | 3.9%(+2.30)#3,967 |
| 85. | Covington | 6.1% | 3.4%(+2.70)#85 | 3.9%(+2.20)#4,028 |
| 86. | Colville | 6.1% | 3.4%(+2.70)#86 | 3.9%(+2.20)#4,043 |
| 87. | Silver Firs | 5.9% | 3.4%(+2.50)#87 | 3.9%(+2.00)#4,131 |
| 88. | Shadow Lake | 5.6% | 3.4%(+2.20)#88 | 3.9%(+1.70)#4,311 |
| 89. | Kenmore | 5.5% | 3.4%(+2.10)#89 | 3.9%(+1.60)#4,329 |
| 90. | Rockford | 5.5% | 3.4%(+2.10)#90 | 3.9%(+1.60)#4,366 |
| 91. | Silverdale | 5.4% | 3.4%(+2.00)#91 | 3.9%(+1.50)#4,391 |
| 92. | Clover Creek | 5.2% | 3.4%(+1.80)#92 | 3.9%(+1.30)#4,523 |
| 93. | Issaquah | 5.1% | 3.4%(+1.70)#93 | 3.9%(+1.20)#4,568 |
| 94. | Edmonds | 5.0% | 3.4%(+1.60)#94 | 3.9%(+1.10)#4,640 |
| 95. | Bonney Lake | 4.9% | 3.4%(+1.50)#95 | 3.9%(+1.00)#4,711 |
| 96. | White Center | 4.8% | 3.4%(+1.40)#96 | 3.9%(+0.900)#4,767 |
| 97. | Martha Lake | 4.6% | 3.4%(+1.20)#97 | 3.9%(+0.700)#4,906 |
| 98. | Renton | 4.4% | 3.4%(+1.00)#98 | 3.9%(+0.500)#5,045 |
| 99. | North Lynnwood | 4.4% | 3.4%(+1.00)#99 | 3.9%(+0.500)#5,059 |
| 100. | Gig Harbor | 4.4% | 3.4%(+1.00)#100 | 3.9%(+0.500)#5,077 |
Common Questions
What are the Top 10 Cities with the Highest Unemployment Rate Amomg Seniors Over the Age of 65 in Washington?
Top 10 Cities with the Highest Unemployment Rate Amomg Seniors Over the Age of 65 in Washington are:
#1
100.0%
#2
99.9%
#3
51.7%
#4
31.6%
#5
28.7%
#6
28.6%
#7
27.9%
#8
27.8%
#9
27.5%
#10
25.7%
What city has the Highest Unemployment Rate Amomg Seniors Over the Age of 65 in Washington?
Custer has the Highest Unemployment Rate Amomg Seniors Over the Age of 65 in Washington with 100.0%.
What is the Unemployment Rate Amomg Seniors Over the Age of 65 in the State of Washington?
Unemployment Rate Amomg Seniors Over the Age of 65 in Washington is 3.4%.
What is the Unemployment Rate Amomg Seniors Over the Age of 65 in the United States?
Unemployment Rate Amomg Seniors Over the Age of 65 in the United States is 3.9%.