Cities with the Highest Percentage of Immigrants from El Salvador in Washington
RELATED REPORTS & OPTIONS
El Salvador
Washington
Compare Cities
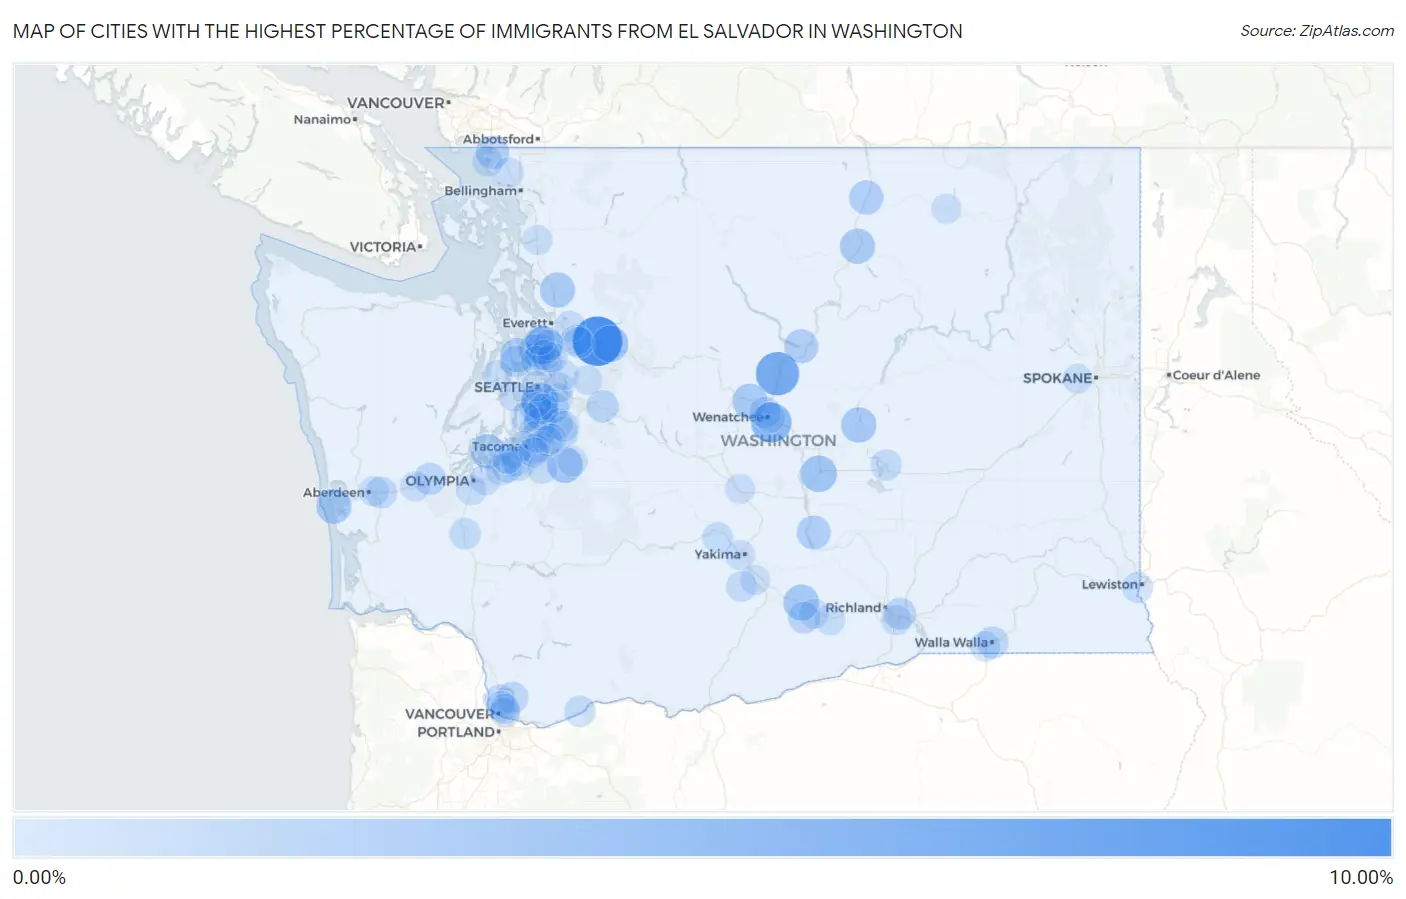
Map of Cities with the Highest Percentage of Immigrants from El Salvador in Washington
0.00%
10.00%
Cities with the Highest Percentage of Immigrants from El Salvador in Washington
| City | El Salvador | vs State | vs National | |
| 1. | Sultan | 8.00% | 0.18%(+7.82)#-1 | 0.43%(+7.58)#0 |
| 2. | Entiat | 5.39% | 0.18%(+5.22)#0 | 0.43%(+4.97)#1 |
| 3. | South Wenatchee | 4.10% | 0.18%(+3.93)#1 | 0.43%(+3.68)#2 |
| 4. | North Lynnwood | 3.11% | 0.18%(+2.93)#2 | 0.43%(+2.68)#3 |
| 5. | Boulevard Park | 2.77% | 0.18%(+2.59)#3 | 0.43%(+2.34)#4 |
| 6. | Gold Bar | 2.61% | 0.18%(+2.43)#4 | 0.43%(+2.18)#5 |
| 7. | George | 2.58% | 0.18%(+2.40)#5 | 0.43%(+2.15)#6 |
| 8. | Sunnyside | 2.28% | 0.18%(+2.11)#6 | 0.43%(+1.86)#7 |
| 9. | South Prairie | 2.27% | 0.18%(+2.09)#7 | 0.43%(+1.84)#8 |
| 10. | Lakeview | 2.14% | 0.18%(+1.96)#8 | 0.43%(+1.72)#9 |
| 11. | Westport | 2.04% | 0.18%(+1.86)#9 | 0.43%(+1.62)#10 |
| 12. | Cashmere | 2.03% | 0.18%(+1.86)#10 | 0.43%(+1.61)#11 |
| 13. | Arlington | 2.03% | 0.18%(+1.85)#11 | 0.43%(+1.61)#12 |
| 14. | Omak | 2.03% | 0.18%(+1.85)#12 | 0.43%(+1.60)#13 |
| 15. | Kingston | 1.73% | 0.18%(+1.56)#13 | 0.43%(+1.31)#14 |
| 16. | Longbranch | 1.69% | 0.18%(+1.51)#14 | 0.43%(+1.27)#15 |
| 17. | Tonasket | 1.64% | 0.18%(+1.47)#15 | 0.43%(+1.22)#16 |
| 18. | Chelan | 1.59% | 0.18%(+1.41)#16 | 0.43%(+1.17)#17 |
| 19. | Mattawa | 1.54% | 0.18%(+1.36)#17 | 0.43%(+1.11)#18 |
| 20. | Seatac | 1.39% | 0.18%(+1.21)#18 | 0.43%(+0.968)#497 |
| 21. | Blaine | 1.36% | 0.18%(+1.19)#19 | 0.43%(+0.939)#498 |
| 22. | Burien | 1.11% | 0.18%(+0.928)#25 | 0.43%(+0.681)#1,750 |
| 23. | Des Moines | 1.09% | 0.18%(+0.908)#26 | 0.43%(+0.661)#1,751 |
| 24. | Edmonds | 0.96% | 0.18%(+0.777)#27 | 0.43%(+0.530)#1,752 |
| 25. | North Bend | 0.95% | 0.18%(+0.775)#28 | 0.43%(+0.528)#1,753 |
| 26. | Walla Walla | 0.82% | 0.18%(+0.637)#29 | 0.43%(+0.390)#1,754 |
| 27. | Pasco | 0.80% | 0.18%(+0.621)#30 | 0.43%(+0.374)#1,755 |
| 28. | Mccleary | 0.78% | 0.18%(+0.604)#31 | 0.43%(+0.358)#1,756 |
| 29. | Mabton | 0.78% | 0.18%(+0.599)#32 | 0.43%(+0.353)#1,757 |
| 30. | Wenatchee | 0.71% | 0.18%(+0.528)#33 | 0.43%(+0.282)#1,758 |
| 31. | Indianola | 0.70% | 0.18%(+0.525)#34 | 0.43%(+0.278)#1,759 |
| 32. | Brush Prairie | 0.65% | 0.18%(+0.469)#35 | 0.43%(+0.223)#1,760 |
| 33. | Central Park | 0.64% | 0.18%(+0.465)#36 | 0.43%(+0.219)#1,761 |
| 34. | Federal Way | 0.58% | 0.18%(+0.397)#37 | 0.43%(+0.151)#1,762 |
| 35. | Newcastle | 0.55% | 0.18%(+0.370)#38 | 0.43%(+0.124)#1,763 |
| 36. | Centralia | 0.53% | 0.18%(+0.348)#39 | 0.43%(+0.101)#1,764 |
| 37. | North Bonneville | 0.52% | 0.18%(+0.345)#40 | 0.43%(+0.098)#1,765 |
| 38. | Mcchord Afb | 0.52% | 0.18%(+0.339)#41 | 0.43%(+0.092)#1,766 |
| 39. | Lake Morton Berrydale | 0.52% | 0.18%(+0.338)#42 | 0.43%(+0.091)#1,767 |
| 40. | Moses Lake | 0.50% | 0.18%(+0.318)#43 | 0.43%(+0.072)#1,768 |
| 41. | Salmon Creek | 0.47% | 0.18%(+0.289)#44 | 0.43%(+0.042)#1,769 |
| 42. | West Clarkston Highland | 0.44% | 0.18%(+0.265)#45 | 0.43%(+0.019)#1,770 |
| 43. | Everett | 0.43% | 0.18%(+0.249)#46 | 0.43%(+0.002)#1,771 |
| 44. | Kent | 0.40% | 0.18%(+0.221)#47 | 0.43%(-0.025)#1,772 |
| 45. | Renton | 0.40% | 0.18%(+0.217)#48 | 0.43%(-0.030)#1,773 |
| 46. | Tieton | 0.39% | 0.18%(+0.209)#49 | 0.43%(-0.037)#1,774 |
| 47. | Mountlake Terrace | 0.38% | 0.18%(+0.205)#50 | 0.43%(-0.041)#1,775 |
| 48. | Monroe North | 0.37% | 0.18%(+0.194)#51 | 0.43%(-0.053)#1,776 |
| 49. | Monroe | 0.37% | 0.18%(+0.188)#52 | 0.43%(-0.059)#1,777 |
| 50. | Dupont | 0.35% | 0.18%(+0.173)#53 | 0.43%(-0.074)#1,778 |
| 51. | Covington | 0.35% | 0.18%(+0.172)#54 | 0.43%(-0.075)#1,779 |
| 52. | Hazel Dell | 0.34% | 0.18%(+0.160)#55 | 0.43%(-0.086)#1,780 |
| 53. | Buckley | 0.33% | 0.18%(+0.149)#56 | 0.43%(-0.098)#1,781 |
| 54. | East Wenatchee | 0.32% | 0.18%(+0.141)#57 | 0.43%(-0.105)#1,782 |
| 55. | Harrah | 0.31% | 0.18%(+0.134)#58 | 0.43%(-0.113)#1,783 |
| 56. | Lynnwood | 0.30% | 0.18%(+0.120)#59 | 0.43%(-0.127)#1,784 |
| 57. | Birch Bay | 0.29% | 0.18%(+0.108)#60 | 0.43%(-0.138)#1,785 |
| 58. | Kenmore | 0.28% | 0.18%(+0.097)#61 | 0.43%(-0.150)#1,786 |
| 59. | University Place | 0.27% | 0.18%(+0.092)#62 | 0.43%(-0.154)#1,787 |
| 60. | Prosser | 0.26% | 0.18%(+0.082)#63 | 0.43%(-0.165)#1,788 |
| 61. | Kennewick | 0.26% | 0.18%(+0.078)#64 | 0.43%(-0.169)#1,789 |
| 62. | Tacoma | 0.24% | 0.18%(+0.066)#65 | 0.43%(-0.180)#1,790 |
| 63. | Milton | 0.23% | 0.18%(+0.055)#66 | 0.43%(-0.191)#1,791 |
| 64. | North Fort Lewis | 0.23% | 0.18%(+0.054)#67 | 0.43%(-0.193)#1,792 |
| 65. | Fife | 0.23% | 0.18%(+0.051)#68 | 0.43%(-0.196)#1,793 |
| 66. | Auburn | 0.23% | 0.18%(+0.048)#69 | 0.43%(-0.199)#1,794 |
| 67. | White Center | 0.23% | 0.18%(+0.047)#70 | 0.43%(-0.199)#1,795 |
| 68. | Martha Lake | 0.22% | 0.18%(+0.045)#71 | 0.43%(-0.202)#1,796 |
| 69. | Algona | 0.21% | 0.18%(+0.036)#72 | 0.43%(-0.211)#1,797 |
| 70. | Tumwater | 0.21% | 0.18%(+0.032)#73 | 0.43%(-0.215)#1,798 |
| 71. | College Place | 0.20% | 0.18%(+0.025)#74 | 0.43%(-0.221)#1,799 |
| 72. | Lakewood | 0.20% | 0.18%(+0.022)#75 | 0.43%(-0.224)#1,800 |
| 73. | Wapato | 0.20% | 0.18%(+0.017)#76 | 0.43%(-0.230)#1,801 |
| 74. | Waller | 0.19% | 0.18%(+0.009)#77 | 0.43%(-0.238)#1,802 |
| 75. | Lacey | 0.18% | 0.18%(+0.006)#78 | 0.43%(-0.241)#1,803 |
| 76. | Manchester | 0.18% | 0.18%(+0.004)#79 | 0.43%(-0.243)#1,804 |
| 77. | Yakima | 0.18% | 0.18%(+0.002)#80 | 0.43%(-0.245)#1,805 |
| 78. | South Hill | 0.18% | 0.18%(-0.000)#81 | 0.43%(-0.247)#1,806 |
| 79. | Elma | 0.18% | 0.18%(-0.004)#82 | 0.43%(-0.250)#1,807 |
| 80. | Shoreline | 0.17% | 0.18%(-0.005)#83 | 0.43%(-0.252)#1,808 |
| 81. | Aberdeen | 0.17% | 0.18%(-0.008)#84 | 0.43%(-0.254)#1,809 |
| 82. | Brier | 0.17% | 0.18%(-0.011)#85 | 0.43%(-0.257)#1,810 |
| 83. | Steilacoom | 0.16% | 0.18%(-0.014)#86 | 0.43%(-0.261)#1,811 |
| 84. | Burlington | 0.15% | 0.18%(-0.029)#87 | 0.43%(-0.276)#1,812 |
| 85. | Bellevue | 0.15% | 0.18%(-0.030)#88 | 0.43%(-0.277)#1,847 |
| 86. | Grandview | 0.14% | 0.18%(-0.041)#89 | 0.43%(-0.288)#1,848 |
| 87. | Silverdale | 0.13% | 0.18%(-0.046)#90 | 0.43%(-0.292)#1,849 |
| 88. | Vancouver | 0.13% | 0.18%(-0.050)#91 | 0.43%(-0.296)#1,850 |
| 89. | Seattle | 0.13% | 0.18%(-0.053)#92 | 0.43%(-0.299)#1,851 |
| 90. | Ferndale | 0.13% | 0.18%(-0.053)#93 | 0.43%(-0.300)#1,852 |
| 91. | Redmond | 0.12% | 0.18%(-0.062)#94 | 0.43%(-0.309)#1,853 |
| 92. | Bothell | 0.11% | 0.18%(-0.066)#95 | 0.43%(-0.313)#1,854 |
| 93. | Tukwila | 0.11% | 0.18%(-0.068)#96 | 0.43%(-0.314)#1,855 |
| 94. | Vashon | 0.10% | 0.18%(-0.078)#97 | 0.43%(-0.325)#1,856 |
| 95. | Minnehaha | 0.095% | 0.18%(-0.084)#98 | 0.43%(-0.330)#1,857 |
| 96. | Ellensburg | 0.095% | 0.18%(-0.084)#99 | 0.43%(-0.331)#1,858 |
| 97. | Republic | 0.089% | 0.18%(-0.089)#100 | 0.43%(-0.336)#1,859 |
| 98. | Picnic Point | 0.080% | 0.18%(-0.098)#101 | 0.43%(-0.345)#1,860 |
| 99. | Carnation | 0.080% | 0.18%(-0.099)#102 | 0.43%(-0.346)#1,861 |
| 100. | Airway Heights | 0.076% | 0.18%(-0.103)#103 | 0.43%(-0.350)#1,862 |
Common Questions
What are the Top 10 Cities with the Highest Percentage of Immigrants from El Salvador in Washington?
Top 10 Cities with the Highest Percentage of Immigrants from El Salvador in Washington are:
#1
8.00%
#2
5.39%
#3
4.10%
#4
3.11%
#5
2.77%
#6
2.61%
#7
2.58%
#8
2.28%
#9
2.27%
#10
2.14%
What city has the Highest Percentage of Immigrants from El Salvador in Washington?
Sultan has the Highest Percentage of Immigrants from El Salvador in Washington with 8.00%.
What is the Percentage of Immigrants from El Salvador in the State of Washington?
Percentage of Immigrants from El Salvador in Washington is 0.18%.
What is the Percentage of Immigrants from El Salvador in the United States?
Percentage of Immigrants from El Salvador in the United States is 0.43%.