Cities with the Highest Percentage of Lebanese Population in Washington
RELATED REPORTS & OPTIONS
Lebanese
Washington
Compare Cities
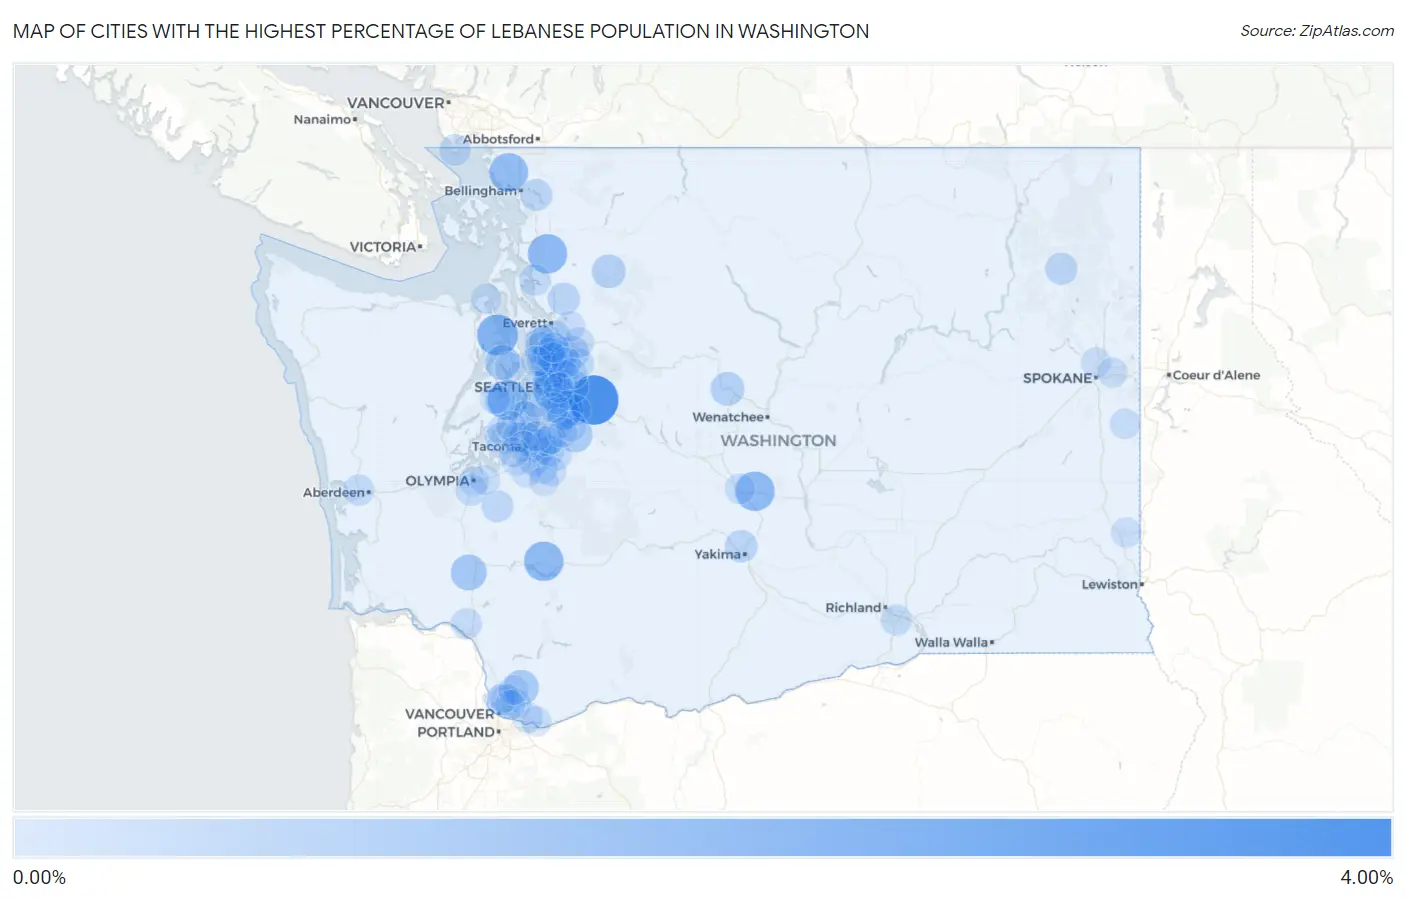
Map of Cities with the Highest Percentage of Lebanese Population in Washington
0.00%
4.00%
Cities with the Highest Percentage of Lebanese Population in Washington
| City | Lebanese | vs State | vs National | |
| 1. | Snoqualmie | 3.41% | 0.11%(+3.29)#1 | 0.17%(+3.24)#82 |
| 2. | Port Ludlow | 1.91% | 0.11%(+1.79)#2 | 0.17%(+1.74)#221 |
| 3. | Parkwood | 1.73% | 0.11%(+1.61)#3 | 0.17%(+1.56)#264 |
| 4. | Morton | 1.65% | 0.11%(+1.54)#4 | 0.17%(+1.49)#286 |
| 5. | Kittitas | 1.64% | 0.11%(+1.53)#5 | 0.17%(+1.47)#289 |
| 6. | Big Lake | 1.63% | 0.11%(+1.52)#6 | 0.17%(+1.47)#290 |
| 7. | Beaux Arts Village | 1.55% | 0.11%(+1.44)#7 | 0.17%(+1.39)#315 |
| 8. | Ferndale | 1.54% | 0.11%(+1.43)#8 | 0.17%(+1.37)#318 |
| 9. | East Renton Highlands | 1.16% | 0.11%(+1.04)#9 | 0.17%(+0.994)#482 |
| 10. | Winlock | 1.02% | 0.11%(+0.907)#10 | 0.17%(+0.856)#569 |
| 11. | Venersborg | 0.90% | 0.11%(+0.788)#11 | 0.17%(+0.737)#670 |
| 12. | Poulsbo | 0.89% | 0.11%(+0.774)#12 | 0.17%(+0.723)#686 |
| 13. | Sammamish | 0.85% | 0.11%(+0.733)#13 | 0.17%(+0.682)#725 |
| 14. | Black Diamond | 0.85% | 0.11%(+0.733)#14 | 0.17%(+0.682)#727 |
| 15. | Kenmore | 0.73% | 0.11%(+0.619)#15 | 0.17%(+0.568)#869 |
| 16. | Leavenworth | 0.69% | 0.11%(+0.573)#16 | 0.17%(+0.522)#934 |
| 17. | Milton | 0.66% | 0.11%(+0.541)#17 | 0.17%(+0.490)#999 |
| 18. | Swede Heaven | 0.64% | 0.11%(+0.527)#18 | 0.17%(+0.476)#1,025 |
| 19. | Lake Stickney | 0.61% | 0.11%(+0.493)#19 | 0.17%(+0.442)#1,083 |
| 20. | Lynnwood | 0.59% | 0.11%(+0.475)#20 | 0.17%(+0.424)#1,113 |
| 21. | Vashon | 0.57% | 0.11%(+0.453)#21 | 0.17%(+0.402)#1,165 |
| 22. | High Bridge | 0.56% | 0.11%(+0.443)#22 | 0.17%(+0.392)#1,189 |
| 23. | Yarrow Point | 0.55% | 0.11%(+0.433)#23 | 0.17%(+0.382)#1,216 |
| 24. | Woodinville | 0.50% | 0.11%(+0.382)#24 | 0.17%(+0.331)#1,329 |
| 25. | Artondale | 0.48% | 0.11%(+0.369)#25 | 0.17%(+0.318)#1,376 |
| 26. | Sisco Heights | 0.47% | 0.11%(+0.357)#26 | 0.17%(+0.306)#1,412 |
| 27. | Selah | 0.46% | 0.11%(+0.349)#27 | 0.17%(+0.298)#1,442 |
| 28. | Maple Heights Lake Desire | 0.44% | 0.11%(+0.322)#28 | 0.17%(+0.271)#1,532 |
| 29. | Kirkland | 0.43% | 0.11%(+0.321)#29 | 0.17%(+0.270)#1,540 |
| 30. | Chewelah | 0.40% | 0.11%(+0.285)#30 | 0.17%(+0.234)#1,684 |
| 31. | Sudden Valley | 0.39% | 0.11%(+0.280)#31 | 0.17%(+0.229)#1,702 |
| 32. | Fife Heights | 0.38% | 0.11%(+0.267)#32 | 0.17%(+0.216)#1,751 |
| 33. | Rainier | 0.37% | 0.11%(+0.255)#33 | 0.17%(+0.204)#1,804 |
| 34. | Browns Point | 0.36% | 0.11%(+0.251)#34 | 0.17%(+0.199)#1,829 |
| 35. | Bothell West | 0.36% | 0.11%(+0.246)#35 | 0.17%(+0.195)#1,844 |
| 36. | Point Roberts | 0.32% | 0.11%(+0.206)#36 | 0.17%(+0.155)#2,053 |
| 37. | Tumwater | 0.31% | 0.11%(+0.198)#37 | 0.17%(+0.147)#2,096 |
| 38. | Stanwood | 0.29% | 0.11%(+0.172)#38 | 0.17%(+0.121)#2,257 |
| 39. | Normandy Park | 0.28% | 0.11%(+0.170)#39 | 0.17%(+0.119)#2,270 |
| 40. | Maltby | 0.27% | 0.11%(+0.159)#40 | 0.17%(+0.108)#2,332 |
| 41. | Mirrormont | 0.27% | 0.11%(+0.154)#41 | 0.17%(+0.103)#2,361 |
| 42. | Longview Heights | 0.26% | 0.11%(+0.148)#42 | 0.17%(+0.097)#2,397 |
| 43. | Lake Forest Park | 0.25% | 0.11%(+0.138)#43 | 0.17%(+0.087)#2,468 |
| 44. | Kennewick | 0.25% | 0.11%(+0.138)#44 | 0.17%(+0.087)#2,473 |
| 45. | Eastmont | 0.25% | 0.11%(+0.132)#45 | 0.17%(+0.081)#2,524 |
| 46. | Barberton | 0.24% | 0.11%(+0.125)#46 | 0.17%(+0.074)#2,574 |
| 47. | Bonney Lake | 0.23% | 0.11%(+0.120)#47 | 0.17%(+0.069)#2,607 |
| 48. | Newcastle | 0.23% | 0.11%(+0.118)#48 | 0.17%(+0.067)#2,633 |
| 49. | Hoquiam | 0.23% | 0.11%(+0.115)#49 | 0.17%(+0.064)#2,658 |
| 50. | Duvall | 0.22% | 0.11%(+0.107)#50 | 0.17%(+0.056)#2,723 |
| 51. | Summit | 0.22% | 0.11%(+0.101)#51 | 0.17%(+0.050)#2,783 |
| 52. | Rosedale | 0.21% | 0.11%(+0.097)#52 | 0.17%(+0.045)#2,825 |
| 53. | Sumner | 0.21% | 0.11%(+0.094)#53 | 0.17%(+0.043)#2,854 |
| 54. | Monroe | 0.20% | 0.11%(+0.085)#54 | 0.17%(+0.034)#2,934 |
| 55. | Seattle | 0.18% | 0.11%(+0.071)#55 | 0.17%(+0.020)#3,073 |
| 56. | Suquamish | 0.18% | 0.11%(+0.071)#56 | 0.17%(+0.020)#3,074 |
| 57. | Kent | 0.18% | 0.11%(+0.068)#57 | 0.17%(+0.017)#3,098 |
| 58. | Picnic Point | 0.18% | 0.11%(+0.067)#58 | 0.17%(+0.016)#3,116 |
| 59. | Camas | 0.17% | 0.11%(+0.053)#59 | 0.17%(+0.002)#3,261 |
| 60. | Fairfield | 0.16% | 0.11%(+0.049)#60 | 0.17%(-0.002)#3,306 |
| 61. | Union Hill Novelty Hill | 0.16% | 0.11%(+0.046)#61 | 0.17%(-0.005)#3,337 |
| 62. | Ellensburg | 0.16% | 0.11%(+0.044)#62 | 0.17%(-0.007)#3,357 |
| 63. | Ruston | 0.16% | 0.11%(+0.043)#63 | 0.17%(-0.008)#3,359 |
| 64. | Port Townsend | 0.14% | 0.11%(+0.024)#64 | 0.17%(-0.027)#3,566 |
| 65. | Medina | 0.14% | 0.11%(+0.023)#65 | 0.17%(-0.028)#3,577 |
| 66. | Salmon Creek | 0.13% | 0.11%(+0.019)#66 | 0.17%(-0.032)#3,624 |
| 67. | South Hill | 0.13% | 0.11%(+0.019)#67 | 0.17%(-0.032)#3,627 |
| 68. | Pullman | 0.13% | 0.11%(+0.017)#68 | 0.17%(-0.034)#3,648 |
| 69. | Maplewood | 0.13% | 0.11%(+0.013)#69 | 0.17%(-0.038)#3,687 |
| 70. | Port Orchard | 0.13% | 0.11%(+0.012)#70 | 0.17%(-0.039)#3,691 |
| 71. | Auburn | 0.12% | 0.11%(+0.010)#71 | 0.17%(-0.041)#3,720 |
| 72. | Algona | 0.12% | 0.11%(+0.008)#72 | 0.17%(-0.043)#3,731 |
| 73. | Tacoma | 0.12% | 0.11%(+0.007)#73 | 0.17%(-0.044)#3,744 |
| 74. | Maple Valley | 0.12% | 0.11%(+0.004)#74 | 0.17%(-0.047)#3,771 |
| 75. | Orchards | 0.11% | 0.11%(-0.001)#75 | 0.17%(-0.052)#3,832 |
| 76. | Redmond | 0.11% | 0.11%(-0.002)#76 | 0.17%(-0.053)#3,835 |
| 77. | Country Homes | 0.11% | 0.11%(-0.002)#77 | 0.17%(-0.053)#3,843 |
| 78. | Federal Way | 0.11% | 0.11%(-0.005)#78 | 0.17%(-0.056)#3,874 |
| 79. | Bremerton | 0.11% | 0.11%(-0.007)#79 | 0.17%(-0.058)#3,907 |
| 80. | Shoreline | 0.11% | 0.11%(-0.008)#80 | 0.17%(-0.059)#3,926 |
| 81. | Millwood | 0.10% | 0.11%(-0.010)#81 | 0.17%(-0.062)#3,945 |
| 82. | Washougal | 0.10% | 0.11%(-0.013)#82 | 0.17%(-0.064)#3,976 |
| 83. | Everett | 0.10% | 0.11%(-0.014)#83 | 0.17%(-0.065)#3,988 |
| 84. | Bothell | 0.098% | 0.11%(-0.016)#84 | 0.17%(-0.067)#4,013 |
| 85. | Orting | 0.090% | 0.11%(-0.024)#85 | 0.17%(-0.075)#4,103 |
| 86. | White Center | 0.084% | 0.11%(-0.030)#86 | 0.17%(-0.081)#4,182 |
| 87. | Olympia | 0.083% | 0.11%(-0.031)#87 | 0.17%(-0.082)#4,193 |
| 88. | Spanaway | 0.082% | 0.11%(-0.032)#88 | 0.17%(-0.083)#4,207 |
| 89. | Renton | 0.079% | 0.11%(-0.035)#89 | 0.17%(-0.086)#4,252 |
| 90. | Lakewood | 0.078% | 0.11%(-0.037)#90 | 0.17%(-0.088)#4,262 |
| 91. | Cottage Lake | 0.077% | 0.11%(-0.037)#91 | 0.17%(-0.088)#4,264 |
| 92. | Mount Vista | 0.077% | 0.11%(-0.037)#92 | 0.17%(-0.088)#4,268 |
| 93. | Lake Morton Berrydale | 0.077% | 0.11%(-0.038)#93 | 0.17%(-0.089)#4,275 |
| 94. | Five Corners | 0.076% | 0.11%(-0.038)#94 | 0.17%(-0.089)#4,276 |
| 95. | Mill Creek East | 0.075% | 0.11%(-0.039)#95 | 0.17%(-0.090)#4,290 |
| 96. | University Place | 0.075% | 0.11%(-0.039)#96 | 0.17%(-0.090)#4,291 |
| 97. | Lacey | 0.073% | 0.11%(-0.041)#97 | 0.17%(-0.092)#4,317 |
| 98. | Battle Ground | 0.072% | 0.11%(-0.042)#98 | 0.17%(-0.093)#4,334 |
| 99. | Graham | 0.069% | 0.11%(-0.045)#99 | 0.17%(-0.096)#4,371 |
| 100. | Bellevue | 0.067% | 0.11%(-0.047)#100 | 0.17%(-0.098)#4,407 |
Common Questions
What are the Top 10 Cities with the Highest Percentage of Lebanese Population in Washington?
Top 10 Cities with the Highest Percentage of Lebanese Population in Washington are:
#1
3.41%
#2
1.91%
#3
1.73%
#4
1.65%
#5
1.64%
#6
1.63%
#7
1.55%
#8
1.54%
#9
1.16%
#10
1.02%
What city has the Highest Percentage of Lebanese Population in Washington?
Snoqualmie has the Highest Percentage of Lebanese Population in Washington with 3.41%.
What is the Percentage of Lebanese Population in the State of Washington?
Percentage of Lebanese Population in Washington is 0.11%.
What is the Percentage of Lebanese Population in the United States?
Percentage of Lebanese Population in the United States is 0.17%.