Cities with the Highest Percentage of Immigrants from Korea in Washington
RELATED REPORTS & OPTIONS
Korea
Washington
Compare Cities
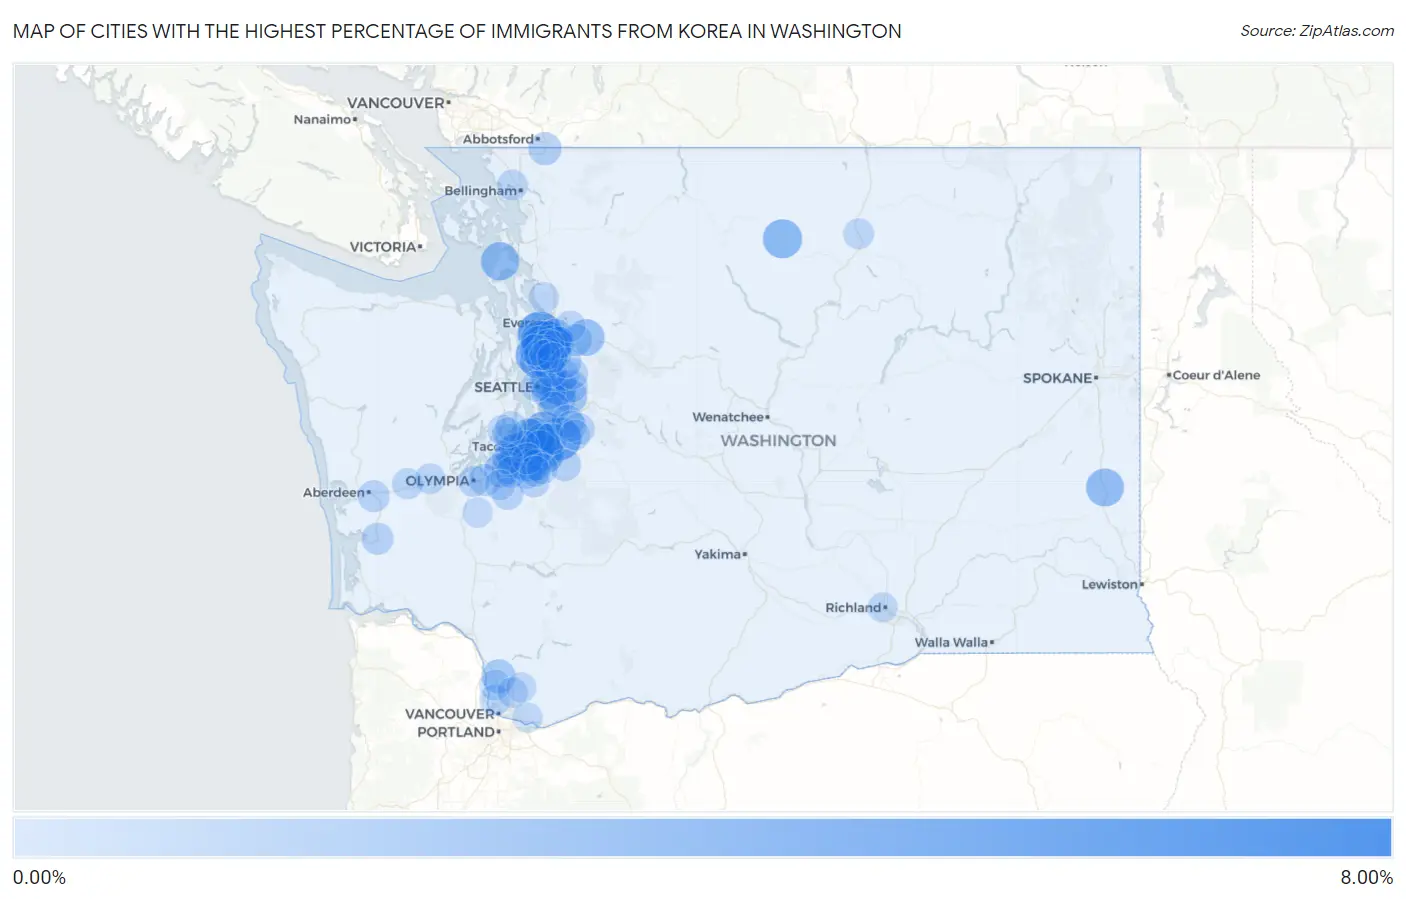
Map of Cities with the Highest Percentage of Immigrants from Korea in Washington
0.00%
8.00%
Cities with the Highest Percentage of Immigrants from Korea in Washington
| City | Korea | vs State | vs National | |
| 1. | Larch Way | 6.93% | 0.64%(+6.30)#1 | 0.31%(+6.62)#57 |
| 2. | Mukilteo | 5.21% | 0.64%(+4.58)#2 | 0.31%(+4.90)#93 |
| 3. | Lake Holm | 4.57% | 0.64%(+3.94)#3 | 0.31%(+4.26)#113 |
| 4. | Esperance | 4.15% | 0.64%(+3.51)#4 | 0.31%(+3.83)#121 |
| 5. | Lake Stickney | 3.89% | 0.64%(+3.26)#5 | 0.31%(+3.58)#132 |
| 6. | Edgewood | 3.72% | 0.64%(+3.08)#6 | 0.31%(+3.41)#136 |
| 7. | North Lynnwood | 3.66% | 0.64%(+3.02)#7 | 0.31%(+3.35)#140 |
| 8. | Lakeland North | 3.56% | 0.64%(+2.92)#8 | 0.31%(+3.24)#146 |
| 9. | Winthrop | 3.43% | 0.64%(+2.80)#9 | 0.31%(+3.12)#153 |
| 10. | Picnic Point | 3.27% | 0.64%(+2.63)#10 | 0.31%(+2.95)#166 |
| 11. | North Puyallup | 3.24% | 0.64%(+2.60)#11 | 0.31%(+2.93)#169 |
| 12. | Whidbey Island Station | 3.14% | 0.64%(+2.51)#12 | 0.31%(+2.83)#176 |
| 13. | Fife | 3.08% | 0.64%(+2.44)#13 | 0.31%(+2.76)#180 |
| 14. | Steptoe | 3.00% | 0.64%(+2.36)#14 | 0.31%(+2.69)#188 |
| 15. | Mill Creek | 2.85% | 0.64%(+2.22)#15 | 0.31%(+2.54)#202 |
| 16. | Federal Way | 2.83% | 0.64%(+2.19)#16 | 0.31%(+2.52)#206 |
| 17. | University Place | 2.64% | 0.64%(+2.00)#17 | 0.31%(+2.33)#231 |
| 18. | Medina | 2.63% | 0.64%(+2.00)#18 | 0.31%(+2.32)#232 |
| 19. | Lynnwood | 2.63% | 0.64%(+1.99)#19 | 0.31%(+2.31)#235 |
| 20. | Woods Creek | 2.61% | 0.64%(+1.97)#20 | 0.31%(+2.30)#239 |
| 21. | Newcastle | 2.47% | 0.64%(+1.84)#21 | 0.31%(+2.16)#259 |
| 22. | Lakeland South | 2.34% | 0.64%(+1.70)#22 | 0.31%(+2.03)#280 |
| 23. | Bothell East | 2.32% | 0.64%(+1.68)#23 | 0.31%(+2.00)#285 |
| 24. | Bellevue | 2.28% | 0.64%(+1.65)#24 | 0.31%(+1.97)#293 |
| 25. | Dash Point | 2.28% | 0.64%(+1.64)#25 | 0.31%(+1.96)#296 |
| 26. | Meadowdale | 2.24% | 0.64%(+1.60)#26 | 0.31%(+1.92)#305 |
| 27. | Eastmont | 2.09% | 0.64%(+1.46)#27 | 0.31%(+1.78)#327 |
| 28. | Lakewood | 2.08% | 0.64%(+1.45)#28 | 0.31%(+1.77)#332 |
| 29. | Parkland | 2.04% | 0.64%(+1.40)#29 | 0.31%(+1.73)#341 |
| 30. | Issaquah | 1.88% | 0.64%(+1.24)#30 | 0.31%(+1.57)#386 |
| 31. | Dupont | 1.87% | 0.64%(+1.23)#31 | 0.31%(+1.56)#393 |
| 32. | Hunts Point | 1.86% | 0.64%(+1.22)#32 | 0.31%(+1.55)#398 |
| 33. | La Center | 1.71% | 0.64%(+1.07)#33 | 0.31%(+1.40)#438 |
| 34. | Kenmore | 1.69% | 0.64%(+1.06)#34 | 0.31%(+1.38)#442 |
| 35. | Mercer Island | 1.67% | 0.64%(+1.03)#35 | 0.31%(+1.35)#452 |
| 36. | Shoreline | 1.64% | 0.64%(+1.01)#36 | 0.31%(+1.33)#463 |
| 37. | Fircrest | 1.61% | 0.64%(+0.970)#37 | 0.31%(+1.29)#476 |
| 38. | Clover Creek | 1.58% | 0.64%(+0.942)#38 | 0.31%(+1.26)#489 |
| 39. | Tehaleh | 1.52% | 0.64%(+0.887)#39 | 0.31%(+1.21)#505 |
| 40. | Sumas | 1.43% | 0.64%(+0.796)#40 | 0.31%(+1.12)#550 |
| 41. | Mill Creek East | 1.42% | 0.64%(+0.783)#41 | 0.31%(+1.11)#557 |
| 42. | North Fort Lewis | 1.38% | 0.64%(+0.742)#42 | 0.31%(+1.07)#579 |
| 43. | Sammamish | 1.35% | 0.64%(+0.717)#43 | 0.31%(+1.04)#591 |
| 44. | Alderwood Manor | 1.33% | 0.64%(+0.694)#44 | 0.31%(+1.02)#608 |
| 45. | Spanaway | 1.29% | 0.64%(+0.655)#45 | 0.31%(+0.978)#631 |
| 46. | Shadow Lake | 1.18% | 0.64%(+0.546)#46 | 0.31%(+0.870)#694 |
| 47. | Milton | 1.16% | 0.64%(+0.523)#47 | 0.31%(+0.846)#714 |
| 48. | Lacey | 1.15% | 0.64%(+0.514)#48 | 0.31%(+0.838)#721 |
| 49. | South Prairie | 1.13% | 0.64%(+0.497)#49 | 0.31%(+0.821)#740 |
| 50. | Auburn | 1.13% | 0.64%(+0.495)#50 | 0.31%(+0.818)#741 |
| 51. | Monroe North | 1.12% | 0.64%(+0.481)#51 | 0.31%(+0.805)#749 |
| 52. | Raymond | 1.10% | 0.64%(+0.464)#52 | 0.31%(+0.787)#760 |
| 53. | Elk Plain | 1.08% | 0.64%(+0.447)#53 | 0.31%(+0.770)#781 |
| 54. | Ravensdale | 1.08% | 0.64%(+0.445)#54 | 0.31%(+0.769)#782 |
| 55. | North Yelm | 1.08% | 0.64%(+0.441)#55 | 0.31%(+0.765)#789 |
| 56. | Cosmopolis | 1.06% | 0.64%(+0.428)#56 | 0.31%(+0.752)#803 |
| 57. | Lake Forest Park | 1.05% | 0.64%(+0.419)#57 | 0.31%(+0.742)#810 |
| 58. | Renton | 1.01% | 0.64%(+0.373)#58 | 0.31%(+0.697)#858 |
| 59. | Wollochet | 0.96% | 0.64%(+0.326)#59 | 0.31%(+0.650)#912 |
| 60. | Redmond | 0.95% | 0.64%(+0.314)#60 | 0.31%(+0.637)#929 |
| 61. | Fort Lewis | 0.94% | 0.64%(+0.302)#61 | 0.31%(+0.625)#951 |
| 62. | Union Hill Novelty Hill | 0.94% | 0.64%(+0.301)#62 | 0.31%(+0.624)#953 |
| 63. | Bothell West | 0.93% | 0.64%(+0.295)#63 | 0.31%(+0.618)#956 |
| 64. | Silver Firs | 0.91% | 0.64%(+0.273)#64 | 0.31%(+0.596)#980 |
| 65. | Tacoma | 0.91% | 0.64%(+0.271)#65 | 0.31%(+0.594)#982 |
| 66. | Kirkland | 0.90% | 0.64%(+0.262)#66 | 0.31%(+0.585)#992 |
| 67. | Olympia | 0.89% | 0.64%(+0.251)#67 | 0.31%(+0.574)#1,005 |
| 68. | Mountlake Terrace | 0.88% | 0.64%(+0.245)#68 | 0.31%(+0.568)#1,015 |
| 69. | Martha Lake | 0.88% | 0.64%(+0.241)#69 | 0.31%(+0.565)#1,022 |
| 70. | Summit View | 0.87% | 0.64%(+0.233)#70 | 0.31%(+0.556)#1,030 |
| 71. | Fairwood Cdp King County | 0.87% | 0.64%(+0.229)#71 | 0.31%(+0.553)#1,038 |
| 72. | Midland | 0.86% | 0.64%(+0.223)#72 | 0.31%(+0.547)#1,048 |
| 73. | Maple Valley | 0.85% | 0.64%(+0.218)#73 | 0.31%(+0.541)#1,049 |
| 74. | Edmonds | 0.85% | 0.64%(+0.210)#74 | 0.31%(+0.533)#1,059 |
| 75. | Everett | 0.83% | 0.64%(+0.196)#75 | 0.31%(+0.519)#1,084 |
| 76. | South Hill | 0.81% | 0.64%(+0.176)#76 | 0.31%(+0.500)#1,109 |
| 77. | Seattle | 0.81% | 0.64%(+0.175)#77 | 0.31%(+0.499)#1,110 |
| 78. | Felida | 0.81% | 0.64%(+0.172)#78 | 0.31%(+0.496)#1,114 |
| 79. | Frederickson | 0.79% | 0.64%(+0.152)#79 | 0.31%(+0.476)#1,136 |
| 80. | Ridgefield | 0.78% | 0.64%(+0.148)#80 | 0.31%(+0.471)#1,142 |
| 81. | Satsop | 0.78% | 0.64%(+0.145)#81 | 0.31%(+0.469)#1,146 |
| 82. | Steilacoom | 0.76% | 0.64%(+0.128)#82 | 0.31%(+0.451)#1,172 |
| 83. | Marietta Alderwood | 0.76% | 0.64%(+0.121)#83 | 0.31%(+0.444)#1,181 |
| 84. | Riverside | 0.71% | 0.64%(+0.072)#84 | 0.31%(+0.395)#1,261 |
| 85. | Lake Goodwin | 0.70% | 0.64%(+0.063)#85 | 0.31%(+0.386)#1,273 |
| 86. | Nisqually Indian Community | 0.67% | 0.64%(+0.039)#86 | 0.31%(+0.362)#1,310 |
| 87. | Meadow Glade | 0.67% | 0.64%(+0.034)#87 | 0.31%(+0.357)#1,319 |
| 88. | Mccleary | 0.66% | 0.64%(+0.024)#88 | 0.31%(+0.347)#1,341 |
| 89. | Cottage Lake | 0.65% | 0.64%(+0.018)#89 | 0.31%(+0.342)#1,355 |
| 90. | Maplewood | 0.65% | 0.64%(+0.017)#90 | 0.31%(+0.340)#1,361 |
| 91. | Black Diamond | 0.64% | 0.64%(+0.004)#91 | 0.31%(+0.327)#1,393 |
| 92. | Rosedale | 0.63% | 0.64%(-0.004)#92 | 0.31%(+0.319)#1,411 |
| 93. | Brier | 0.61% | 0.64%(-0.024)#93 | 0.31%(+0.299)#1,452 |
| 94. | Richland | 0.59% | 0.64%(-0.041)#94 | 0.31%(+0.282)#1,487 |
| 95. | Bothell | 0.59% | 0.64%(-0.047)#95 | 0.31%(+0.276)#1,507 |
| 96. | Camas | 0.59% | 0.64%(-0.048)#96 | 0.31%(+0.275)#1,509 |
| 97. | Venersborg | 0.57% | 0.64%(-0.066)#97 | 0.31%(+0.257)#1,550 |
| 98. | Suncrest | 0.54% | 0.64%(-0.093)#98 | 0.31%(+0.230)#1,620 |
| 99. | Tenino | 0.54% | 0.64%(-0.098)#99 | 0.31%(+0.226)#1,631 |
| 100. | Gig Harbor | 0.54% | 0.64%(-0.099)#100 | 0.31%(+0.225)#1,634 |
Common Questions
What are the Top 10 Cities with the Highest Percentage of Immigrants from Korea in Washington?
Top 10 Cities with the Highest Percentage of Immigrants from Korea in Washington are:
#1
6.93%
#2
5.21%
#3
4.57%
#4
4.15%
#5
3.89%
#6
3.72%
#7
3.66%
#8
3.56%
#9
3.43%
#10
3.27%
What city has the Highest Percentage of Immigrants from Korea in Washington?
Larch Way has the Highest Percentage of Immigrants from Korea in Washington with 6.93%.
What is the Percentage of Immigrants from Korea in the State of Washington?
Percentage of Immigrants from Korea in Washington is 0.64%.
What is the Percentage of Immigrants from Korea in the United States?
Percentage of Immigrants from Korea in the United States is 0.31%.