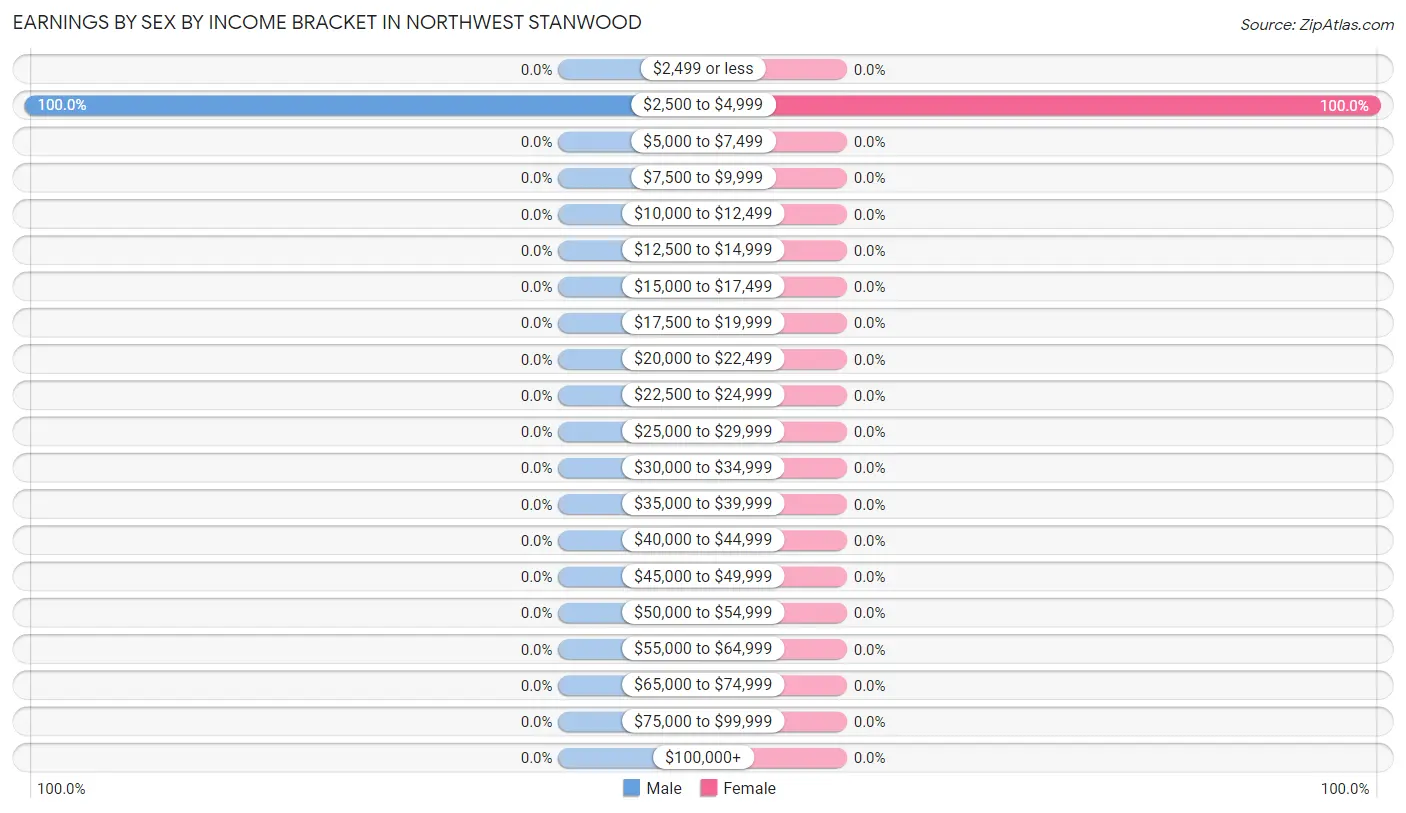
Earnings by Sex by Income Bracket in Northwest Stanwood
The most common earnings brackets in Northwest Stanwood are $2,500 to $4,999 for men (1 | 100.0%) and $2,500 to $4,999 for women (1 | 100.0%).
Income
Male
Female
$2,499 or less
0 (0.0%)
0 (0.0%)
$2,500 to $4,999
1 (100.0%)
1 (100.0%)
$5,000 to $7,499
0 (0.0%)
0 (0.0%)
$7,500 to $9,999
0 (0.0%)
0 (0.0%)
$10,000 to $12,499
0 (0.0%)
0 (0.0%)
$12,500 to $14,999
0 (0.0%)
0 (0.0%)
$15,000 to $17,499
0 (0.0%)
0 (0.0%)
$17,500 to $19,999
0 (0.0%)
0 (0.0%)
$20,000 to $22,499
0 (0.0%)
0 (0.0%)
$22,500 to $24,999
0 (0.0%)
0 (0.0%)
$25,000 to $29,999
0 (0.0%)
0 (0.0%)
$30,000 to $34,999
0 (0.0%)
0 (0.0%)
$35,000 to $39,999
0 (0.0%)
0 (0.0%)
$40,000 to $44,999
0 (0.0%)
0 (0.0%)
$45,000 to $49,999
0 (0.0%)
0 (0.0%)
$50,000 to $54,999
0 (0.0%)
0 (0.0%)
$55,000 to $64,999
0 (0.0%)
0 (0.0%)
$65,000 to $74,999
0 (0.0%)
0 (0.0%)
$75,000 to $99,999
0 (0.0%)
0 (0.0%)
$100,000+
0 (0.0%)
0 (0.0%)
Total
1 (100.0%)
1 (100.0%)
Earnings by Sex by Educational Attainment in Northwest Stanwood
Educational Attainment
Male Income
Female Income
Less than High School
-
-
High School Diploma
-
-
College or Associate's Degree
-
-
Bachelor's Degree
-
-
Graduate Degree
-
-
Total
-
-
Family Income in Northwest Stanwood
Family Income Brackets in Northwest Stanwood
Income Bracket
# Families
% Families
Less than $10,000
0
0.0%
$10,000 to $14,999
0
0.0%
$15,000 to $24,999
0
0.0%
$25,000 to $34,999
0
0.0%
$35,000 to $49,999
0
0.0%
$50,000 to $74,999
0
0.0%
$75,000 to $99,999
0
0.0%
$100,000 to $149,999
0
0.0%
$150,000 to $199,999
0
0.0%
$200,000+
0
0.0%
Family Income by Famaliy Size in Northwest Stanwood
Income Bracket
# Families
Median Income
2-Person Families
0 (0.0%)
$0
3-Person Families
0 (0.0%)
$0
4-Person Families
0 (0.0%)
$0
5-Person Families
0 (0.0%)
$0
6-Person Families
0 (0.0%)
$0
7+ Person Families
0 (0.0%)
$0
Total
0 (0.0%)
$0
Family Income by Number of Earners in Northwest Stanwood
Number of Earners
# Families
Median Income
No Earners
0 (0.0%)
$0
1 Earner
0 (0.0%)
$0
2 Earners
0 (0.0%)
$0
3+ Earners
0 (0.0%)
$0
Total
0 (0.0%)
$0
Household Income in Northwest Stanwood
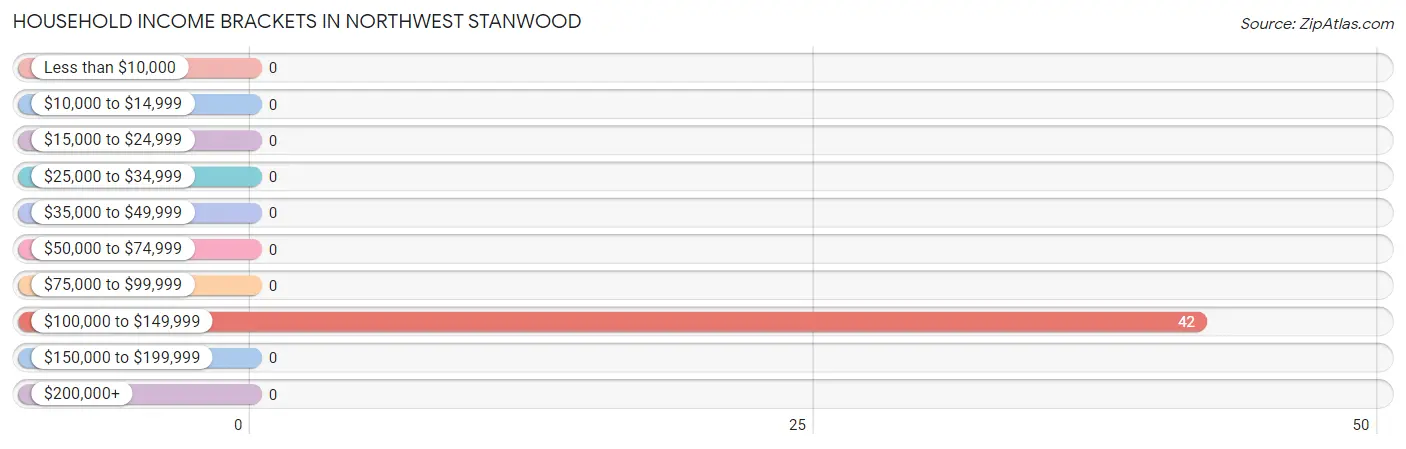
Household Income Brackets in Northwest Stanwood
With 42 households falling in the category, the $100,000 to $149,999 income range is the most frequent in Northwest Stanwood, accounting for 100.0% of all households.
Income Bracket
# Households
% Households
Less than $10,000
0
0.0%
$10,000 to $14,999
0
0.0%
$15,000 to $24,999
0
0.0%
$25,000 to $34,999
0
0.0%
$35,000 to $49,999
0
0.0%
$50,000 to $74,999
0
0.0%
$75,000 to $99,999
0
0.0%
$100,000 to $149,999
42
100.0%
$150,000 to $199,999
0
0.0%
$200,000+
0
0.0%
Household Income by Householder Age in Northwest Stanwood
Income Bracket
# Households
Median Income
15 to 24 Years
0 (0.0%)
$0
25 to 44 Years
0 (0.0%)
$0
45 to 64 Years
0 (0.0%)
$0
65+ Years
42 (100.0%)
$0
Total
42 (100.0%)
$0
Poverty in Northwest Stanwood
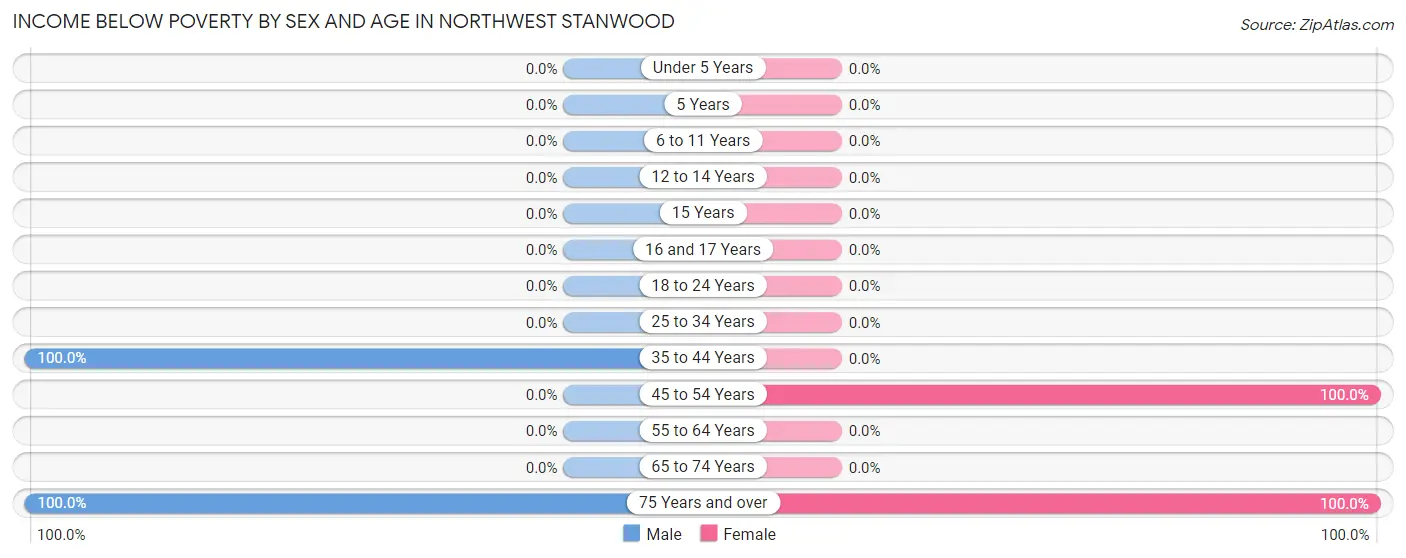
Income Below Poverty by Sex and Age in Northwest Stanwood
With 50.0% poverty level for males and 6.5% for females among the residents of Northwest Stanwood, 35 to 44 year old males and 45 to 54 year old females are the most vulnerable to poverty, with 1 males (100.0%) and 2 females (100.0%) in their respective age groups living below the poverty level.
Age Bracket
Male
Female
Under 5 Years
0 (0.0%)
0 (0.0%)
5 Years
0 (0.0%)
0 (0.0%)
6 to 11 Years
0 (0.0%)
0 (0.0%)
12 to 14 Years
0 (0.0%)
0 (0.0%)
15 Years
0 (0.0%)
0 (0.0%)
16 and 17 Years
0 (0.0%)
0 (0.0%)
18 to 24 Years
0 (0.0%)
0 (0.0%)
25 to 34 Years
0 (0.0%)
0 (0.0%)
35 to 44 Years
1 (100.0%)
0 (0.0%)
45 to 54 Years
0 (0.0%)
2 (100.0%)
55 to 64 Years
0 (0.0%)
0 (0.0%)
65 to 74 Years
0 (0.0%)
0 (0.0%)
75 Years and over
1 (100.0%)
1 (100.0%)
Total
2 (50.0%)
3 (6.5%)
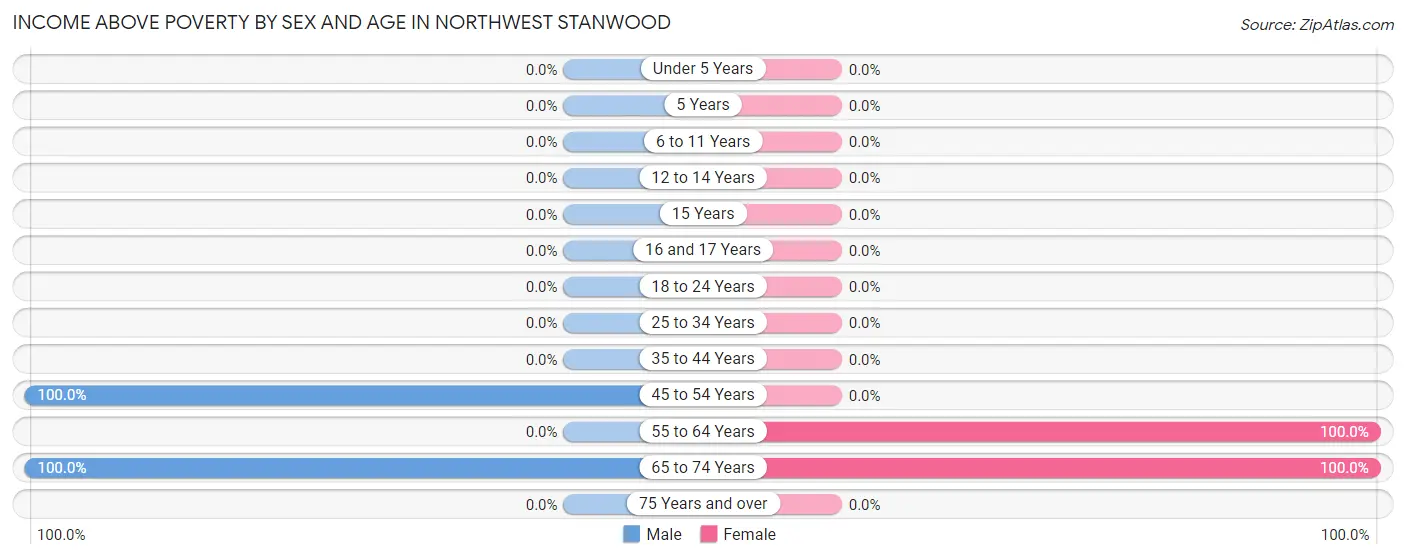
Income Above Poverty by Sex and Age in Northwest Stanwood
According to the poverty statistics in Northwest Stanwood, males aged 45 to 54 years and females aged 55 to 64 years are the age groups that are most secure financially, with 100.0% of males and 100.0% of females in these age groups living above the poverty line.
Age Bracket
Male
Female
Under 5 Years
0 (0.0%)
0 (0.0%)
5 Years
0 (0.0%)
0 (0.0%)
6 to 11 Years
0 (0.0%)
0 (0.0%)
12 to 14 Years
0 (0.0%)
0 (0.0%)
15 Years
0 (0.0%)
0 (0.0%)
16 and 17 Years
0 (0.0%)
0 (0.0%)
18 to 24 Years
0 (0.0%)
0 (0.0%)
25 to 34 Years
0 (0.0%)
0 (0.0%)
35 to 44 Years
0 (0.0%)
0 (0.0%)
45 to 54 Years
1 (100.0%)
0 (0.0%)
55 to 64 Years
0 (0.0%)
1 (100.0%)
65 to 74 Years
1 (100.0%)
42 (100.0%)
75 Years and over
0 (0.0%)
0 (0.0%)
Total
2 (50.0%)
43 (93.5%)
Income Below Poverty Among Married-Couple Families in Northwest Stanwood
Children
Above Poverty
Below Poverty
No Children
0 (0.0%)
0 (0.0%)
1 or 2 Children
0 (0.0%)
0 (0.0%)
3 or 4 Children
0 (0.0%)
0 (0.0%)
5 or more Children
0 (0.0%)
0 (0.0%)
Total
0 (0.0%)
0 (0.0%)
Income Below Poverty Among Single-Parent Households in Northwest Stanwood
Children
Single Father
Single Mother
No Children
0 (0.0%)
0 (0.0%)
1 or 2 Children
0 (0.0%)
0 (0.0%)
3 or 4 Children
0 (0.0%)
0 (0.0%)
5 or more Children
0 (0.0%)
0 (0.0%)
Total
0 (0.0%)
0 (0.0%)
Income Below Poverty Among Married-Couple vs Single-Parent Households in Northwest Stanwood
Children
Married-Couple Families
Single-Parent Households
No Children
0 (0.0%)
0 (0.0%)
1 or 2 Children
0 (0.0%)
0 (0.0%)
3 or 4 Children
0 (0.0%)
0 (0.0%)
5 or more Children
0 (0.0%)
0 (0.0%)
Total
0 (0.0%)
0 (0.0%)
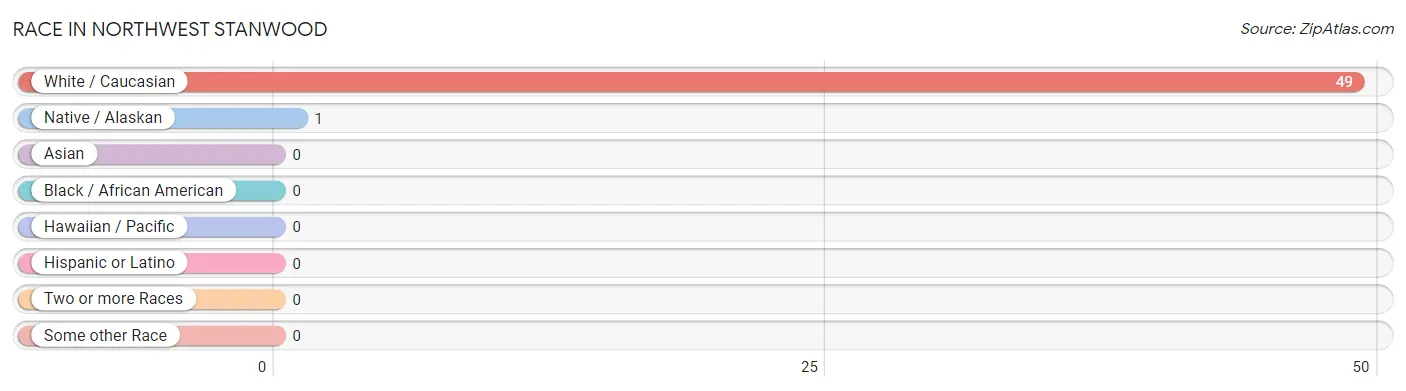
Race in Northwest Stanwood
The most populous races in Northwest Stanwood are White / Caucasian (49 | 98.0%), and Native / Alaskan (1 | 2.0%).
Race
# Population
% Population
Asian
0
0.0%
Black / African American
0
0.0%
Hawaiian / Pacific
0
0.0%
Hispanic or Latino
0
0.0%
Native / Alaskan
1
2.0%
White / Caucasian
49
98.0%
Two or more Races
0
0.0%
Some other Race
0
0.0%
Total
50
100.0%
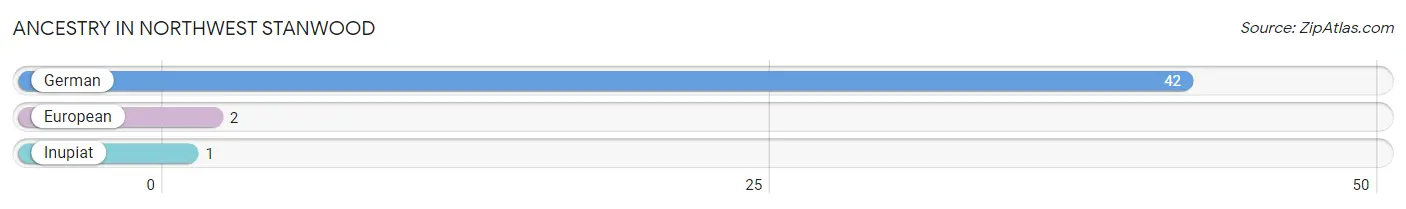
Ancestry in Northwest Stanwood
The most populous ancestries reported in Northwest Stanwood are German (42 | 84.0%), European (2 | 4.0%), and Inupiat (1 | 2.0%), together accounting for 90.0% of all Northwest Stanwood residents.
Ancestry
# Population
% Population
European
2
4.0%
German
42
84.0%
Inupiat
1
2.0%
View All 3 Rows
Immigrants in Northwest Stanwood
Immigration Origin
# Population
% Population
View All 0 Rows
Sex and Age in Northwest Stanwood
Sex and Age in Northwest Stanwood
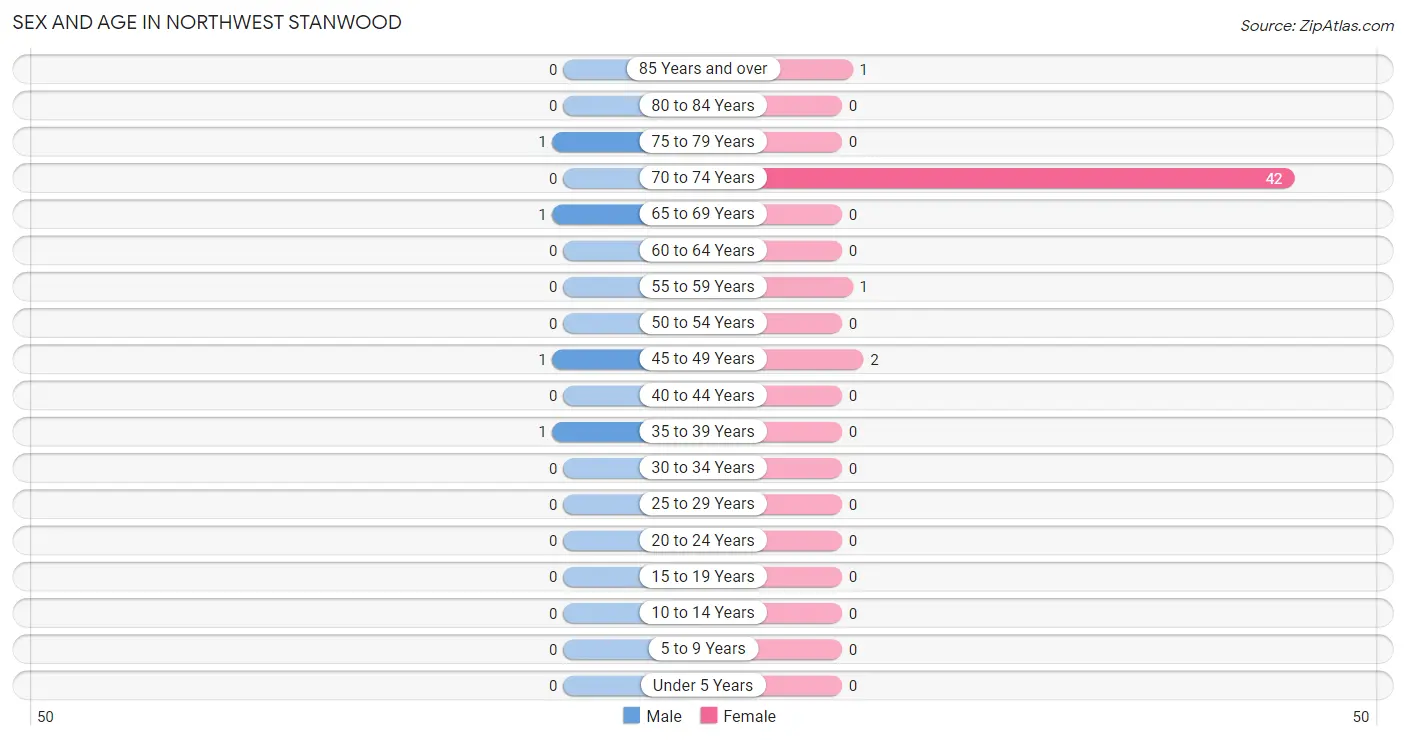
The most populous age groups in Northwest Stanwood are 35 to 39 Years (1 | 25.0%) for men and 70 to 74 Years (42 | 91.3%) for women.
Age Bracket
Male
Female
Under 5 Years
0 (0.0%)
0 (0.0%)
5 to 9 Years
0 (0.0%)
0 (0.0%)
10 to 14 Years
0 (0.0%)
0 (0.0%)
15 to 19 Years
0 (0.0%)
0 (0.0%)
20 to 24 Years
0 (0.0%)
0 (0.0%)
25 to 29 Years
0 (0.0%)
0 (0.0%)
30 to 34 Years
0 (0.0%)
0 (0.0%)
35 to 39 Years
1 (25.0%)
0 (0.0%)
40 to 44 Years
0 (0.0%)
0 (0.0%)
45 to 49 Years
1 (25.0%)
2 (4.3%)
50 to 54 Years
0 (0.0%)
0 (0.0%)
55 to 59 Years
0 (0.0%)
1 (2.2%)
60 to 64 Years
0 (0.0%)
0 (0.0%)
65 to 69 Years
1 (25.0%)
0 (0.0%)
70 to 74 Years
0 (0.0%)
42 (91.3%)
75 to 79 Years
1 (25.0%)
0 (0.0%)
80 to 84 Years
0 (0.0%)
0 (0.0%)
85 Years and over
0 (0.0%)
1 (2.2%)
Total
4 (100.0%)
46 (100.0%)
Families and Households in Northwest Stanwood
Median Family Size in Northwest Stanwood
Family Type
# Families
Family Size
Married-Couple
0 (0.0%)
-
Single Male/Father
0 (0.0%)
-
Single Female/Mother
0 (0.0%)
-
Total Families
0 (0.0%)
-
Median Household Size in Northwest Stanwood
Household Type
# Households
Household Size
Married-Couple
0 (0.0%)
-
Single Male/Father
0 (0.0%)
-
Single Female/Mother
0 (0.0%)
-
Non-family
42 (100.0%)
-
Total Households
42 (100.0%)
-
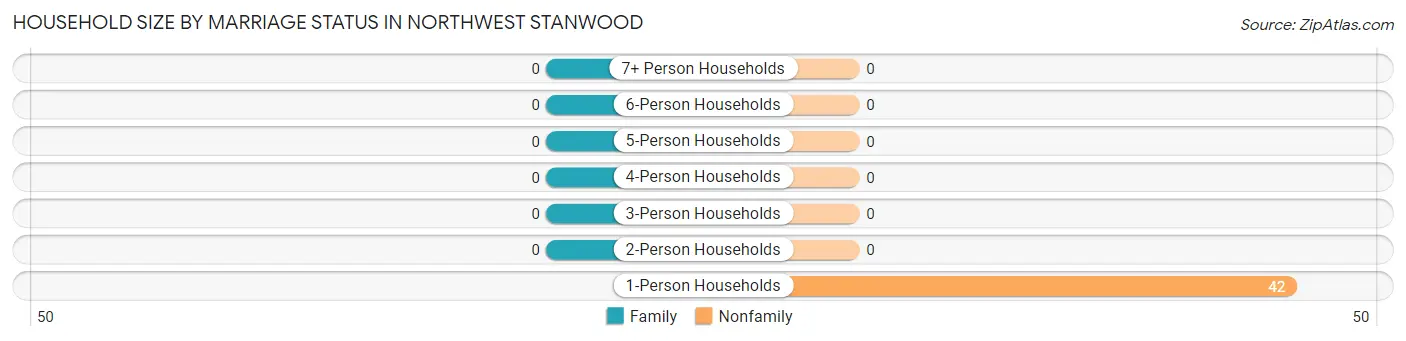
Household Size by Marriage Status in Northwest Stanwood
Household Size
Family Households
Nonfamily Households
1-Person Households
-
42 (100.0%)
2-Person Households
0 (0.0%)
0 (0.0%)
3-Person Households
0 (0.0%)
0 (0.0%)
4-Person Households
0 (0.0%)
0 (0.0%)
5-Person Households
0 (0.0%)
0 (0.0%)
6-Person Households
0 (0.0%)
0 (0.0%)
7+ Person Households
0 (0.0%)
0 (0.0%)
Total
0 (0.0%)
42 (100.0%)
Female Fertility in Northwest Stanwood
Fertility by Age in Northwest Stanwood
Age Bracket
Women with Births
Births / 1,000 Women
15 to 19 years
0 (0.0%)
0.0
20 to 34 years
0 (0.0%)
0.0
35 to 50 years
0 (0.0%)
0.0
Total
0 (0.0%)
0.0
Fertility by Age by Marriage Status in Northwest Stanwood
Age Bracket
Married
Unmarried
15 to 19 years
0 (0.0%)
0 (0.0%)
20 to 34 years
0 (0.0%)
0 (0.0%)
35 to 50 years
0 (0.0%)
0 (0.0%)
Total
0 (0.0%)
0 (0.0%)
Fertility by Education in Northwest Stanwood
Educational Attainment
Women with Births
Births / 1,000 Women
Less than High School
0 (0.0%)
0.0
High School Diploma
0 (0.0%)
0.0
College or Associate's Degree
0 (0.0%)
0.0
Bachelor's Degree
0 (0.0%)
0.0
Graduate Degree
0 (0.0%)
0.0
Total
0 (0.0%)
0.0
Fertility by Education by Marriage Status in Northwest Stanwood
Educational Attainment
Married
Unmarried
Less than High School
0 (0.0%)
0 (0.0%)
High School Diploma
0 (0.0%)
0 (0.0%)
College or Associate's Degree
0 (0.0%)
0 (0.0%)
Bachelor's Degree
0 (0.0%)
0 (0.0%)
Graduate Degree
0 (0.0%)
0 (0.0%)
Total
0 (0.0%)
0 (0.0%)
Employment Characteristics in Northwest Stanwood
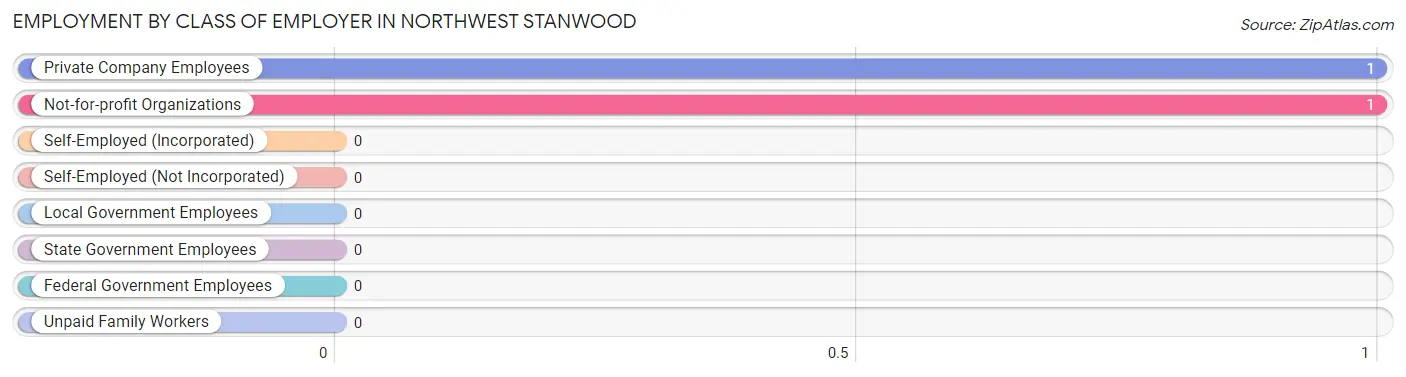
Employment by Class of Employer in Northwest Stanwood
Among the 2 employed individuals in Northwest Stanwood, private company employees (1 | 50.0%), and not-for-profit organizations (1 | 50.0%) make up the most common classes of employment.
Employer Class
# Employees
% Employees
Private Company Employees
1
50.0%
Self-Employed (Incorporated)
0
0.0%
Self-Employed (Not Incorporated)
0
0.0%
Not-for-profit Organizations
1
50.0%
Local Government Employees
0
0.0%
State Government Employees
0
0.0%
Federal Government Employees
0
0.0%
Unpaid Family Workers
0
0.0%
Total
2
100.0%
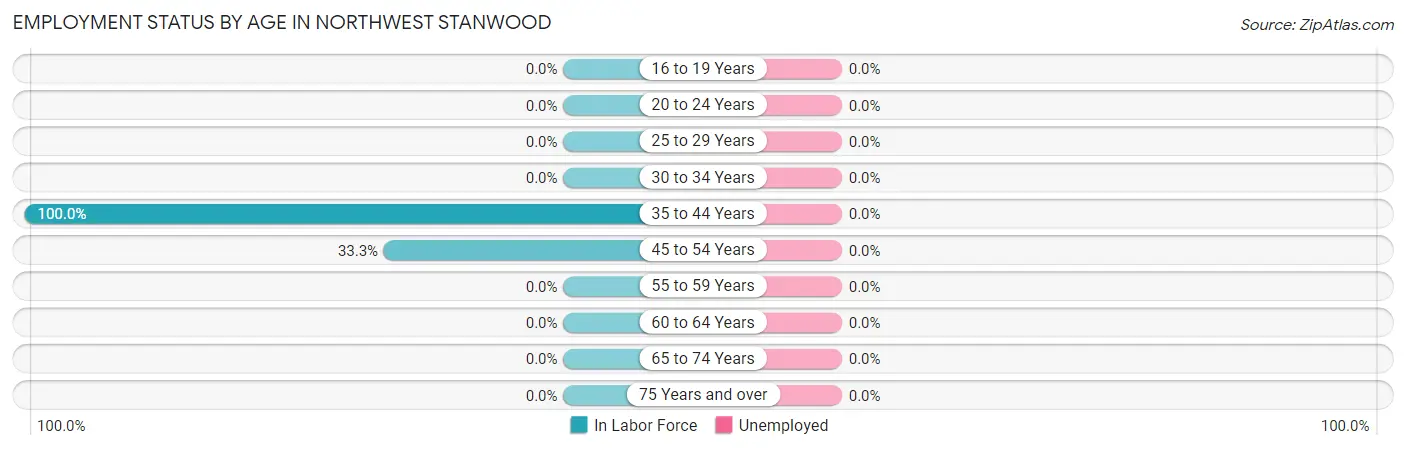
Employment Status by Age in Northwest Stanwood
Age Bracket
In Labor Force
Unemployed
16 to 19 Years
0 (0.0%)
0 (0.0%)
20 to 24 Years
0 (0.0%)
0 (0.0%)
25 to 29 Years
0 (0.0%)
0 (0.0%)
30 to 34 Years
0 (0.0%)
0 (0.0%)
35 to 44 Years
1 (100.0%)
0 (0.0%)
45 to 54 Years
1 (33.3%)
0 (0.0%)
55 to 59 Years
0 (0.0%)
0 (0.0%)
60 to 64 Years
0 (0.0%)
0 (0.0%)
65 to 74 Years
0 (0.0%)
0 (0.0%)
75 Years and over
0 (0.0%)
0 (0.0%)
Total
2 (4.0%)
0 (0.0%)
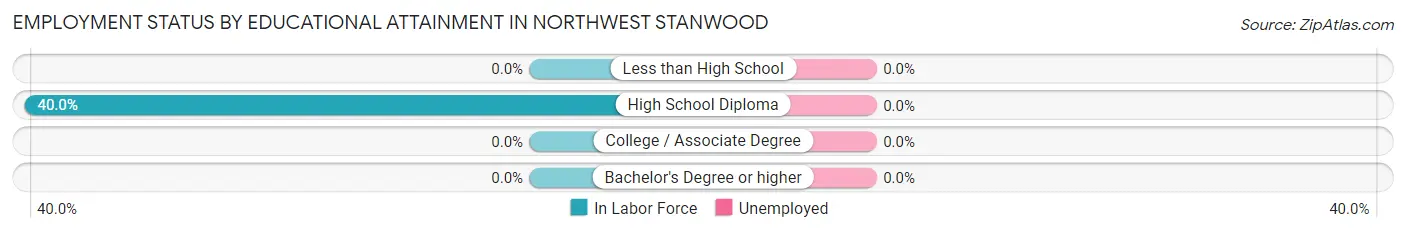
Employment Status by Educational Attainment in Northwest Stanwood
Educational Attainment
In Labor Force
Unemployed
Less than High School
0 (0.0%)
0 (0.0%)
High School Diploma
2 (40.0%)
0 (0.0%)
College / Associate Degree
0 (0.0%)
0 (0.0%)
Bachelor's Degree or higher
0 (0.0%)
0 (0.0%)
Total
2 (40.0%)
0 (0.0%)
Employment Occupations by Sex in Northwest Stanwood
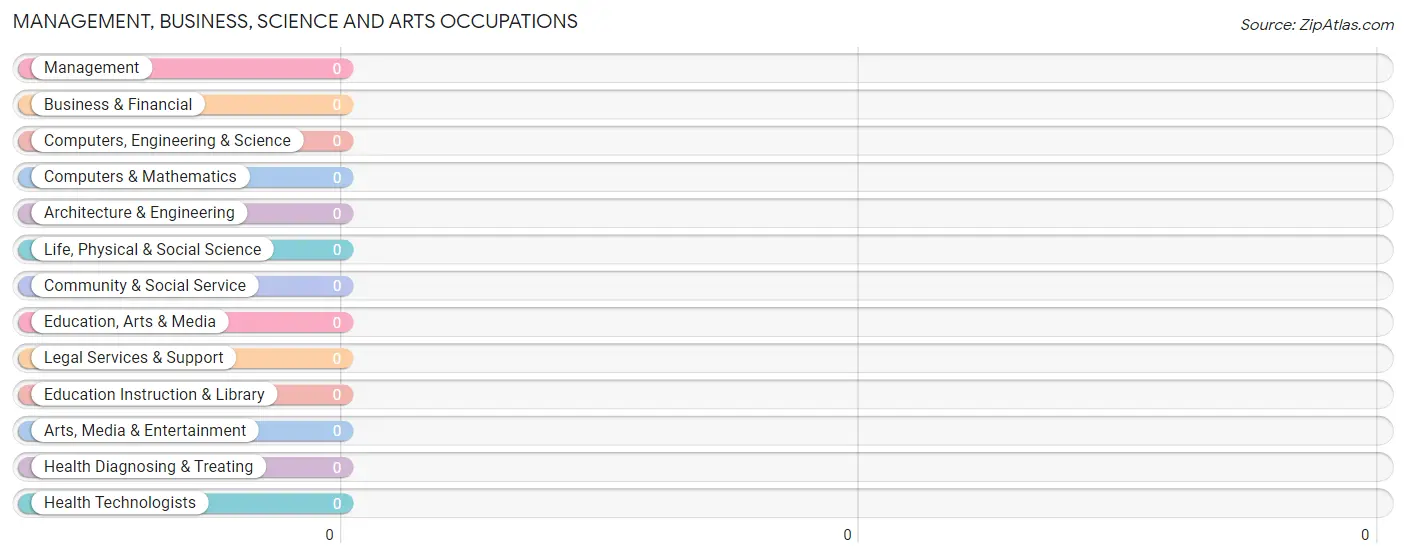
Management, Business, Science and Arts Occupations
Management, Business, Science and Arts Occupations by Sex
Occupation
Male
Female
Management
0 (0.0%)
0 (0.0%)
Business & Financial
0 (0.0%)
0 (0.0%)
Computers, Engineering & Science
0 (0.0%)
0 (0.0%)
Computers & Mathematics
0 (0.0%)
0 (0.0%)
Architecture & Engineering
0 (0.0%)
0 (0.0%)
Life, Physical & Social Science
0 (0.0%)
0 (0.0%)
Community & Social Service
0 (0.0%)
0 (0.0%)
Education, Arts & Media
0 (0.0%)
0 (0.0%)
Legal Services & Support
0 (0.0%)
0 (0.0%)
Education Instruction & Library
0 (0.0%)
0 (0.0%)
Arts, Media & Entertainment
0 (0.0%)
0 (0.0%)
Health Diagnosing & Treating
0 (0.0%)
0 (0.0%)
Health Technologists
0 (0.0%)
0 (0.0%)
Total (Category)
0 (0.0%)
0 (0.0%)
Total (Overall)
1 (50.0%)
1 (50.0%)
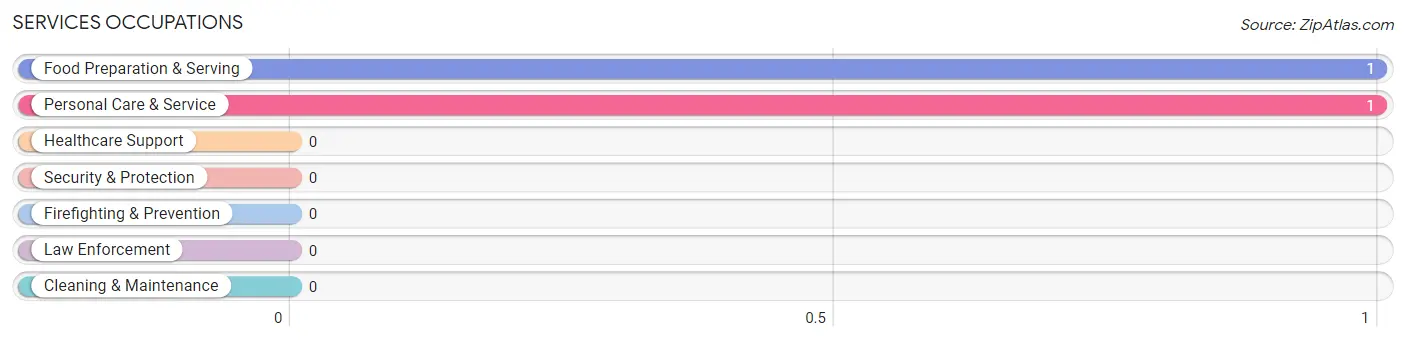
Services Occupations
The most common Services occupations in Northwest Stanwood are Food Preparation & Serving (1 | 50.0%), and Personal Care & Service (1 | 50.0%).
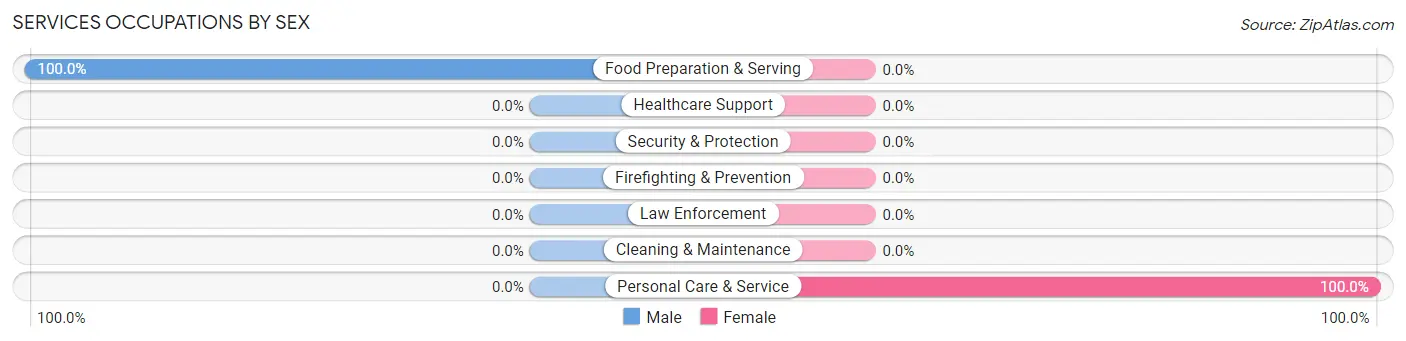
Services Occupations by Sex
Occupation
Male
Female
Healthcare Support
0 (0.0%)
0 (0.0%)
Security & Protection
0 (0.0%)
0 (0.0%)
Firefighting & Prevention
0 (0.0%)
0 (0.0%)
Law Enforcement
0 (0.0%)
0 (0.0%)
Food Preparation & Serving
1 (100.0%)
0 (0.0%)
Cleaning & Maintenance
0 (0.0%)
0 (0.0%)
Personal Care & Service
0 (0.0%)
1 (100.0%)
Total (Category)
1 (50.0%)
1 (50.0%)
Total (Overall)
1 (50.0%)
1 (50.0%)
Sales and Office Occupations
Sales and Office Occupations by Sex
Occupation
Male
Female
Sales & Related
0 (0.0%)
0 (0.0%)
Office & Administration
0 (0.0%)
0 (0.0%)
Total (Category)
0 (0.0%)
0 (0.0%)
Total (Overall)
1 (50.0%)
1 (50.0%)
Natural Resources, Construction and Maintenance Occupations
Natural Resources, Construction and Maintenance Occupations by Sex
Occupation
Male
Female
Farming, Fishing & Forestry
0 (0.0%)
0 (0.0%)
Construction & Extraction
0 (0.0%)
0 (0.0%)
Installation, Maintenance & Repair
0 (0.0%)
0 (0.0%)
Total (Category)
0 (0.0%)
0 (0.0%)
Total (Overall)
1 (50.0%)
1 (50.0%)
Production, Transportation and Moving Occupations
Production, Transportation and Moving Occupations by Sex
Occupation
Male
Female
Production
0 (0.0%)
0 (0.0%)
Transportation
0 (0.0%)
0 (0.0%)
Material Moving
0 (0.0%)
0 (0.0%)
Total (Category)
0 (0.0%)
0 (0.0%)
Total (Overall)
1 (50.0%)
1 (50.0%)
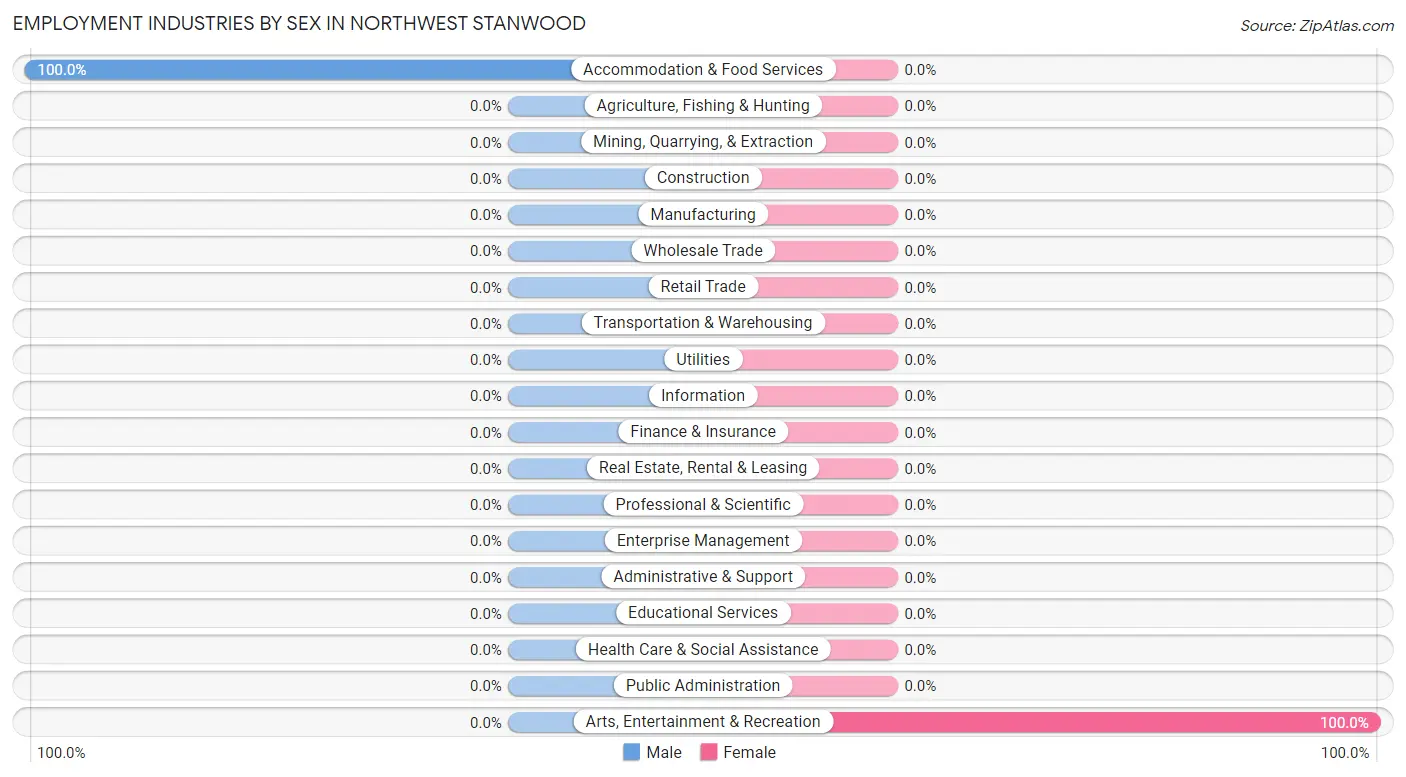
Employment Industries by Sex in Northwest Stanwood
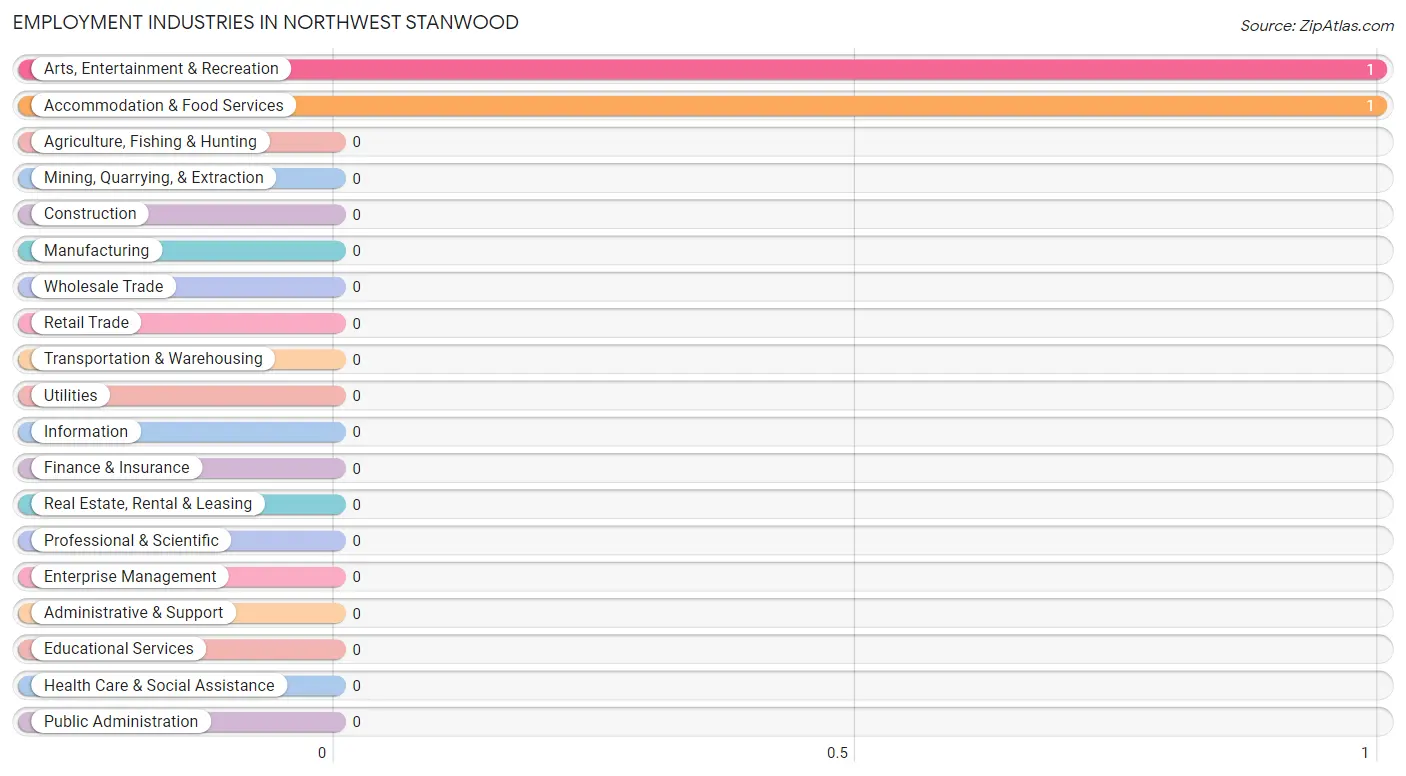
Employment Industries in Northwest Stanwood
The major employment industries in Northwest Stanwood include Arts, Entertainment & Recreation (1 | 50.0%), and Accommodation & Food Services (1 | 50.0%).
Employment Industries by Sex in Northwest Stanwood
Industry
Male
Female
Agriculture, Fishing & Hunting
0 (0.0%)
0 (0.0%)
Mining, Quarrying, & Extraction
0 (0.0%)
0 (0.0%)
Construction
0 (0.0%)
0 (0.0%)
Manufacturing
0 (0.0%)
0 (0.0%)
Wholesale Trade
0 (0.0%)
0 (0.0%)
Retail Trade
0 (0.0%)
0 (0.0%)
Transportation & Warehousing
0 (0.0%)
0 (0.0%)
Utilities
0 (0.0%)
0 (0.0%)
Information
0 (0.0%)
0 (0.0%)
Finance & Insurance
0 (0.0%)
0 (0.0%)
Real Estate, Rental & Leasing
0 (0.0%)
0 (0.0%)
Professional & Scientific
0 (0.0%)
0 (0.0%)
Enterprise Management
0 (0.0%)
0 (0.0%)
Administrative & Support
0 (0.0%)
0 (0.0%)
Educational Services
0 (0.0%)
0 (0.0%)
Health Care & Social Assistance
0 (0.0%)
0 (0.0%)
Arts, Entertainment & Recreation
0 (0.0%)
1 (100.0%)
Accommodation & Food Services
1 (100.0%)
0 (0.0%)
Public Administration
0 (0.0%)
0 (0.0%)
Total
1 (50.0%)
1 (50.0%)
Education in Northwest Stanwood
School Enrollment in Northwest Stanwood
School Level
# Students
% Students
Nursery / Preschool
0
0.0%
Kindergarten
0
0.0%
Elementary School
0
0.0%
Middle School
0
0.0%
High School
0
0.0%
College / Undergraduate
0
0.0%
Graduate / Professional
0
0.0%
Total
0
0.0%
School Enrollment by Age by Funding Source in Northwest Stanwood
Age Bracket
Public School
Private School
3 to 4 Year Olds
0 (0.0%)
0 (0.0%)
5 to 9 Year Old
0 (0.0%)
0 (0.0%)
10 to 14 Year Olds
0 (0.0%)
0 (0.0%)
15 to 17 Year Olds
0 (0.0%)
0 (0.0%)
18 to 19 Year Olds
0 (0.0%)
0 (0.0%)
20 to 24 Year Olds
0 (0.0%)
0 (0.0%)
25 to 34 Year Olds
0 (0.0%)
0 (0.0%)
35 Years and over
0 (0.0%)
0 (0.0%)
Total
0 (0.0%)
0 (0.0%)
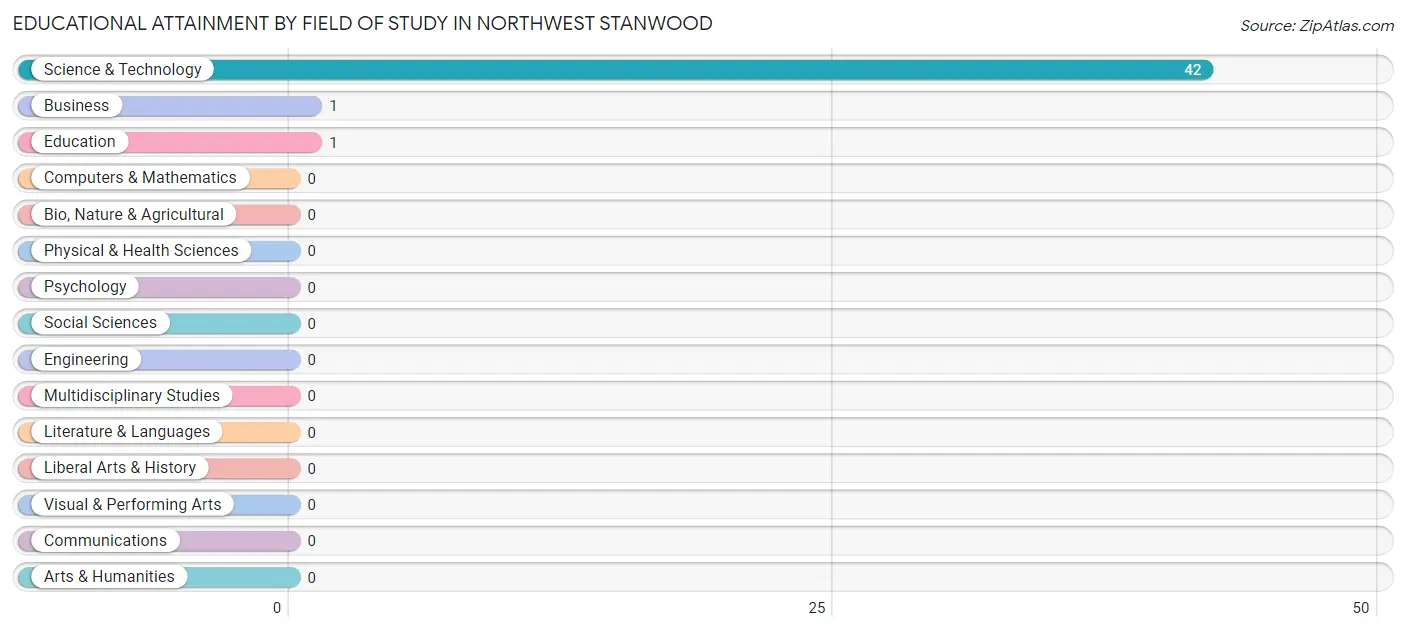
Educational Attainment by Field of Study in Northwest Stanwood
Science & technology (42 | 95.5%), business (1 | 2.3%), and education (1 | 2.3%) are the most common fields of study among 44 individuals in Northwest Stanwood who have obtained a bachelor's degree or higher.
Field of Study
# Graduates
% Graduates
Computers & Mathematics
0
0.0%
Bio, Nature & Agricultural
0
0.0%
Physical & Health Sciences
0
0.0%
Psychology
0
0.0%
Social Sciences
0
0.0%
Engineering
0
0.0%
Multidisciplinary Studies
0
0.0%
Science & Technology
42
95.5%
Business
1
2.3%
Education
1
2.3%
Literature & Languages
0
0.0%
Liberal Arts & History
0
0.0%
Visual & Performing Arts
0
0.0%
Communications
0
0.0%
Arts & Humanities
0
0.0%
Total
44
100.0%
Transportation & Commute in Northwest Stanwood
Vehicle Availability by Sex in Northwest Stanwood
Vehicles Available
Male
Female
No Vehicle
0 (0.0%)
0 (0.0%)
1 Vehicle
0 (0.0%)
0 (0.0%)
2 Vehicles
0 (0.0%)
0 (0.0%)
3 Vehicles
0 (0.0%)
0 (0.0%)
4 Vehicles
0 (0.0%)
0 (0.0%)
5 or more Vehicles
0 (0.0%)
0 (0.0%)
Total
0 (0.0%)
0 (0.0%)
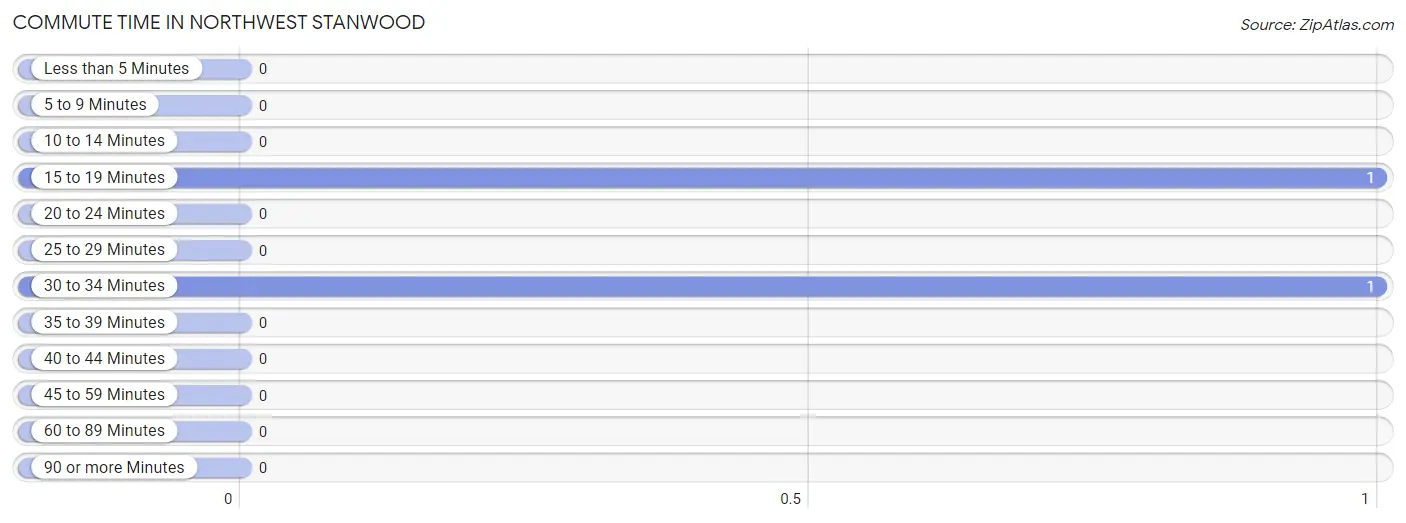
Commute Time in Northwest Stanwood
The most frequently occuring commute durations in Northwest Stanwood are 15 to 19 minutes (1 commuters, 50.0%), 30 to 34 minutes (1 commuters, 50.0%), and less than 5 minutes (0 commuters, 0.0%).
Commute Time
# Commuters
% Commuters
Less than 5 Minutes
0
0.0%
5 to 9 Minutes
0
0.0%
10 to 14 Minutes
0
0.0%
15 to 19 Minutes
1
50.0%
20 to 24 Minutes
0
0.0%
25 to 29 Minutes
0
0.0%
30 to 34 Minutes
1
50.0%
35 to 39 Minutes
0
0.0%
40 to 44 Minutes
0
0.0%
45 to 59 Minutes
0
0.0%
60 to 89 Minutes
0
0.0%
90 or more Minutes
0
0.0%
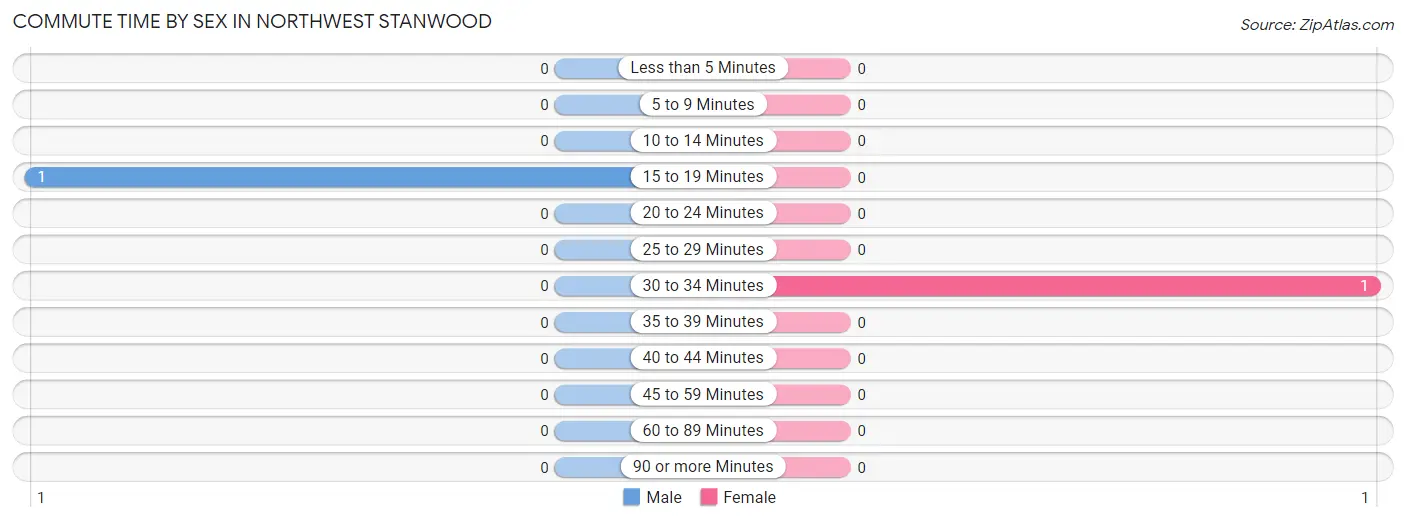
Commute Time by Sex in Northwest Stanwood
The most common commute times in Northwest Stanwood are 15 to 19 minutes (1 commuters, 100.0%) for males and 30 to 34 minutes (1 commuters, 100.0%) for females.
Commute Time
Male
Female
Less than 5 Minutes
0 (0.0%)
0 (0.0%)
5 to 9 Minutes
0 (0.0%)
0 (0.0%)
10 to 14 Minutes
0 (0.0%)
0 (0.0%)
15 to 19 Minutes
1 (100.0%)
0 (0.0%)
20 to 24 Minutes
0 (0.0%)
0 (0.0%)
25 to 29 Minutes
0 (0.0%)
0 (0.0%)
30 to 34 Minutes
0 (0.0%)
1 (100.0%)
35 to 39 Minutes
0 (0.0%)
0 (0.0%)
40 to 44 Minutes
0 (0.0%)
0 (0.0%)
45 to 59 Minutes
0 (0.0%)
0 (0.0%)
60 to 89 Minutes
0 (0.0%)
0 (0.0%)
90 or more Minutes
0 (0.0%)
0 (0.0%)
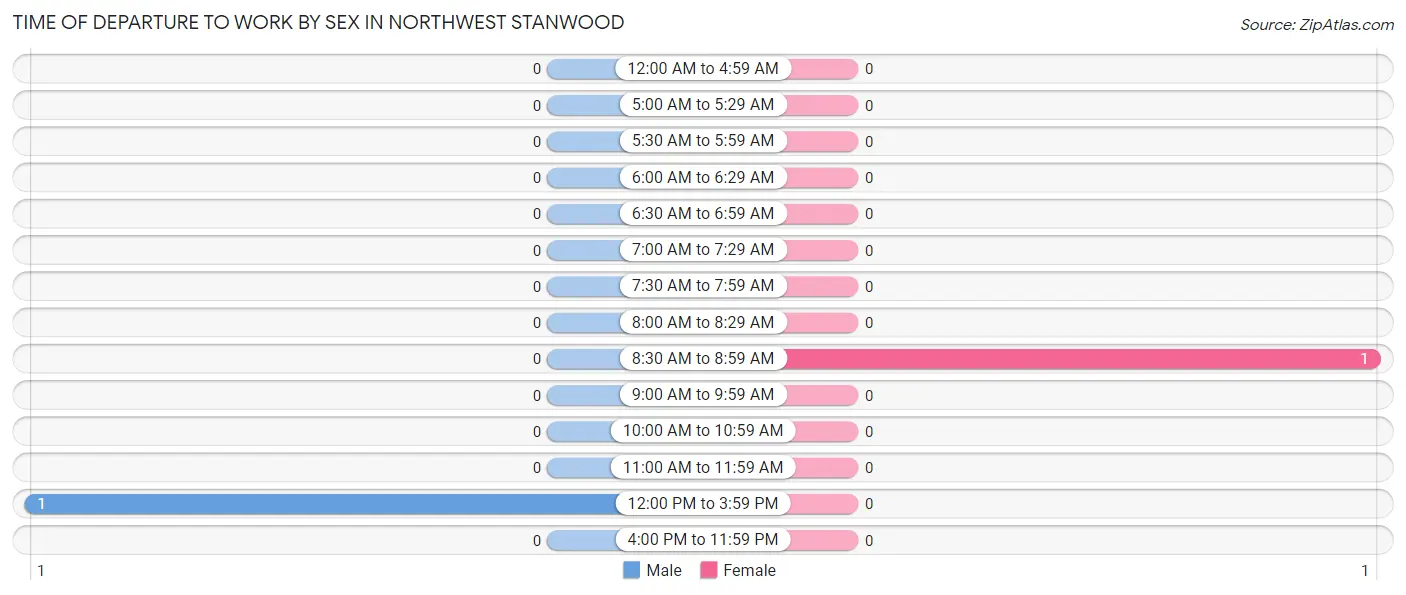
Time of Departure to Work by Sex in Northwest Stanwood
The most frequent times of departure to work in Northwest Stanwood are 12:00 PM to 3:59 PM (1, 100.0%) for males and 8:30 AM to 8:59 AM (1, 100.0%) for females.
Time of Departure
Male
Female
12:00 AM to 4:59 AM
0 (0.0%)
0 (0.0%)
5:00 AM to 5:29 AM
0 (0.0%)
0 (0.0%)
5:30 AM to 5:59 AM
0 (0.0%)
0 (0.0%)
6:00 AM to 6:29 AM
0 (0.0%)
0 (0.0%)
6:30 AM to 6:59 AM
0 (0.0%)
0 (0.0%)
7:00 AM to 7:29 AM
0 (0.0%)
0 (0.0%)
7:30 AM to 7:59 AM
0 (0.0%)
0 (0.0%)
8:00 AM to 8:29 AM
0 (0.0%)
0 (0.0%)
8:30 AM to 8:59 AM
0 (0.0%)
1 (100.0%)
9:00 AM to 9:59 AM
0 (0.0%)
0 (0.0%)
10:00 AM to 10:59 AM
0 (0.0%)
0 (0.0%)
11:00 AM to 11:59 AM
0 (0.0%)
0 (0.0%)
12:00 PM to 3:59 PM
1 (100.0%)
0 (0.0%)
4:00 PM to 11:59 PM
0 (0.0%)
0 (0.0%)
Total
1 (100.0%)
1 (100.0%)
Housing Occupancy in Northwest Stanwood
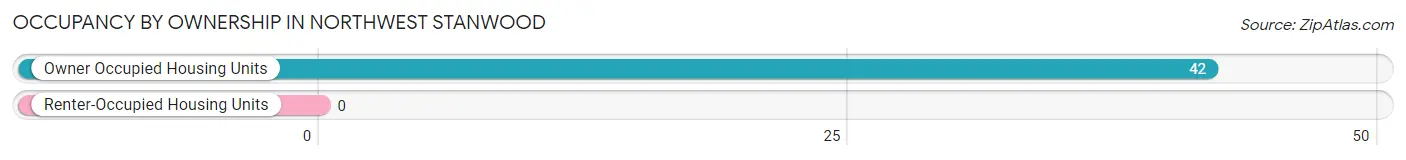
Occupancy by Ownership in Northwest Stanwood
Of the total 42 dwellings in Northwest Stanwood, owner-occupied units account for 42 (100.0%), while renter-occupied units make up 0 (0.0%).
Occupancy
# Housing Units
% Housing Units
Owner Occupied Housing Units
42
100.0%
Renter-Occupied Housing Units
0
0.0%
Total Occupied Housing Units
42
100.0%
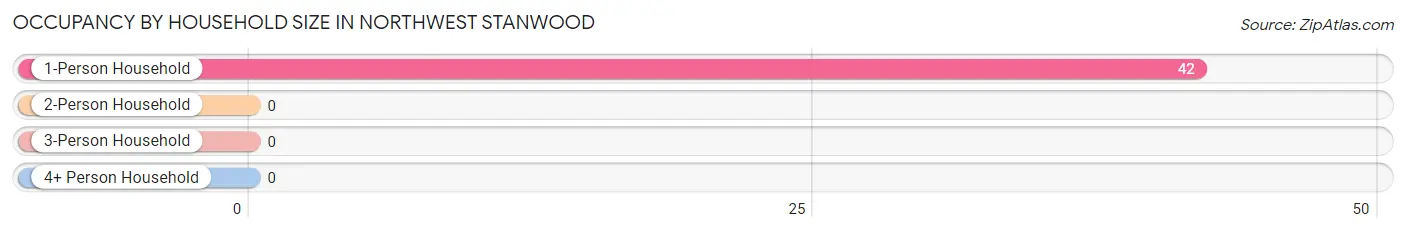
Occupancy by Household Size in Northwest Stanwood
Household Size
# Housing Units
% Housing Units
1-Person Household
42
100.0%
2-Person Household
0
0.0%
3-Person Household
0
0.0%
4+ Person Household
0
0.0%
Total Housing Units
42
100.0%
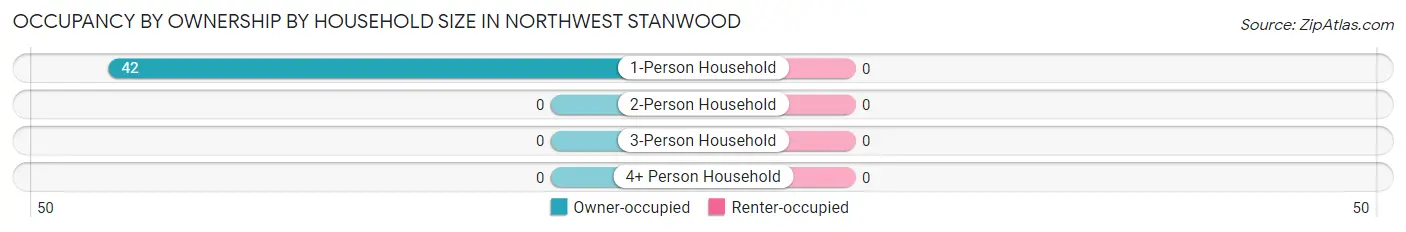
Occupancy by Ownership by Household Size in Northwest Stanwood
Household Size
Owner-occupied
Renter-occupied
1-Person Household
42 (100.0%)
0 (0.0%)
2-Person Household
0 (0.0%)
0 (0.0%)
3-Person Household
0 (0.0%)
0 (0.0%)
4+ Person Household
0 (0.0%)
0 (0.0%)
Total Housing Units
42 (100.0%)
0 (0.0%)
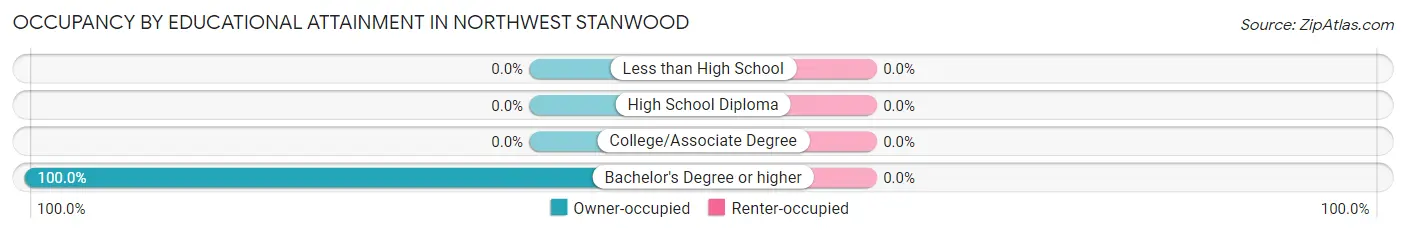
Occupancy by Educational Attainment in Northwest Stanwood
Household Size
Owner-occupied
Renter-occupied
Less than High School
0 (0.0%)
0 (0.0%)
High School Diploma
0 (0.0%)
0 (0.0%)
College/Associate Degree
0 (0.0%)
0 (0.0%)
Bachelor's Degree or higher
42 (100.0%)
0 (0.0%)
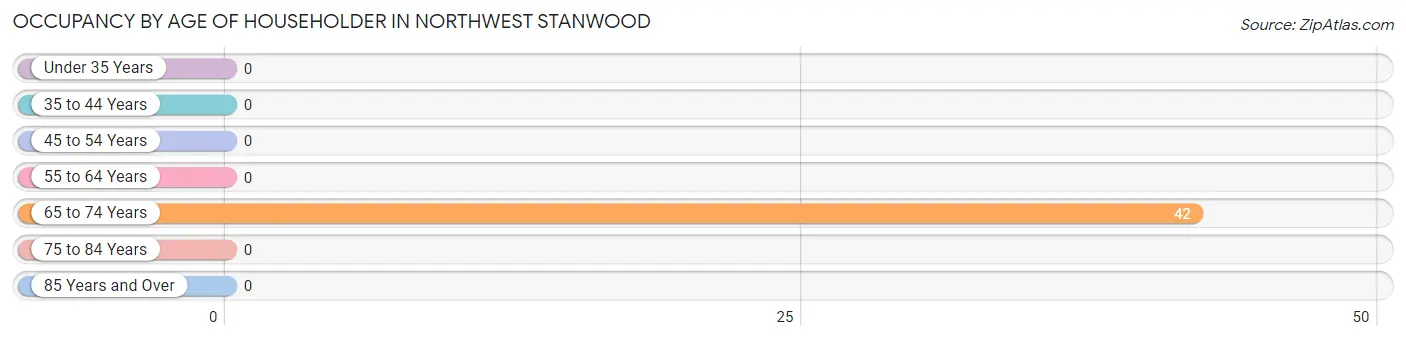
Occupancy by Age of Householder in Northwest Stanwood
Age Bracket
# Households
% Households
Under 35 Years
0
0.0%
35 to 44 Years
0
0.0%
45 to 54 Years
0
0.0%
55 to 64 Years
0
0.0%
65 to 74 Years
42
100.0%
75 to 84 Years
0
0.0%
85 Years and Over
0
0.0%
Total
42
100.0%
Housing Finances in Northwest Stanwood
Median Income by Occupancy in Northwest Stanwood
Occupancy Type
# Households
Median Income
Owner-Occupied
42 (100.0%)
$0
Renter-Occupied
0 (0.0%)
$0
Average
42 (100.0%)
$0
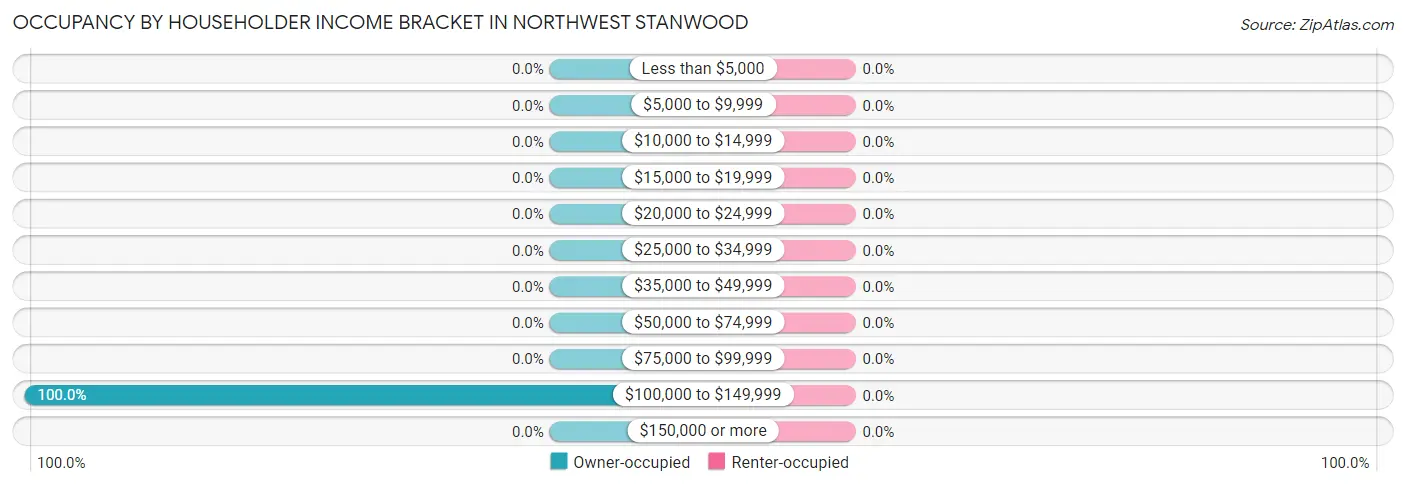
Occupancy by Householder Income Bracket in Northwest Stanwood
Income Bracket
Owner-occupied
Renter-occupied
Less than $5,000
0 (0.0%)
0 (0.0%)
$5,000 to $9,999
0 (0.0%)
0 (0.0%)
$10,000 to $14,999
0 (0.0%)
0 (0.0%)
$15,000 to $19,999
0 (0.0%)
0 (0.0%)
$20,000 to $24,999
0 (0.0%)
0 (0.0%)
$25,000 to $34,999
0 (0.0%)
0 (0.0%)
$35,000 to $49,999
0 (0.0%)
0 (0.0%)
$50,000 to $74,999
0 (0.0%)
0 (0.0%)
$75,000 to $99,999
0 (0.0%)
0 (0.0%)
$100,000 to $149,999
42 (100.0%)
0 (0.0%)
$150,000 or more
0 (0.0%)
0 (0.0%)
Total
42 (100.0%)
0 (0.0%)
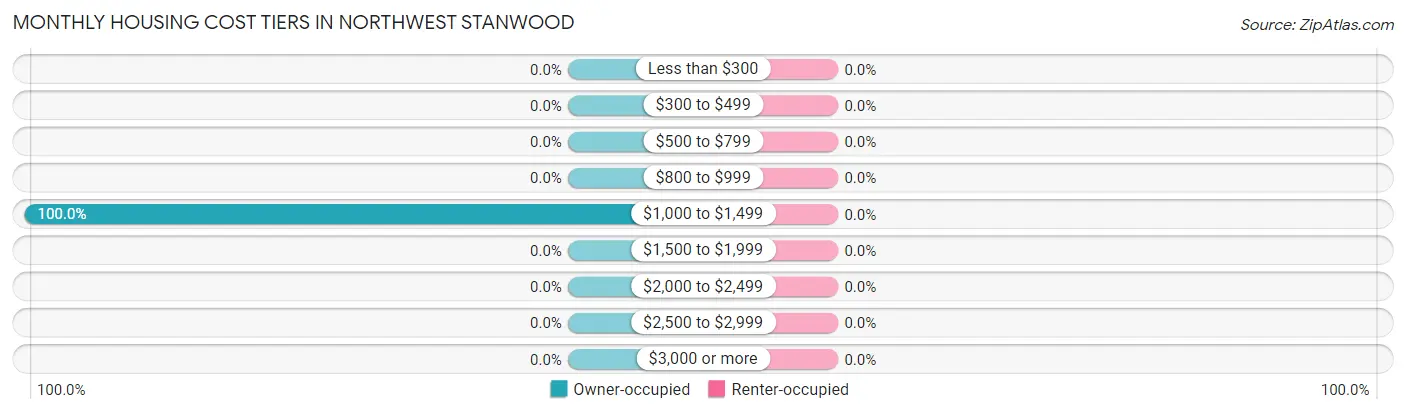
Monthly Housing Cost Tiers in Northwest Stanwood
Monthly Cost
Owner-occupied
Renter-occupied
Less than $300
0 (0.0%)
0 (0.0%)
$300 to $499
0 (0.0%)
0 (0.0%)
$500 to $799
0 (0.0%)
0 (0.0%)
$800 to $999
0 (0.0%)
0 (0.0%)
$1,000 to $1,499
42 (100.0%)
0 (0.0%)
$1,500 to $1,999
0 (0.0%)
0 (0.0%)
$2,000 to $2,499
0 (0.0%)
0 (0.0%)
$2,500 to $2,999
0 (0.0%)
0 (0.0%)
$3,000 or more
0 (0.0%)
0 (0.0%)
Total
42 (100.0%)
0 (0.0%)
Physical Housing Characteristics in Northwest Stanwood
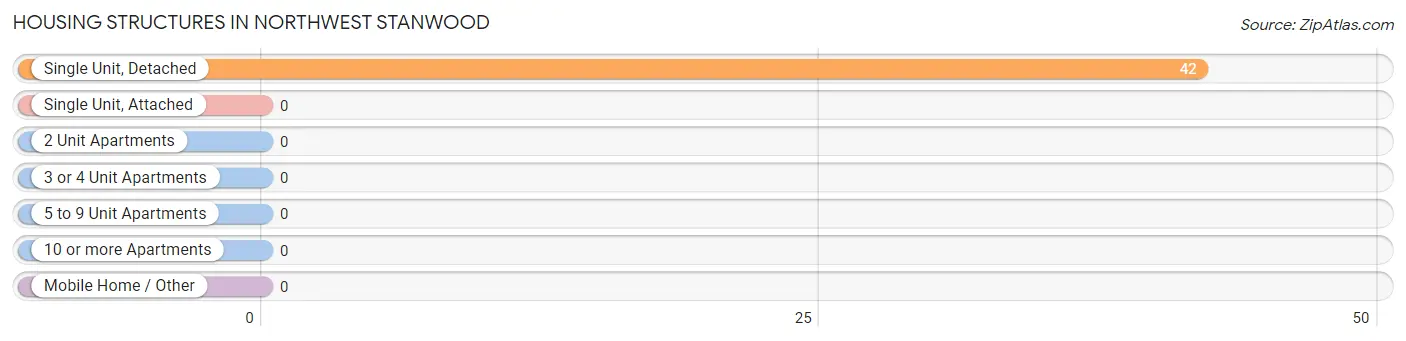
Housing Structures in Northwest Stanwood
Structure Type
# Housing Units
% Housing Units
Single Unit, Detached
42
100.0%
Single Unit, Attached
0
0.0%
2 Unit Apartments
0
0.0%
3 or 4 Unit Apartments
0
0.0%
5 to 9 Unit Apartments
0
0.0%
10 or more Apartments
0
0.0%
Mobile Home / Other
0
0.0%
Total
42
100.0%
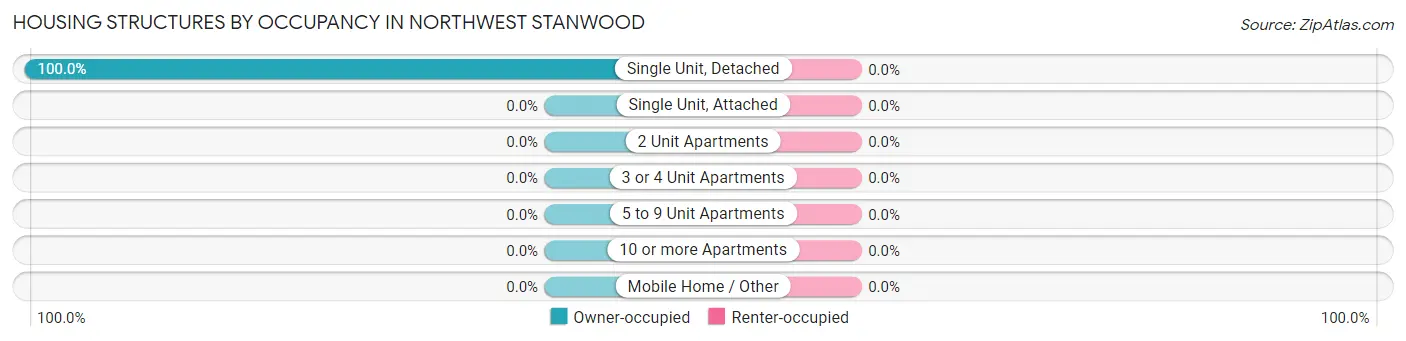
Housing Structures by Occupancy in Northwest Stanwood
Structure Type
Owner-occupied
Renter-occupied
Single Unit, Detached
42 (100.0%)
0 (0.0%)
Single Unit, Attached
0 (0.0%)
0 (0.0%)
2 Unit Apartments
0 (0.0%)
0 (0.0%)
3 or 4 Unit Apartments
0 (0.0%)
0 (0.0%)
5 to 9 Unit Apartments
0 (0.0%)
0 (0.0%)
10 or more Apartments
0 (0.0%)
0 (0.0%)
Mobile Home / Other
0 (0.0%)
0 (0.0%)
Total
42 (100.0%)
0 (0.0%)
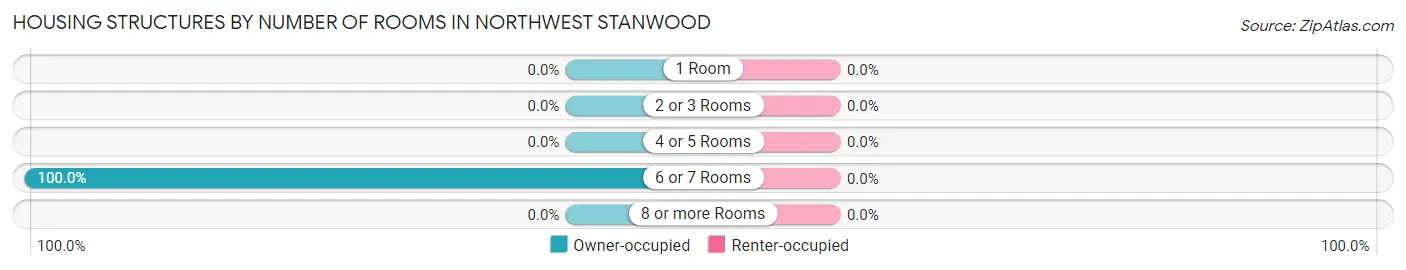
Housing Structures by Number of Rooms in Northwest Stanwood
Number of Rooms
Owner-occupied
Renter-occupied
1 Room
0 (0.0%)
0 (0.0%)
2 or 3 Rooms
0 (0.0%)
0 (0.0%)
4 or 5 Rooms
0 (0.0%)
0 (0.0%)
6 or 7 Rooms
42 (100.0%)
0 (0.0%)
8 or more Rooms
0 (0.0%)
0 (0.0%)
Total
42 (100.0%)
0 (0.0%)
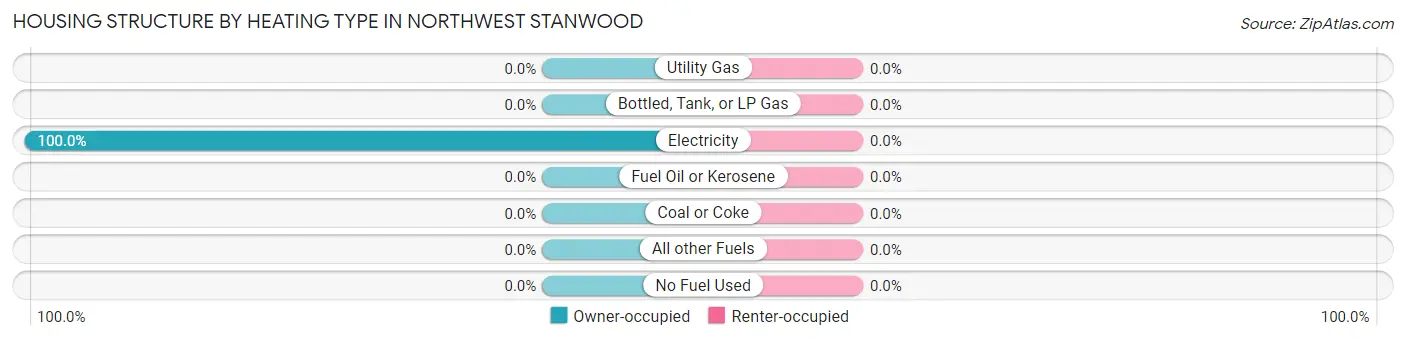
Housing Structure by Heating Type in Northwest Stanwood
Heating Type
Owner-occupied
Renter-occupied
Utility Gas
0 (0.0%)
0 (0.0%)
Bottled, Tank, or LP Gas
0 (0.0%)
0 (0.0%)
Electricity
42 (100.0%)
0 (0.0%)
Fuel Oil or Kerosene
0 (0.0%)
0 (0.0%)
Coal or Coke
0 (0.0%)
0 (0.0%)
All other Fuels
0 (0.0%)
0 (0.0%)
No Fuel Used
0 (0.0%)
0 (0.0%)
Total
42 (100.0%)
0 (0.0%)
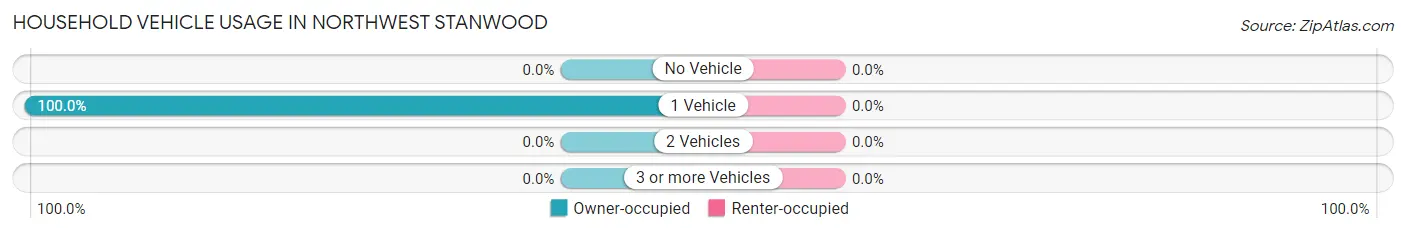
Household Vehicle Usage in Northwest Stanwood
Vehicles per Household
Owner-occupied
Renter-occupied
No Vehicle
0 (0.0%)
0 (0.0%)
1 Vehicle
42 (100.0%)
0 (0.0%)
2 Vehicles
0 (0.0%)
0 (0.0%)
3 or more Vehicles
0 (0.0%)
0 (0.0%)
Total
42 (100.0%)
0 (0.0%)
Real Estate & Mortgages in Northwest Stanwood
Real Estate and Mortgage Overview in Northwest Stanwood
Characteristic
Without Mortgage
With Mortgage
Housing Units
0
42
Median Property Value
-
-
Median Household Income
-
-
Monthly Housing Costs
-
-
Real Estate Taxes
-
-
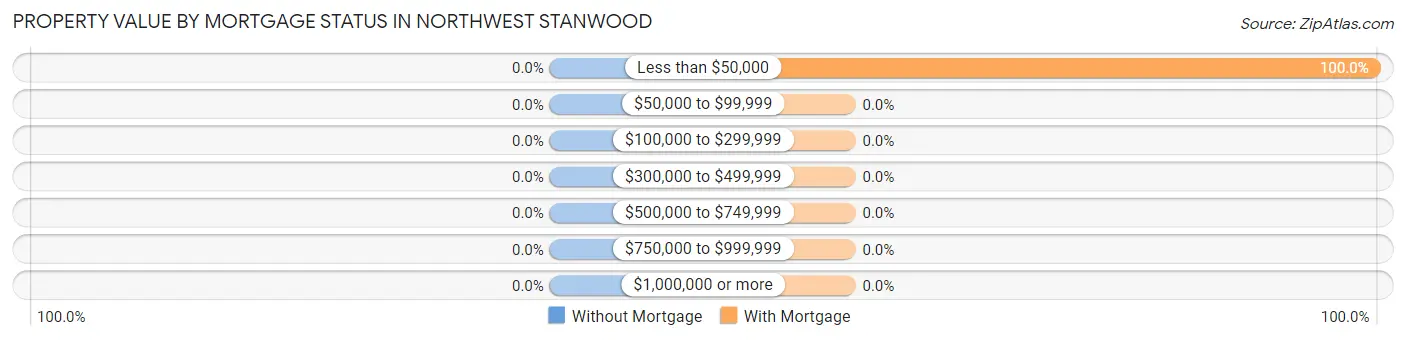
Property Value by Mortgage Status in Northwest Stanwood
Property Value
Without Mortgage
With Mortgage
Less than $50,000
0 (0.0%)
42 (100.0%)
$50,000 to $99,999
0 (0.0%)
0 (0.0%)
$100,000 to $299,999
0 (0.0%)
0 (0.0%)
$300,000 to $499,999
0 (0.0%)
0 (0.0%)
$500,000 to $749,999
0 (0.0%)
0 (0.0%)
$750,000 to $999,999
0 (0.0%)
0 (0.0%)
$1,000,000 or more
0 (0.0%)
0 (0.0%)
Total
0 (0.0%)
42 (100.0%)
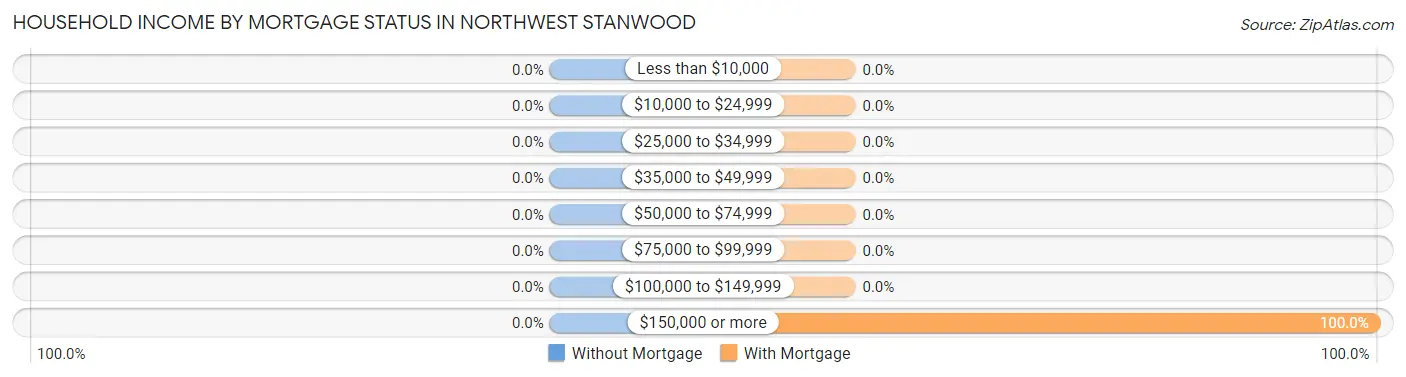
Household Income by Mortgage Status in Northwest Stanwood
Household Income
Without Mortgage
With Mortgage
Less than $10,000
0 (0.0%)
0 (0.0%)
$10,000 to $24,999
0 (0.0%)
0 (0.0%)
$25,000 to $34,999
0 (0.0%)
0 (0.0%)
$35,000 to $49,999
0 (0.0%)
0 (0.0%)
$50,000 to $74,999
0 (0.0%)
0 (0.0%)
$75,000 to $99,999
0 (0.0%)
0 (0.0%)
$100,000 to $149,999
0 (0.0%)
0 (0.0%)
$150,000 or more
0 (0.0%)
42 (100.0%)
Total
0 (0.0%)
42 (100.0%)
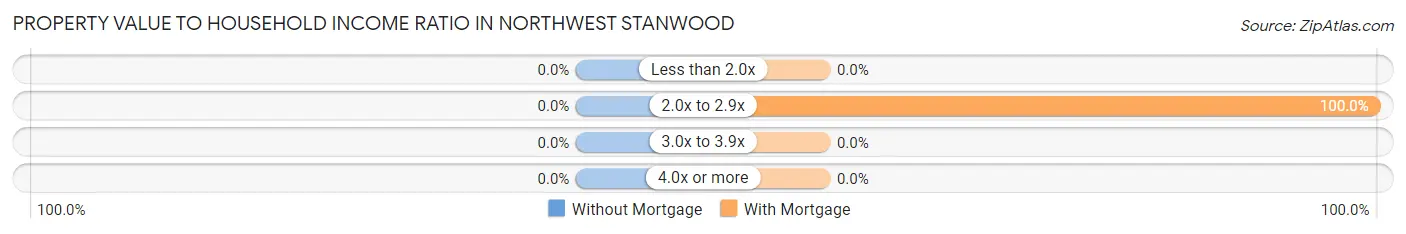
Property Value to Household Income Ratio in Northwest Stanwood
Value-to-Income Ratio
Without Mortgage
With Mortgage
Less than 2.0x
0 (0.0%)
0 (0.0%)
2.0x to 2.9x
0 (0.0%)
42 (100.0%)
3.0x to 3.9x
0 (0.0%)
0 (0.0%)
4.0x or more
0 (0.0%)
0 (0.0%)
Total
0 (0.0%)
42 (100.0%)
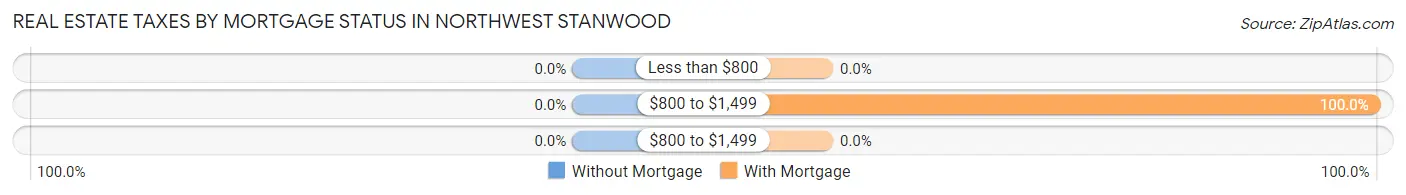
Real Estate Taxes by Mortgage Status in Northwest Stanwood
Property Taxes
Without Mortgage
With Mortgage
Less than $800
0 (0.0%)
0 (0.0%)
$800 to $1,499
0 (0.0%)
42 (100.0%)
$800 to $1,499
0 (0.0%)
0 (0.0%)
Total
0 (0.0%)
42 (100.0%)
Health & Disability in Northwest Stanwood
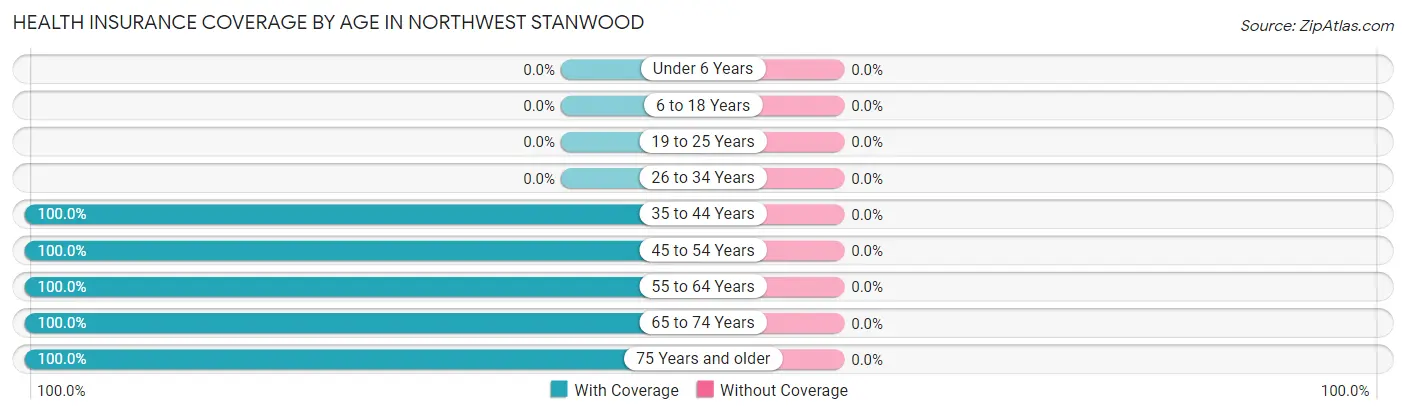
Health Insurance Coverage by Age in Northwest Stanwood
Age Bracket
With Coverage
Without Coverage
Under 6 Years
0 (0.0%)
0 (0.0%)
6 to 18 Years
0 (0.0%)
0 (0.0%)
19 to 25 Years
0 (0.0%)
0 (0.0%)
26 to 34 Years
0 (0.0%)
0 (0.0%)
35 to 44 Years
1 (100.0%)
0 (0.0%)
45 to 54 Years
3 (100.0%)
0 (0.0%)
55 to 64 Years
1 (100.0%)
0 (0.0%)
65 to 74 Years
43 (100.0%)
0 (0.0%)
75 Years and older
2 (100.0%)
0 (0.0%)
Total
50 (100.0%)
0 (0.0%)
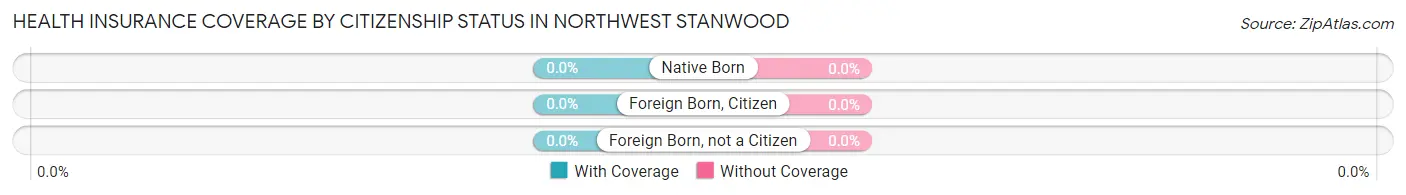
Health Insurance Coverage by Citizenship Status in Northwest Stanwood
Citizenship Status
With Coverage
Without Coverage
Native Born
0 (0.0%)
0 (0.0%)
Foreign Born, Citizen
0 (0.0%)
0 (0.0%)
Foreign Born, not a Citizen
0 (0.0%)
0 (0.0%)
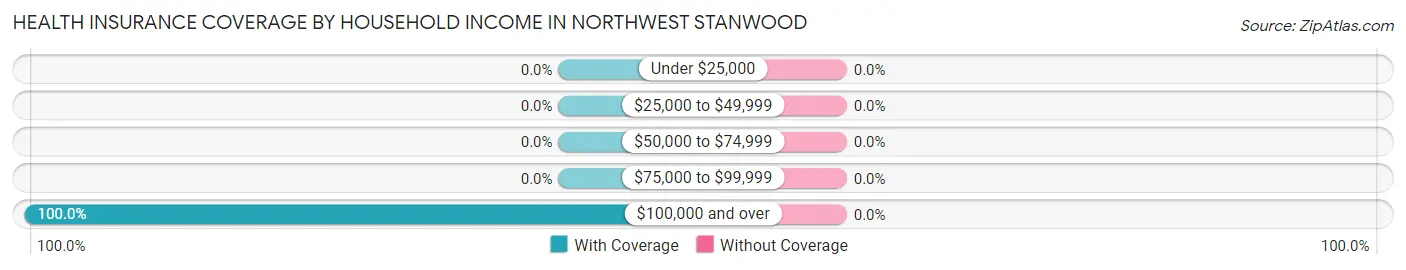
Health Insurance Coverage by Household Income in Northwest Stanwood
Household Income
With Coverage
Without Coverage
Under $25,000
0 (0.0%)
0 (0.0%)
$25,000 to $49,999
0 (0.0%)
0 (0.0%)
$50,000 to $74,999
0 (0.0%)
0 (0.0%)
$75,000 to $99,999
0 (0.0%)
0 (0.0%)
$100,000 and over
42 (100.0%)
0 (0.0%)
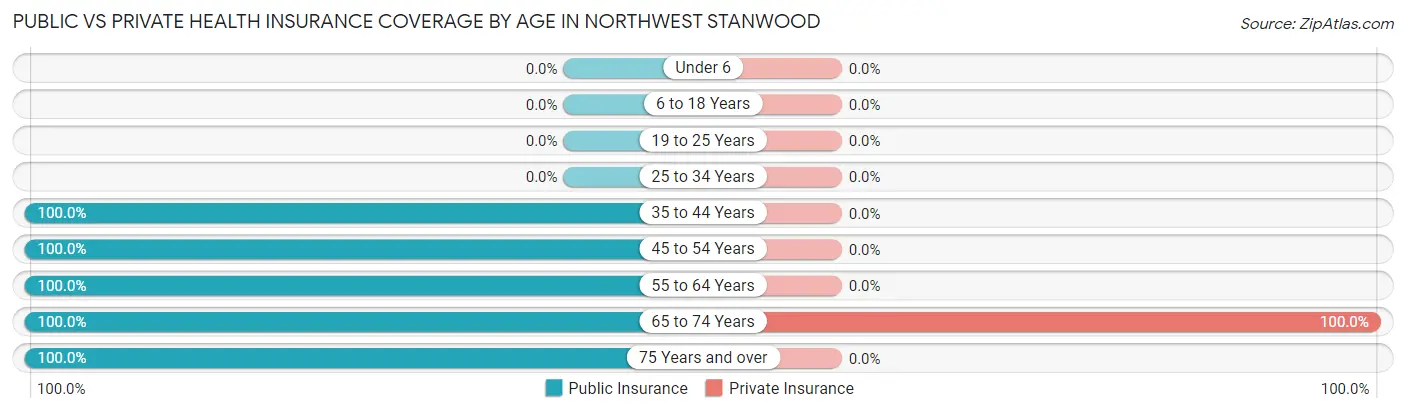
Public vs Private Health Insurance Coverage by Age in Northwest Stanwood
Age Bracket
Public Insurance
Private Insurance
Under 6
0 (0.0%)
0 (0.0%)
6 to 18 Years
0 (0.0%)
0 (0.0%)
19 to 25 Years
0 (0.0%)
0 (0.0%)
25 to 34 Years
0 (0.0%)
0 (0.0%)
35 to 44 Years
1 (100.0%)
0 (0.0%)
45 to 54 Years
3 (100.0%)
0 (0.0%)
55 to 64 Years
1 (100.0%)
0 (0.0%)
65 to 74 Years
43 (100.0%)
43 (100.0%)
75 Years and over
2 (100.0%)
0 (0.0%)
Total
50 (100.0%)
43 (86.0%)
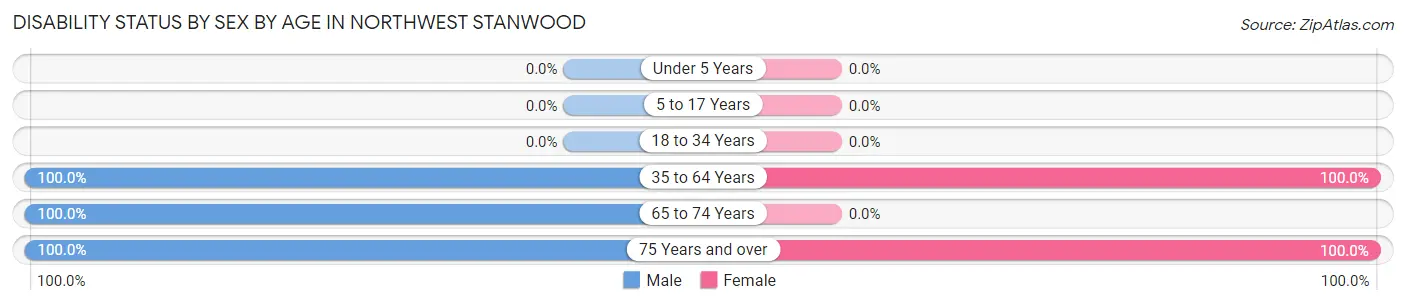
Disability Status by Sex by Age in Northwest Stanwood
Age Bracket
Male
Female
Under 5 Years
0 (0.0%)
0 (0.0%)
5 to 17 Years
0 (0.0%)
0 (0.0%)
18 to 34 Years
0 (0.0%)
0 (0.0%)
35 to 64 Years
2 (100.0%)
3 (100.0%)
65 to 74 Years
1 (100.0%)
0 (0.0%)
75 Years and over
1 (100.0%)
1 (100.0%)
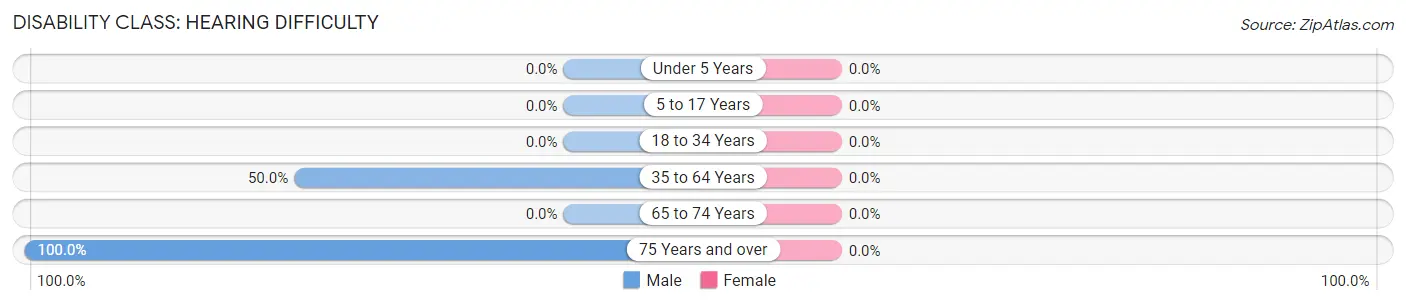
Disability Class by Sex by Age in Northwest Stanwood
Disability Class: Hearing Difficulty
Age Bracket
Male
Female
Under 5 Years
0 (0.0%)
0 (0.0%)
5 to 17 Years
0 (0.0%)
0 (0.0%)
18 to 34 Years
0 (0.0%)
0 (0.0%)
35 to 64 Years
1 (50.0%)
0 (0.0%)
65 to 74 Years
0 (0.0%)
0 (0.0%)
75 Years and over
1 (100.0%)
0 (0.0%)
Disability Class: Vision Difficulty
Age Bracket
Male
Female
Under 5 Years
0 (0.0%)
0 (0.0%)
5 to 17 Years
0 (0.0%)
0 (0.0%)
18 to 34 Years
0 (0.0%)
0 (0.0%)
35 to 64 Years
0 (0.0%)
0 (0.0%)
65 to 74 Years
0 (0.0%)
0 (0.0%)
75 Years and over
0 (0.0%)
0 (0.0%)
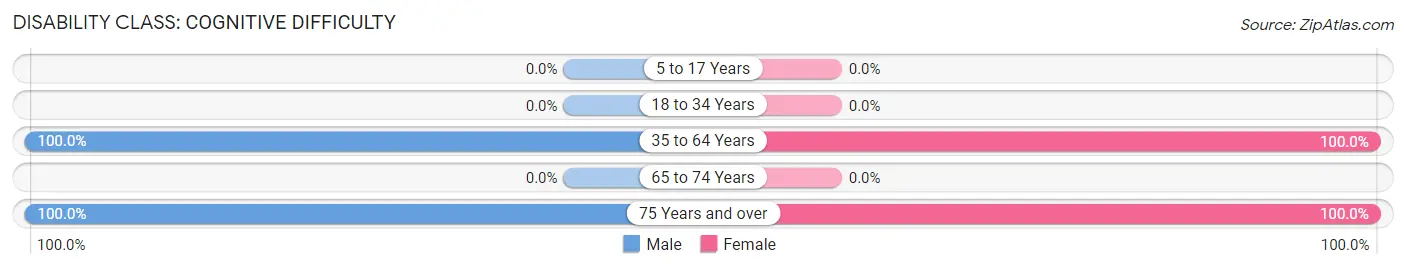
Disability Class: Cognitive Difficulty
Age Bracket
Male
Female
5 to 17 Years
0 (0.0%)
0 (0.0%)
18 to 34 Years
0 (0.0%)
0 (0.0%)
35 to 64 Years
2 (100.0%)
3 (100.0%)
65 to 74 Years
0 (0.0%)
0 (0.0%)
75 Years and over
1 (100.0%)
1 (100.0%)
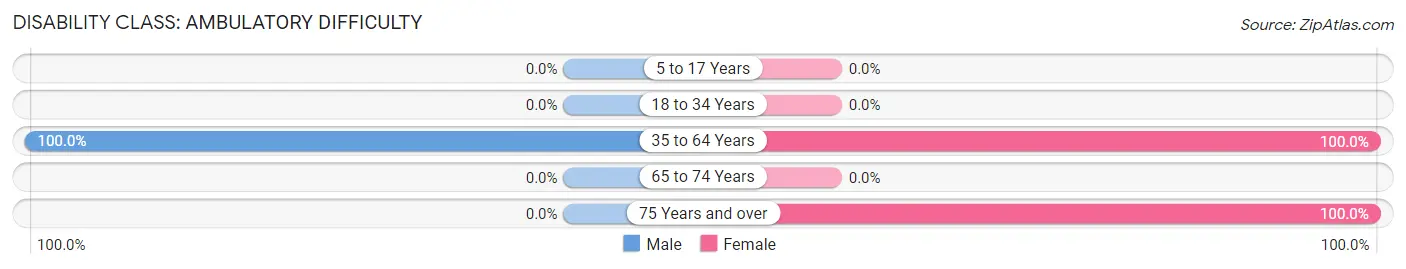
Disability Class: Ambulatory Difficulty
Age Bracket
Male
Female
5 to 17 Years
0 (0.0%)
0 (0.0%)
18 to 34 Years
0 (0.0%)
0 (0.0%)
35 to 64 Years
2 (100.0%)
3 (100.0%)
65 to 74 Years
0 (0.0%)
0 (0.0%)
75 Years and over
0 (0.0%)
1 (100.0%)
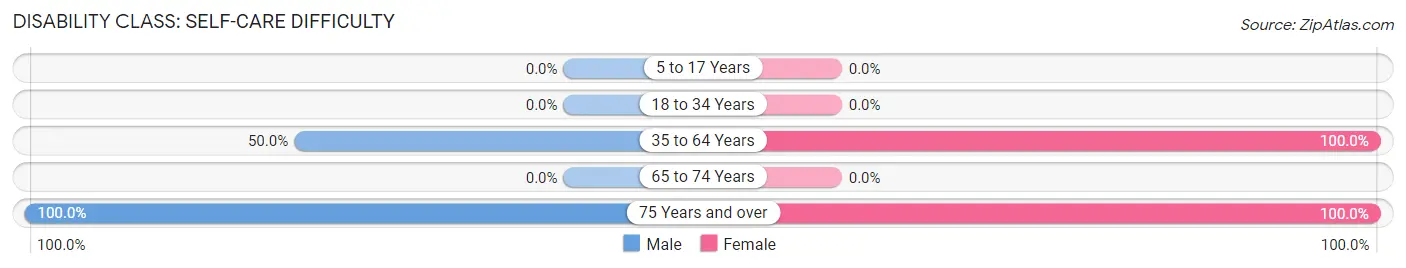
Disability Class: Self-Care Difficulty
Age Bracket
Male
Female
5 to 17 Years
0 (0.0%)
0 (0.0%)
18 to 34 Years
0 (0.0%)
0 (0.0%)
35 to 64 Years
1 (50.0%)
3 (100.0%)
65 to 74 Years
0 (0.0%)
0 (0.0%)
75 Years and over
1 (100.0%)
1 (100.0%)
Technology Access in Northwest Stanwood
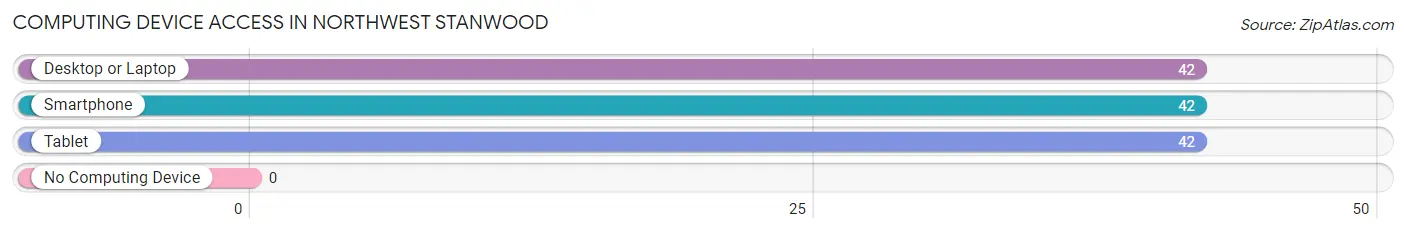
Computing Device Access in Northwest Stanwood
Device Type
# Households
% Households
Desktop or Laptop
42
100.0%
Smartphone
42
100.0%
Tablet
42
100.0%
No Computing Device
0
0.0%
Total
42
100.0%
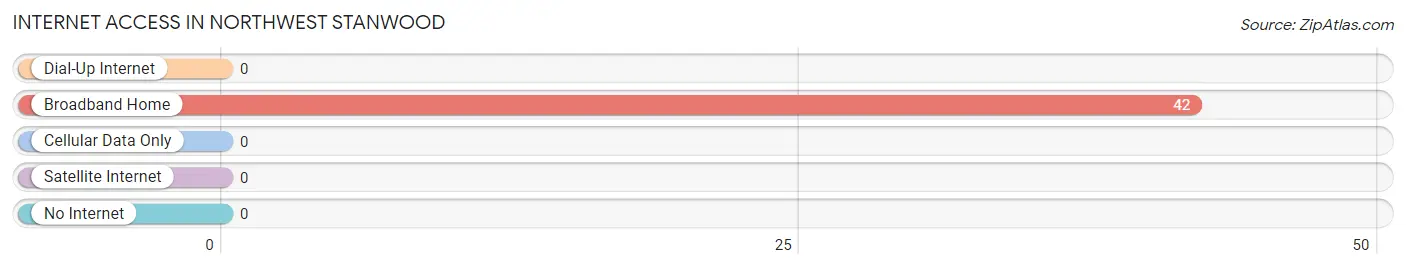
Internet Access in Northwest Stanwood
Internet Type
# Households
% Households
Dial-Up Internet
0
0.0%
Broadband Home
42
100.0%
Cellular Data Only
0
0.0%
Satellite Internet
0
0.0%
No Internet
0
0.0%
Total
42
100.0%
Northwest Stanwood Summary
Northwest Stanwood, Washington is a small town located in Snohomish County, Washington, United States. It is situated on the north bank of the Stillaguamish River, approximately 25 miles north of Seattle. The town has a population of approximately 5,000 people and is part of the larger Stanwood-Camano Island metropolitan area.
History
The area that is now Northwest Stanwood was first settled in the late 1800s by homesteaders and loggers. The town was officially incorporated in 1909 and was named after the nearby Stanwood Creek. The town grew rapidly in the early 20th century, with the arrival of the Great Northern Railway in 1910 and the opening of the Stanwood-Camano Island Ferry in 1911.
The town was a major logging center in the early 20th century, with several sawmills and logging camps in the area. The town also had a thriving fishing industry, with several canneries located along the Stillaguamish River.
Geography
Northwest Stanwood is located in the northwest corner of Snohomish County, Washington, approximately 25 miles north of Seattle. The town is situated on the north bank of the Stillaguamish River, and is bordered by the cities of Camano Island to the west and Arlington to the east. The town is located in the foothills of the Cascade Mountains, and is surrounded by forests and rolling hills.
The climate in Northwest Stanwood is mild and temperate, with warm summers and cool winters. The average annual temperature is around 50 degrees Fahrenheit, and the average annual precipitation is around 40 inches.
Economy
The economy of Northwest Stanwood is largely based on agriculture and tourism. The town is home to several farms and orchards, and is a popular destination for outdoor recreation. The town is also home to several small businesses, including restaurants, shops, and galleries.
Demographics
As of the 2010 census, the population of Northwest Stanwood was 5,000 people. The racial makeup of the town was 94.3% White, 0.7% African American, 0.7% Native American, 0.7% Asian, 0.3% Pacific Islander, and 2.7% from other races. The median household income was $50,000, and the median family income was $60,000. The per capita income was $25,000.
Conclusion
Northwest Stanwood, Washington is a small town located in Snohomish County, Washington, United States. It is situated on the north bank of the Stillaguamish River, approximately 25 miles north of Seattle. The town has a population of approximately 5,000 people and is part of the larger Stanwood-Camano Island metropolitan area. The economy of Northwest Stanwood is largely based on agriculture and tourism, and the town is home to several farms and orchards, as well as small businesses. The racial makeup of the town is predominantly White, with a small percentage of African American, Native American, Asian, and Pacific Islander residents. The median household income is $50,000, and the median family income is $60,000.
Common Questions
What is Per Capita Income in Northwest Stanwood?
Per Capita income in Northwest Stanwood is $96,958.
What is the Total Population of Northwest Stanwood?
Total Population of Northwest Stanwood is 50.
What is the Total Male Population of Northwest Stanwood?
Total Male Population of Northwest Stanwood is 4.
What is the Total Female Population of Northwest Stanwood?
Total Female Population of Northwest Stanwood is 46.
What is the Ratio of Males per 100 Females in Northwest Stanwood?
There are 8.70 Males per 100 Females in Northwest Stanwood.
What is the Ratio of Females per 100 Males in Northwest Stanwood?
There are 1,150.00 Females per 100 Males in Northwest Stanwood.
What is the Median Population Age in Northwest Stanwood?
Median Population Age in Northwest Stanwood is 74.5 Years.
How Large is the Labor Force in Northwest Stanwood?
There are 2 People in the Labor Forcein in Northwest Stanwood.
What is the Percentage of People in the Labor Force in Northwest Stanwood?
4.0% of People are in the Labor Force in Northwest Stanwood.
Report Title
Report Link
HTML Copy & Paste Link
Social Media
Copy and paste the folowing code into any webpage where you would like this interactive chart to display