Cities with the Most Immigrants from Belarus in Washington
RELATED REPORTS & OPTIONS
Belarus
Washington
Compare Cities
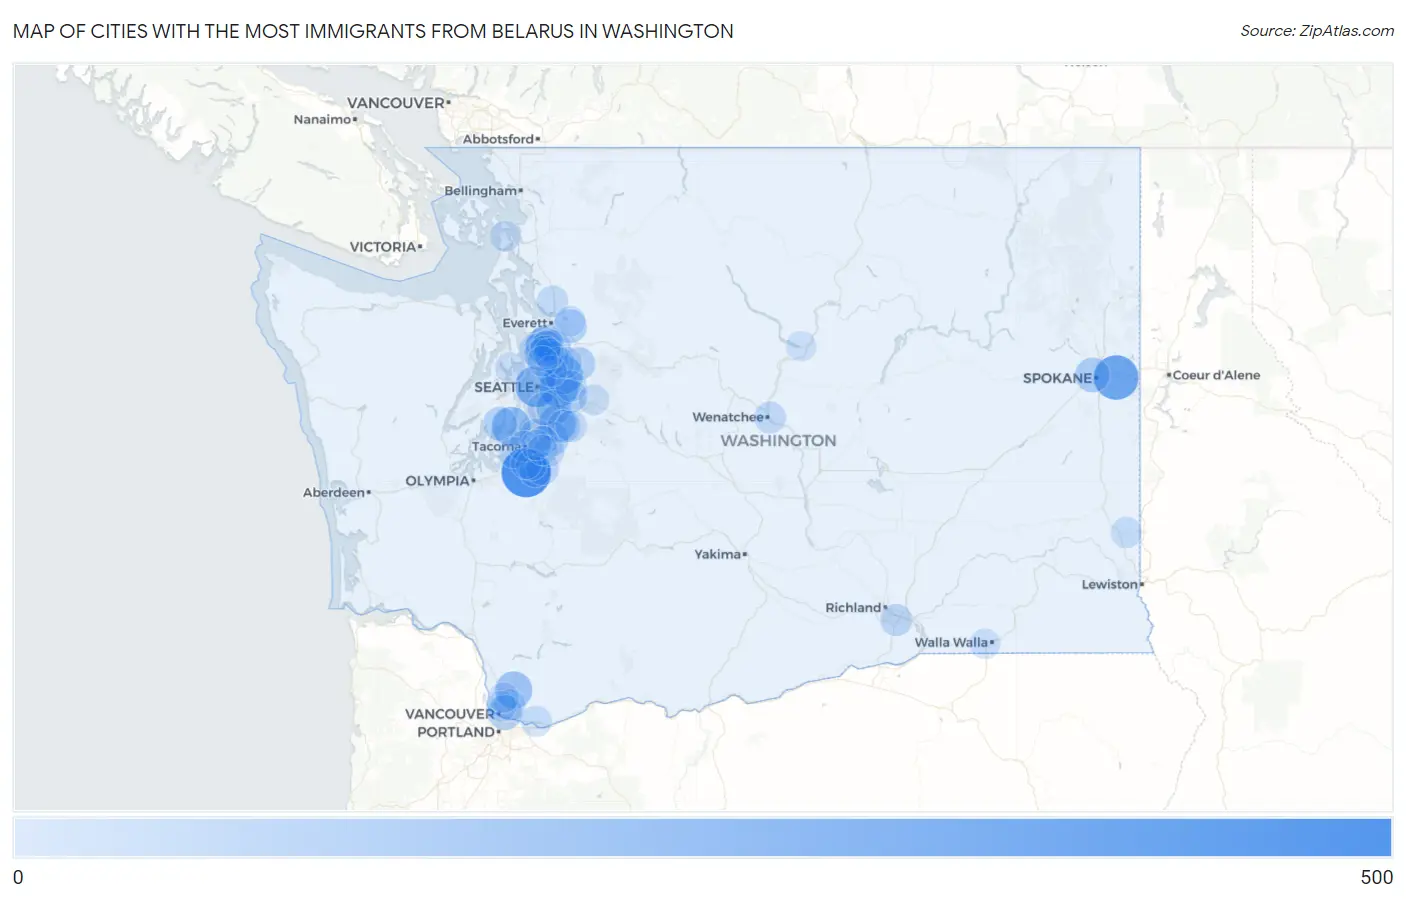
Map of Cities with the Most Immigrants from Belarus in Washington
0
500
Cities with the Most Immigrants from Belarus in Washington
| City | Belarus | vs State | vs National | |
| 1. | Spanaway | 420 | 4,177(10.06%)#1 | 71,687(0.59%)#12 |
| 2. | Spokane Valley | 311 | 4,177(7.45%)#2 | 71,687(0.43%)#21 |
| 3. | Seattle | 241 | 4,177(5.77%)#3 | 71,687(0.34%)#31 |
| 4. | Bellevue | 198 | 4,177(4.74%)#4 | 71,687(0.28%)#40 |
| 5. | Maplewood | 184 | 4,177(4.41%)#5 | 71,687(0.26%)#45 |
| 6. | Redmond | 175 | 4,177(4.19%)#6 | 71,687(0.24%)#48 |
| 7. | Kent | 148 | 4,177(3.54%)#7 | 71,687(0.21%)#60 |
| 8. | Battle Ground | 148 | 4,177(3.54%)#8 | 71,687(0.21%)#61 |
| 9. | North Lynnwood | 110 | 4,177(2.63%)#9 | 71,687(0.15%)#88 |
| 10. | Vancouver | 101 | 4,177(2.42%)#10 | 71,687(0.14%)#103 |
| 11. | Renton | 101 | 4,177(2.42%)#11 | 71,687(0.14%)#104 |
| 12. | Spokane | 98 | 4,177(2.35%)#12 | 71,687(0.14%)#106 |
| 13. | Auburn | 97 | 4,177(2.32%)#13 | 71,687(0.14%)#109 |
| 14. | Federal Way | 91 | 4,177(2.18%)#14 | 71,687(0.13%)#117 |
| 15. | Mill Creek East | 82 | 4,177(1.96%)#15 | 71,687(0.11%)#129 |
| 16. | Issaquah | 80 | 4,177(1.92%)#16 | 71,687(0.11%)#130 |
| 17. | Wauna | 80 | 4,177(1.92%)#17 | 71,687(0.11%)#131 |
| 18. | Everett | 75 | 4,177(1.80%)#18 | 71,687(0.10%)#149 |
| 19. | Duvall | 69 | 4,177(1.65%)#19 | 71,687(0.10%)#165 |
| 20. | Lake Stickney | 66 | 4,177(1.58%)#20 | 71,687(0.09%)#175 |
| 21. | Lynnwood | 65 | 4,177(1.56%)#21 | 71,687(0.09%)#180 |
| 22. | Tukwila | 61 | 4,177(1.46%)#22 | 71,687(0.09%)#194 |
| 23. | Covington | 57 | 4,177(1.36%)#23 | 71,687(0.08%)#207 |
| 24. | South Hill | 49 | 4,177(1.17%)#24 | 71,687(0.07%)#237 |
| 25. | Bothell | 45 | 4,177(1.08%)#25 | 71,687(0.06%)#262 |
| 26. | Kennewick | 41 | 4,177(0.98%)#26 | 71,687(0.06%)#294 |
| 27. | Edmonds | 38 | 4,177(0.91%)#27 | 71,687(0.05%)#315 |
| 28. | Frederickson | 34 | 4,177(0.81%)#28 | 71,687(0.05%)#342 |
| 29. | East Wenatchee | 34 | 4,177(0.81%)#29 | 71,687(0.05%)#346 |
| 30. | Mountlake Terrace | 32 | 4,177(0.77%)#30 | 71,687(0.04%)#366 |
| 31. | Marysville | 30 | 4,177(0.72%)#31 | 71,687(0.04%)#382 |
| 32. | Maple Valley | 28 | 4,177(0.67%)#32 | 71,687(0.04%)#414 |
| 33. | Martha Lake | 26 | 4,177(0.62%)#33 | 71,687(0.04%)#439 |
| 34. | Five Corners | 26 | 4,177(0.62%)#34 | 71,687(0.04%)#440 |
| 35. | University Place | 25 | 4,177(0.60%)#35 | 71,687(0.03%)#451 |
| 36. | Larch Way | 23 | 4,177(0.55%)#36 | 71,687(0.03%)#493 |
| 37. | Sammamish | 22 | 4,177(0.53%)#37 | 71,687(0.03%)#499 |
| 38. | Tacoma | 21 | 4,177(0.50%)#38 | 71,687(0.03%)#510 |
| 39. | Pullman | 21 | 4,177(0.50%)#39 | 71,687(0.03%)#517 |
| 40. | Washougal | 21 | 4,177(0.50%)#40 | 71,687(0.03%)#520 |
| 41. | Woodinville | 21 | 4,177(0.50%)#41 | 71,687(0.03%)#521 |
| 42. | Sumner | 21 | 4,177(0.50%)#42 | 71,687(0.03%)#522 |
| 43. | Clear Lake Cdp Skagit County | 21 | 4,177(0.50%)#43 | 71,687(0.03%)#528 |
| 44. | Cottage Lake | 20 | 4,177(0.48%)#44 | 71,687(0.03%)#538 |
| 45. | Alderwood Manor | 20 | 4,177(0.48%)#45 | 71,687(0.03%)#543 |
| 46. | Kirkland | 19 | 4,177(0.45%)#46 | 71,687(0.03%)#553 |
| 47. | Snoqualmie | 16 | 4,177(0.38%)#47 | 71,687(0.02%)#616 |
| 48. | Clover Creek | 15 | 4,177(0.36%)#48 | 71,687(0.02%)#642 |
| 49. | Lakeland South | 13 | 4,177(0.31%)#49 | 71,687(0.02%)#688 |
| 50. | Parkland | 11 | 4,177(0.26%)#50 | 71,687(0.02%)#734 |
| 51. | Bothell West | 11 | 4,177(0.26%)#51 | 71,687(0.02%)#739 |
| 52. | Machias | 9 | 4,177(0.22%)#52 | 71,687(0.01%)#808 |
| 53. | Anacortes | 8 | 4,177(0.19%)#53 | 71,687(0.01%)#820 |
| 54. | Edgewood | 8 | 4,177(0.19%)#54 | 71,687(0.01%)#821 |
| 55. | Fairwood Cdp Spokane County | 8 | 4,177(0.19%)#55 | 71,687(0.01%)#825 |
| 56. | Garrett | 8 | 4,177(0.19%)#56 | 71,687(0.01%)#832 |
| 57. | Hazel Dell | 7 | 4,177(0.17%)#57 | 71,687(0.01%)#847 |
| 58. | Lake Forest Park | 7 | 4,177(0.17%)#58 | 71,687(0.01%)#852 |
| 59. | Mount Vista | 7 | 4,177(0.17%)#59 | 71,687(0.01%)#856 |
| 60. | Fife Heights | 6 | 4,177(0.14%)#60 | 71,687(0.01%)#895 |
| 61. | Suquamish | 4 | 4,177(0.10%)#61 | 71,687(0.01%)#929 |
| 62. | Chelan | 2 | 4,177(0.05%)#62 | 71,687(0.00%)#953 |
Common Questions
What are the Top 10 Cities with the Most Immigrants from Belarus in Washington?
Top 10 Cities with the Most Immigrants from Belarus in Washington are:
#1
420
#2
311
#3
241
#4
198
#5
184
#6
175
#7
148
#8
148
#9
110
#10
101
What city has the Most Immigrants from Belarus in Washington?
Spanaway has the Most Immigrants from Belarus in Washington with 420.
What is the Total Immigrants from Belarus in the State of Washington?
Total Immigrants from Belarus in Washington is 4,177.
What is the Total Immigrants from Belarus in the United States?
Total Immigrants from Belarus in the United States is 71,687.