Cities with the Lowest Child Poverty Level Among Boys Under the Age of 16 in Washington
RELATED REPORTS & OPTIONS
Lowest Poverty | Boys 0-16
Washington
Compare Cities
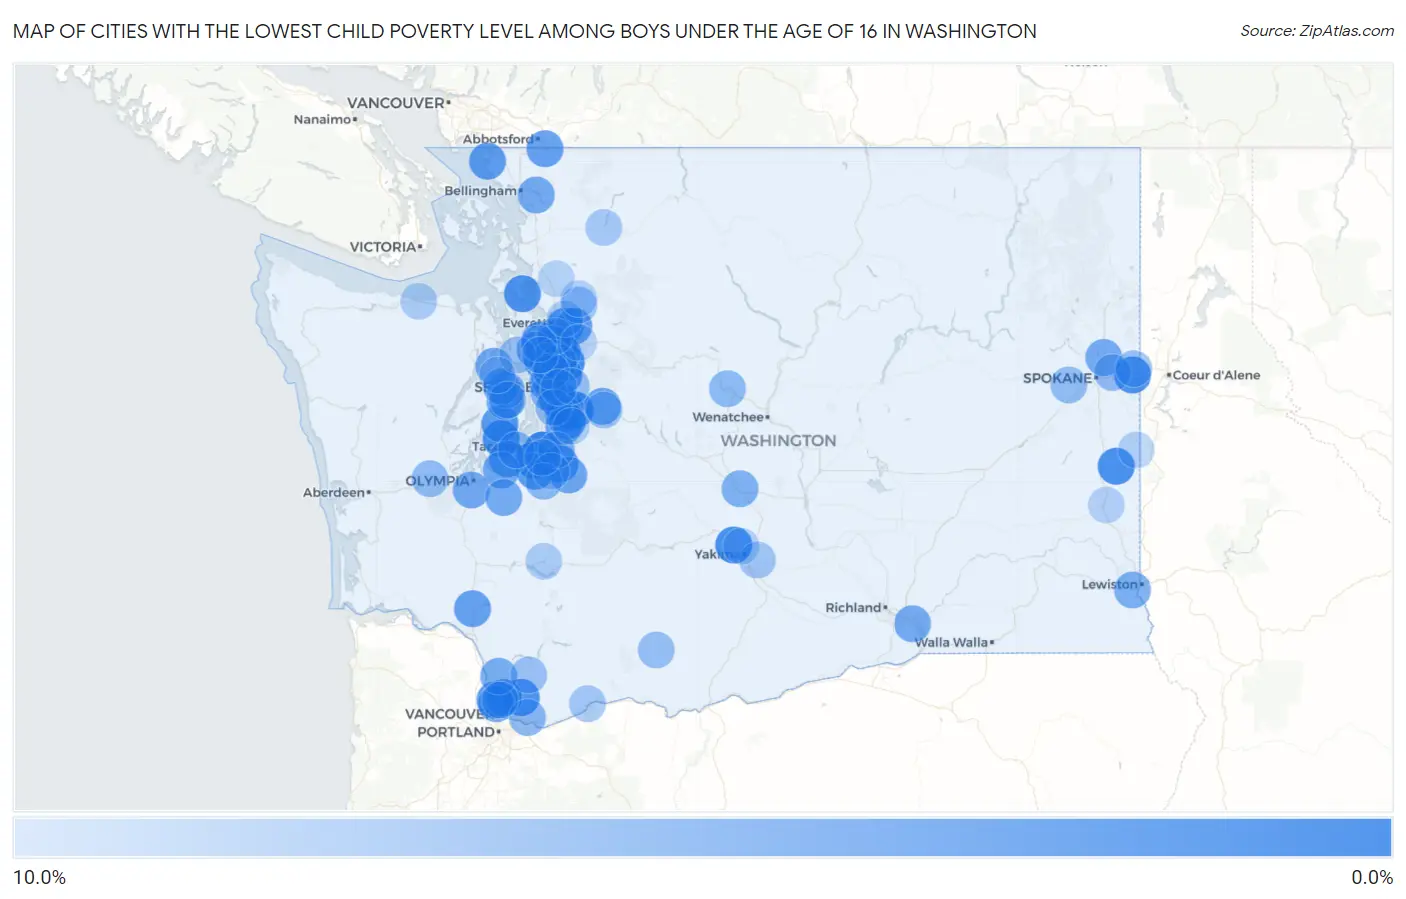
Map of Cities with the Lowest Child Poverty Level Among Boys Under the Age of 16 in Washington
10.0%
0.0%
Cities with the Lowest Child Poverty Level Among Boys Under the Age of 16 in Washington
| City | Child Poverty (Boys) | vs State | vs National | |
| 1. | Edgewood | 0.090% | 12.2%(-12.1)#1 | 16.9%(-16.8)#2 |
| 2. | Cottage Lake | 0.61% | 12.2%(-11.6)#2 | 16.9%(-16.3)#57 |
| 3. | Bothell East | 0.66% | 12.2%(-11.5)#3 | 16.9%(-16.2)#70 |
| 4. | Summit | 0.73% | 12.2%(-11.5)#4 | 16.9%(-16.2)#90 |
| 5. | East Renton Highlands | 0.76% | 12.2%(-11.4)#5 | 16.9%(-16.1)#103 |
| 6. | Brier | 1.0% | 12.2%(-11.2)#6 | 16.9%(-15.9)#172 |
| 7. | Tehaleh | 1.0% | 12.2%(-11.2)#7 | 16.9%(-15.9)#173 |
| 8. | Mirrormont | 1.1% | 12.2%(-11.1)#8 | 16.9%(-15.8)#191 |
| 9. | Artondale | 1.1% | 12.2%(-11.1)#9 | 16.9%(-15.8)#194 |
| 10. | Newcastle | 1.2% | 12.2%(-11.0)#10 | 16.9%(-15.7)#258 |
| 11. | Oakesdale | 1.3% | 12.2%(-10.9)#11 | 16.9%(-15.6)#290 |
| 12. | Gleed | 1.3% | 12.2%(-10.9)#12 | 16.9%(-15.6)#297 |
| 13. | Camano | 1.4% | 12.2%(-10.8)#13 | 16.9%(-15.5)#327 |
| 14. | Liberty Lake | 1.4% | 12.2%(-10.8)#14 | 16.9%(-15.5)#343 |
| 15. | Bothell West | 1.5% | 12.2%(-10.7)#15 | 16.9%(-15.4)#350 |
| 16. | Hockinson | 1.5% | 12.2%(-10.7)#16 | 16.9%(-15.4)#372 |
| 17. | Clearview | 1.9% | 12.2%(-10.3)#17 | 16.9%(-15.0)#557 |
| 18. | Lake Forest Park | 1.9% | 12.2%(-10.3)#18 | 16.9%(-15.0)#561 |
| 19. | Redmond | 1.9% | 12.2%(-10.3)#19 | 16.9%(-15.0)#567 |
| 20. | Felida | 1.9% | 12.2%(-10.2)#20 | 16.9%(-15.0)#600 |
| 21. | Prairie Ridge | 2.0% | 12.2%(-10.2)#21 | 16.9%(-14.9)#606 |
| 22. | Bunk Foss | 2.1% | 12.2%(-10.1)#22 | 16.9%(-14.8)#674 |
| 23. | Picnic Point | 2.1% | 12.2%(-10.1)#23 | 16.9%(-14.8)#680 |
| 24. | Mount Vista | 2.1% | 12.2%(-10.1)#24 | 16.9%(-14.8)#682 |
| 25. | Wauna | 2.2% | 12.2%(-10.0)#25 | 16.9%(-14.7)#738 |
| 26. | Frederickson | 2.2% | 12.2%(-10.0)#26 | 16.9%(-14.7)#744 |
| 27. | Mill Creek East | 2.3% | 12.2%(-9.91)#27 | 16.9%(-14.6)#807 |
| 28. | Birch Bay | 2.5% | 12.2%(-9.68)#28 | 16.9%(-14.4)#935 |
| 29. | Snohomish | 2.5% | 12.2%(-9.68)#29 | 16.9%(-14.4)#938 |
| 30. | Maltby | 2.8% | 12.2%(-9.44)#30 | 16.9%(-14.2)#1,075 |
| 31. | Steilacoom | 2.9% | 12.2%(-9.26)#31 | 16.9%(-14.0)#1,179 |
| 32. | Sumas | 2.9% | 12.2%(-9.25)#32 | 16.9%(-14.0)#1,184 |
| 33. | Castle Rock | 3.0% | 12.2%(-9.17)#33 | 16.9%(-13.9)#1,242 |
| 34. | Yarrow Point | 3.0% | 12.2%(-9.16)#34 | 16.9%(-13.9)#1,251 |
| 35. | Maple Heights Lake Desire | 3.1% | 12.2%(-9.04)#35 | 16.9%(-13.8)#1,329 |
| 36. | Covington | 3.2% | 12.2%(-8.95)#36 | 16.9%(-13.7)#1,388 |
| 37. | East Port Orchard | 3.4% | 12.2%(-8.81)#37 | 16.9%(-13.5)#1,480 |
| 38. | North Bend | 3.4% | 12.2%(-8.75)#38 | 16.9%(-13.5)#1,504 |
| 39. | Carbonado | 3.4% | 12.2%(-8.74)#39 | 16.9%(-13.5)#1,516 |
| 40. | Mill Creek | 3.5% | 12.2%(-8.72)#40 | 16.9%(-13.4)#1,531 |
| 41. | Shadow Lake | 3.5% | 12.2%(-8.72)#41 | 16.9%(-13.4)#1,532 |
| 42. | Dupont | 3.5% | 12.2%(-8.70)#42 | 16.9%(-13.4)#1,543 |
| 43. | Enetai | 3.7% | 12.2%(-8.52)#43 | 16.9%(-13.2)#1,639 |
| 44. | Tumwater | 3.7% | 12.2%(-8.50)#44 | 16.9%(-13.2)#1,650 |
| 45. | Sudden Valley | 3.9% | 12.2%(-8.29)#45 | 16.9%(-13.0)#1,770 |
| 46. | Mead | 3.9% | 12.2%(-8.27)#46 | 16.9%(-13.0)#1,780 |
| 47. | Yelm | 3.9% | 12.2%(-8.26)#47 | 16.9%(-13.0)#1,787 |
| 48. | Bangor Base | 4.0% | 12.2%(-8.24)#48 | 16.9%(-12.9)#1,801 |
| 49. | Finley | 4.0% | 12.2%(-8.22)#49 | 16.9%(-12.9)#1,809 |
| 50. | Edmonds | 4.1% | 12.2%(-8.08)#50 | 16.9%(-12.8)#1,883 |
| 51. | Lake Shore | 4.2% | 12.2%(-7.98)#51 | 16.9%(-12.7)#1,936 |
| 52. | Suncrest | 4.2% | 12.2%(-7.97)#52 | 16.9%(-12.7)#1,940 |
| 53. | Tracyton | 4.2% | 12.2%(-7.95)#53 | 16.9%(-12.7)#1,956 |
| 54. | Lake Tapps | 4.2% | 12.2%(-7.95)#54 | 16.9%(-12.7)#1,957 |
| 55. | La Center | 4.3% | 12.2%(-7.92)#55 | 16.9%(-12.6)#1,971 |
| 56. | Clarkston Heights Vineland | 4.4% | 12.2%(-7.82)#56 | 16.9%(-12.5)#2,039 |
| 57. | Bothell | 4.5% | 12.2%(-7.72)#57 | 16.9%(-12.4)#2,098 |
| 58. | Medina | 4.5% | 12.2%(-7.66)#58 | 16.9%(-12.4)#2,121 |
| 59. | Ellensburg | 4.6% | 12.2%(-7.59)#59 | 16.9%(-12.3)#2,169 |
| 60. | Mercer Island | 4.8% | 12.2%(-7.40)#60 | 16.9%(-12.1)#2,272 |
| 61. | Kenmore | 4.8% | 12.2%(-7.38)#61 | 16.9%(-12.1)#2,280 |
| 62. | Woodinville | 5.2% | 12.2%(-7.04)#62 | 16.9%(-11.8)#2,492 |
| 63. | Camas | 5.2% | 12.2%(-6.98)#63 | 16.9%(-11.7)#2,532 |
| 64. | Graham | 5.3% | 12.2%(-6.91)#64 | 16.9%(-11.6)#2,582 |
| 65. | Kirkland | 5.3% | 12.2%(-6.90)#65 | 16.9%(-11.6)#2,588 |
| 66. | Parkwood | 5.4% | 12.2%(-6.84)#66 | 16.9%(-11.5)#2,625 |
| 67. | Leavenworth | 5.5% | 12.2%(-6.72)#67 | 16.9%(-11.4)#2,709 |
| 68. | Fircrest | 5.6% | 12.2%(-6.55)#68 | 16.9%(-11.3)#2,806 |
| 69. | Millwood | 5.7% | 12.2%(-6.49)#69 | 16.9%(-11.2)#2,834 |
| 70. | Mccleary | 5.8% | 12.2%(-6.42)#70 | 16.9%(-11.1)#2,877 |
| 71. | Fairchild Afb | 5.8% | 12.2%(-6.37)#71 | 16.9%(-11.1)#2,913 |
| 72. | Renton | 5.9% | 12.2%(-6.27)#72 | 16.9%(-11.0)#2,968 |
| 73. | Sammamish | 6.0% | 12.2%(-6.19)#73 | 16.9%(-10.9)#3,003 |
| 74. | Glenwood | 6.1% | 12.2%(-6.13)#74 | 16.9%(-10.8)#3,049 |
| 75. | Granite Falls | 6.2% | 12.2%(-5.99)#75 | 16.9%(-10.7)#3,123 |
| 76. | Kingston | 6.2% | 12.2%(-5.98)#76 | 16.9%(-10.7)#3,125 |
| 77. | Yacolt | 6.2% | 12.2%(-5.94)#77 | 16.9%(-10.7)#3,144 |
| 78. | Otis Orchards East Farms | 6.4% | 12.2%(-5.84)#78 | 16.9%(-10.6)#3,227 |
| 79. | Riverbend | 6.4% | 12.2%(-5.76)#79 | 16.9%(-10.5)#3,274 |
| 80. | Eastmont | 6.5% | 12.2%(-5.70)#80 | 16.9%(-10.4)#3,308 |
| 81. | Moxee | 6.7% | 12.2%(-5.48)#81 | 16.9%(-10.2)#3,439 |
| 82. | Stevenson | 6.7% | 12.2%(-5.46)#82 | 16.9%(-10.2)#3,444 |
| 83. | Concrete | 7.0% | 12.2%(-5.15)#83 | 16.9%(-9.86)#3,630 |
| 84. | Meadowdale | 7.3% | 12.2%(-4.89)#84 | 16.9%(-9.60)#3,787 |
| 85. | Salmon Creek | 7.4% | 12.2%(-4.75)#85 | 16.9%(-9.46)#3,866 |
| 86. | Morton | 7.5% | 12.2%(-4.71)#86 | 16.9%(-9.42)#3,884 |
| 87. | Port Angeles East | 7.5% | 12.2%(-4.68)#87 | 16.9%(-9.39)#3,901 |
| 88. | Lake Stevens | 7.6% | 12.2%(-4.62)#88 | 16.9%(-9.34)#3,923 |
| 89. | Orting | 7.6% | 12.2%(-4.60)#89 | 16.9%(-9.31)#3,942 |
| 90. | Maple Valley | 7.6% | 12.2%(-4.60)#90 | 16.9%(-9.31)#3,943 |
| 91. | Tekoa | 7.7% | 12.2%(-4.50)#91 | 16.9%(-9.21)#3,996 |
| 92. | Puyallup | 7.8% | 12.2%(-4.39)#92 | 16.9%(-9.10)#4,070 |
| 93. | Selah | 7.8% | 12.2%(-4.37)#93 | 16.9%(-9.08)#4,077 |
| 94. | Colfax | 7.9% | 12.2%(-4.33)#94 | 16.9%(-9.04)#4,099 |
| 95. | Silverdale | 7.9% | 12.2%(-4.29)#95 | 16.9%(-9.00)#4,123 |
| 96. | Canyon Creek | 7.9% | 12.2%(-4.27)#96 | 16.9%(-8.98)#4,133 |
| 97. | Mountlake Terrace | 7.9% | 12.2%(-4.26)#97 | 16.9%(-8.97)#4,139 |
| 98. | Bellevue | 8.0% | 12.2%(-4.21)#98 | 16.9%(-8.92)#4,168 |
| 99. | Bryant | 8.0% | 12.2%(-4.16)#99 | 16.9%(-8.87)#4,202 |
| 100. | Monroe | 8.1% | 12.2%(-4.06)#100 | 16.9%(-8.77)#4,251 |
Common Questions
What are the Top 10 Cities with the Lowest Child Poverty Level Among Boys Under the Age of 16 in Washington?
Top 10 Cities with the Lowest Child Poverty Level Among Boys Under the Age of 16 in Washington are:
#1
0.090%
#2
0.61%
#3
0.66%
#4
0.73%
#5
0.76%
#6
1.0%
#7
1.1%
#8
1.1%
#9
1.2%
#10
1.3%
What city has the Lowest Child Poverty Level Among Boys Under the Age of 16 in Washington?
Edgewood has the Lowest Child Poverty Level Among Boys Under the Age of 16 in Washington with 0.090%.
What is the Poverty Level Among Boys Under the Age of 16 in the State of Washington?
Poverty Level Among Boys Under the Age of 16 in Washington is 12.2%.
What is the Poverty Level Among Boys Under the Age of 16 in the United States?
Poverty Level Among Boys Under the Age of 16 in the United States is 16.9%.