Cities with the Highest Percentage of Hispanic or Latino Population in Washington
RELATED REPORTS & OPTIONS
Hispanic or Latino
Washington
Compare Cities
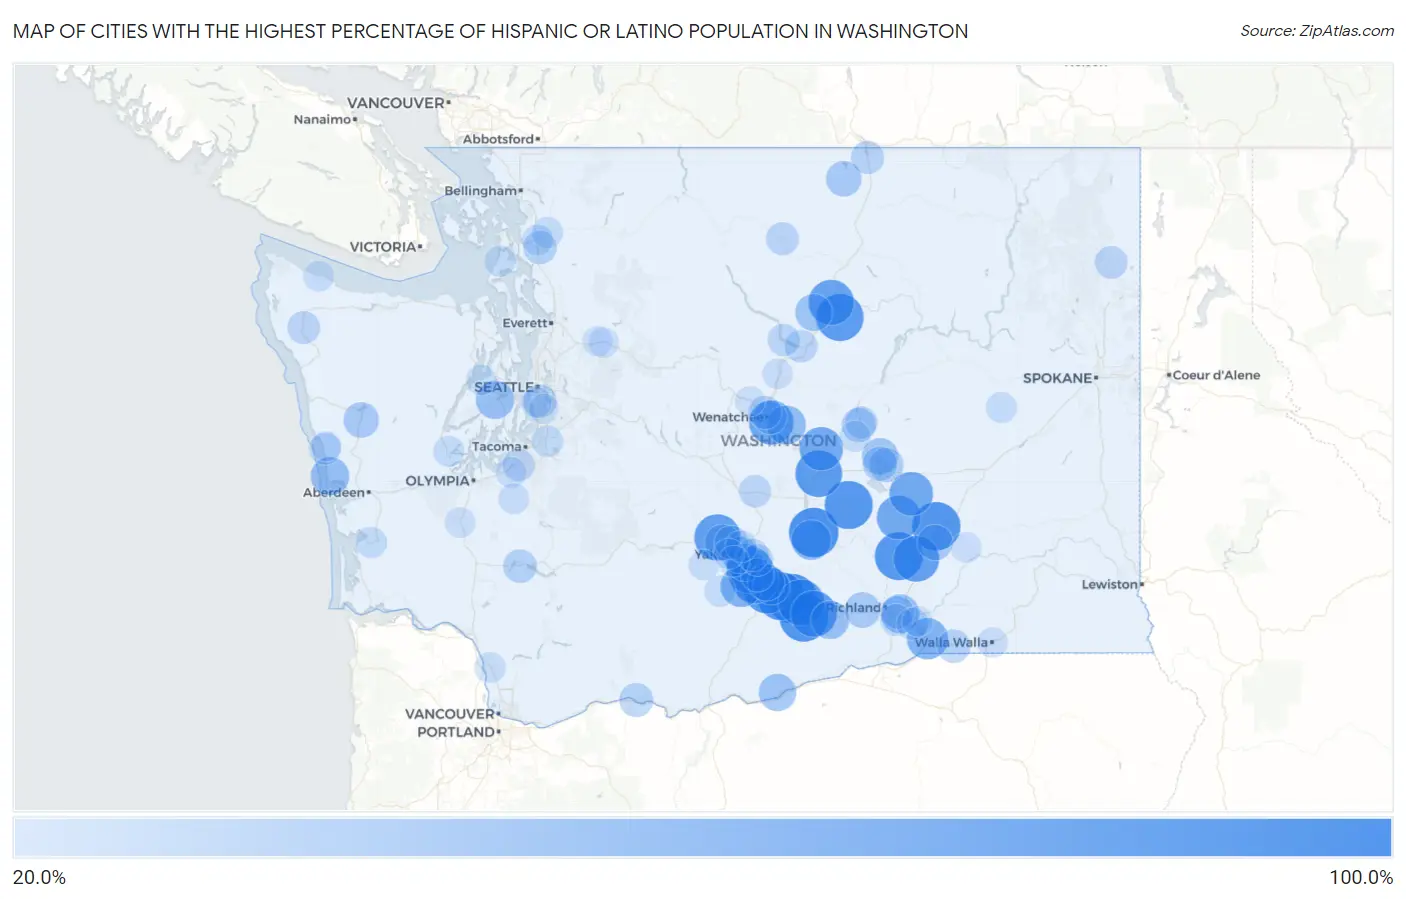
Map of Cities with the Highest Percentage of Hispanic or Latino Population in Washington
0.0%
100.0%
Cities with the Highest Percentage of Hispanic or Latino Population in Washington
| City | Hispanic or Latino | vs State | vs National | |
| 1. | Mattawa | 100.0% | 13.5%(+86.5)#1 | 18.7%(+81.3)#15 |
| 2. | Outlook | 100.0% | 13.5%(+86.5)#2 | 18.7%(+81.3)#210 |
| 3. | Beverly | 100.0% | 13.5%(+86.5)#3 | 18.7%(+81.3)#220 |
| 4. | Mabton | 95.5% | 13.5%(+82.1)#4 | 18.7%(+76.9)#626 |
| 5. | Hatton | 95.3% | 13.5%(+81.8)#5 | 18.7%(+76.7)#635 |
| 6. | Royal City | 93.9% | 13.5%(+80.4)#6 | 18.7%(+75.2)#687 |
| 7. | Granger | 93.6% | 13.5%(+80.1)#7 | 18.7%(+75.0)#693 |
| 8. | Basin City | 93.0% | 13.5%(+79.5)#8 | 18.7%(+74.3)#708 |
| 9. | Bridgeport | 90.6% | 13.5%(+77.1)#9 | 18.7%(+71.9)#761 |
| 10. | Toppenish | 90.5% | 13.5%(+77.0)#10 | 18.7%(+71.9)#762 |
| 11. | George | 89.0% | 13.5%(+75.5)#11 | 18.7%(+70.4)#804 |
| 12. | Wapato | 88.9% | 13.5%(+75.4)#12 | 18.7%(+70.2)#808 |
| 13. | Parker | 88.9% | 13.5%(+75.4)#13 | 18.7%(+70.2)#809 |
| 14. | Tieton | 86.9% | 13.5%(+73.4)#14 | 18.7%(+68.3)#851 |
| 15. | Sunnyside | 86.1% | 13.5%(+72.6)#15 | 18.7%(+67.4)#868 |
| 16. | Grandview | 85.7% | 13.5%(+72.2)#16 | 18.7%(+67.1)#878 |
| 17. | Mesa | 85.4% | 13.5%(+71.9)#17 | 18.7%(+66.7)#886 |
| 18. | Brewster | 83.0% | 13.5%(+69.5)#18 | 18.7%(+64.3)#940 |
| 19. | South Wenatchee | 79.6% | 13.5%(+66.1)#19 | 18.7%(+60.9)#1,019 |
| 20. | Othello | 76.9% | 13.5%(+63.4)#20 | 18.7%(+58.3)#1,086 |
| 21. | Warden | 76.1% | 13.5%(+62.6)#21 | 18.7%(+57.5)#1,097 |
| 22. | Quincy | 75.4% | 13.5%(+61.9)#22 | 18.7%(+56.8)#1,116 |
| 23. | Schwana | 67.8% | 13.5%(+54.3)#23 | 18.7%(+49.2)#1,315 |
| 24. | Harrah | 66.7% | 13.5%(+53.2)#24 | 18.7%(+48.1)#1,348 |
| 25. | Wallula | 65.9% | 13.5%(+52.4)#25 | 18.7%(+47.3)#1,375 |
| 26. | Desert Aire | 59.9% | 13.5%(+46.5)#26 | 18.7%(+41.3)#1,562 |
| 27. | Rock Island | 57.4% | 13.5%(+43.9)#27 | 18.7%(+38.8)#1,644 |
| 28. | Pasco | 55.6% | 13.5%(+42.1)#28 | 18.7%(+36.9)#1,699 |
| 29. | Ocean City | 55.1% | 13.5%(+41.7)#29 | 18.7%(+36.5)#1,723 |
| 30. | Gorst | 53.7% | 13.5%(+40.2)#30 | 18.7%(+35.1)#1,796 |
| 31. | Wheeler | 53.4% | 13.5%(+39.9)#31 | 18.7%(+34.7)#1,814 |
| 32. | Prosser | 53.3% | 13.5%(+39.8)#32 | 18.7%(+34.6)#1,822 |
| 33. | Union Gap | 50.5% | 13.5%(+37.0)#33 | 18.7%(+31.9)#1,923 |
| 34. | Roosevelt | 50.5% | 13.5%(+37.0)#34 | 18.7%(+31.9)#1,925 |
| 35. | Pateros | 49.1% | 13.5%(+35.6)#35 | 18.7%(+30.4)#1,999 |
| 36. | Zillah | 48.0% | 13.5%(+34.6)#36 | 18.7%(+29.4)#2,065 |
| 37. | Yakima | 47.1% | 13.5%(+33.6)#37 | 18.7%(+28.5)#2,106 |
| 38. | Buena | 47.0% | 13.5%(+33.5)#38 | 18.7%(+28.3)#2,113 |
| 39. | Moses Lake North | 46.3% | 13.5%(+32.9)#39 | 18.7%(+27.7)#2,139 |
| 40. | Cowiche | 44.5% | 13.5%(+31.0)#40 | 18.7%(+25.8)#2,240 |
| 41. | Neilton | 43.2% | 13.5%(+29.7)#41 | 18.7%(+24.5)#2,313 |
| 42. | Benton City | 43.0% | 13.5%(+29.5)#42 | 18.7%(+24.3)#2,331 |
| 43. | Loomis | 42.9% | 13.5%(+29.4)#43 | 18.7%(+24.2)#2,336 |
| 44. | Connell | 42.8% | 13.5%(+29.3)#44 | 18.7%(+24.2)#2,339 |
| 45. | Moses Lake | 39.2% | 13.5%(+25.7)#45 | 18.7%(+20.5)#2,562 |
| 46. | Cascade Valley | 38.4% | 13.5%(+24.9)#46 | 18.7%(+19.8)#2,617 |
| 47. | Lakeview | 37.5% | 13.5%(+24.0)#47 | 18.7%(+18.8)#2,687 |
| 48. | Bingen | 36.9% | 13.5%(+23.4)#48 | 18.7%(+18.2)#2,719 |
| 49. | Mossyrock | 36.3% | 13.5%(+22.8)#49 | 18.7%(+17.7)#2,775 |
| 50. | Mount Vernon | 35.1% | 13.5%(+21.6)#50 | 18.7%(+16.5)#2,880 |
| 51. | Eschbach | 34.9% | 13.5%(+21.4)#51 | 18.7%(+16.3)#2,892 |
| 52. | Touchet | 34.8% | 13.5%(+21.4)#52 | 18.7%(+16.2)#2,895 |
| 53. | Boulevard Park | 34.8% | 13.5%(+21.3)#53 | 18.7%(+16.2)#2,899 |
| 54. | East Wenatchee | 34.6% | 13.5%(+21.1)#54 | 18.7%(+15.9)#2,927 |
| 55. | Donald | 34.1% | 13.5%(+20.6)#55 | 18.7%(+15.5)#2,970 |
| 56. | Oroville | 33.8% | 13.5%(+20.3)#56 | 18.7%(+15.1)#3,000 |
| 57. | Wenatchee | 33.7% | 13.5%(+20.2)#57 | 18.7%(+15.0)#3,009 |
| 58. | Winthrop | 33.1% | 13.5%(+19.6)#58 | 18.7%(+14.4)#3,067 |
| 59. | Cusick | 33.0% | 13.5%(+19.5)#59 | 18.7%(+14.3)#3,075 |
| 60. | West Pasco | 32.6% | 13.5%(+19.1)#60 | 18.7%(+14.0)#3,101 |
| 61. | Forks | 32.0% | 13.5%(+18.5)#61 | 18.7%(+13.4)#3,167 |
| 62. | Chelan | 31.7% | 13.5%(+18.2)#62 | 18.7%(+13.0)#3,203 |
| 63. | Terrace Heights | 31.5% | 13.5%(+18.0)#63 | 18.7%(+12.9)#3,226 |
| 64. | Soap Lake | 31.1% | 13.5%(+17.6)#64 | 18.7%(+12.5)#3,272 |
| 65. | Kittitas | 30.8% | 13.5%(+17.3)#65 | 18.7%(+12.2)#3,299 |
| 66. | Manson | 30.8% | 13.5%(+17.3)#66 | 18.7%(+12.2)#3,300 |
| 67. | Mcchord Afb | 30.0% | 13.5%(+16.5)#67 | 18.7%(+11.3)#3,397 |
| 68. | Moclips | 29.5% | 13.5%(+16.0)#68 | 18.7%(+10.8)#3,453 |
| 69. | Kennewick | 29.3% | 13.5%(+15.8)#69 | 18.7%(+10.7)#3,469 |
| 70. | Finley | 29.3% | 13.5%(+15.8)#70 | 18.7%(+10.6)#3,475 |
| 71. | Moxee | 28.5% | 13.5%(+15.1)#71 | 18.7%(+9.89)#3,557 |
| 72. | Selah | 27.6% | 13.5%(+14.1)#72 | 18.7%(+8.90)#3,686 |
| 73. | Algona | 27.5% | 13.5%(+14.0)#73 | 18.7%(+8.86)#3,692 |
| 74. | South Bend | 26.7% | 13.5%(+13.2)#74 | 18.7%(+8.08)#3,803 |
| 75. | White Swan | 26.4% | 13.5%(+12.9)#75 | 18.7%(+7.73)#3,842 |
| 76. | Whidbey Island Station | 26.0% | 13.5%(+12.5)#76 | 18.7%(+7.38)#3,886 |
| 77. | Sedro Woolley | 25.9% | 13.5%(+12.4)#77 | 18.7%(+7.28)#3,898 |
| 78. | Burlington | 25.9% | 13.5%(+12.4)#78 | 18.7%(+7.22)#3,905 |
| 79. | Harrington | 25.8% | 13.5%(+12.3)#79 | 18.7%(+7.13)#3,915 |
| 80. | Shelton | 25.6% | 13.5%(+12.1)#80 | 18.7%(+6.92)#3,946 |
| 81. | Ephrata | 25.3% | 13.5%(+11.8)#81 | 18.7%(+6.64)#3,978 |
| 82. | Woodland | 25.0% | 13.5%(+11.5)#82 | 18.7%(+6.31)#4,025 |
| 83. | Ahtanum | 24.7% | 13.5%(+11.2)#83 | 18.7%(+6.01)#4,068 |
| 84. | Clallam Bay | 24.5% | 13.5%(+11.0)#84 | 18.7%(+5.87)#4,091 |
| 85. | Fort Lewis | 24.5% | 13.5%(+11.0)#85 | 18.7%(+5.83)#4,101 |
| 86. | Tampico | 24.4% | 13.5%(+10.9)#86 | 18.7%(+5.74)#4,116 |
| 87. | Mckenna | 24.2% | 13.5%(+10.7)#87 | 18.7%(+5.54)#4,143 |
| 88. | Seabeck | 24.2% | 13.5%(+10.7)#88 | 18.7%(+5.51)#4,146 |
| 89. | Kahlotus | 23.9% | 13.5%(+10.4)#89 | 18.7%(+5.23)#4,209 |
| 90. | Walla Walla | 23.6% | 13.5%(+10.1)#90 | 18.7%(+4.97)#4,248 |
| 91. | Grand Mound | 23.6% | 13.5%(+10.1)#91 | 18.7%(+4.94)#4,256 |
| 92. | Burbank | 23.3% | 13.5%(+9.83)#92 | 18.7%(+4.67)#4,310 |
| 93. | Entiat | 23.3% | 13.5%(+9.82)#93 | 18.7%(+4.66)#4,311 |
| 94. | White Center | 23.3% | 13.5%(+9.79)#94 | 18.7%(+4.63)#4,316 |
| 95. | Startup | 22.9% | 13.5%(+9.40)#95 | 18.7%(+4.24)#4,379 |
| 96. | Sultan | 22.8% | 13.5%(+9.34)#96 | 18.7%(+4.18)#4,395 |
| 97. | Summitview | 22.8% | 13.5%(+9.29)#97 | 18.7%(+4.13)#4,401 |
| 98. | Qui Nai Elt Village | 22.4% | 13.5%(+8.96)#98 | 18.7%(+3.80)#4,457 |
| 99. | Tukwila | 22.2% | 13.5%(+8.73)#99 | 18.7%(+3.57)#4,504 |
| 100. | Cashmere | 22.2% | 13.5%(+8.71)#100 | 18.7%(+3.54)#4,507 |
Common Questions
What are the Top 10 Cities with the Highest Percentage of Hispanic or Latino Population in Washington?
Top 10 Cities with the Highest Percentage of Hispanic or Latino Population in Washington are:
#1
100.0%
#2
100.0%
#3
95.5%
#4
95.3%
#5
93.9%
#6
93.6%
#7
93.0%
#8
90.6%
#9
90.5%
#10
89.0%
What city has the Highest Percentage of Hispanic or Latino Population in Washington?
Mattawa has the Highest Percentage of Hispanic or Latino Population in Washington with 100.0%.
What is the Percentage of Hispanic or Latino Population in the State of Washington?
Percentage of Hispanic or Latino Population in Washington is 13.5%.
What is the Percentage of Hispanic or Latino Population in the United States?
Percentage of Hispanic or Latino Population in the United States is 18.7%.