Cities with the Highest Percentage of Trinidadian and Tobagonian Population in Washington
RELATED REPORTS & OPTIONS
Trinidadian and Tobagonian
Washington
Compare Cities
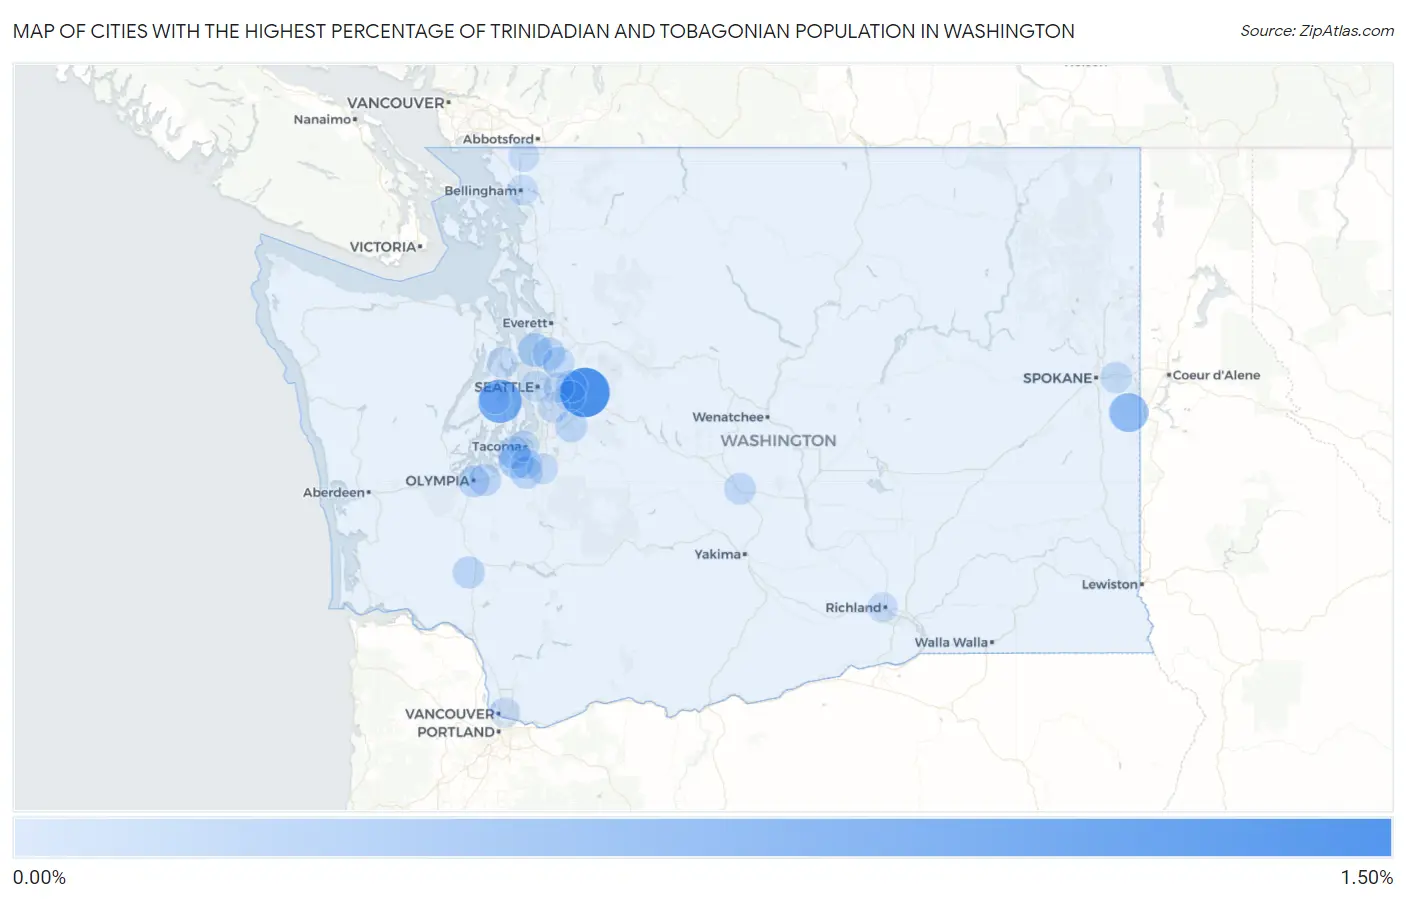
Map of Cities with the Highest Percentage of Trinidadian and Tobagonian Population in Washington
0.00%
1.50%
Cities with the Highest Percentage of Trinidadian and Tobagonian Population in Washington
| City | Trinidadian and Tobagonian | vs State | vs National | |
| 1. | Fall City | 1.04% | 0.021%(+1.02)#1 | 0.071%(+0.970)#122 |
| 2. | Port Orchard | 0.71% | 0.021%(+0.687)#2 | 0.071%(+0.637)#192 |
| 3. | Rockford | 0.47% | 0.021%(+0.444)#3 | 0.071%(+0.394)#308 |
| 4. | Lakewood | 0.23% | 0.021%(+0.210)#4 | 0.071%(+0.161)#563 |
| 5. | Edmonds | 0.20% | 0.021%(+0.178)#5 | 0.071%(+0.128)#625 |
| 6. | University Place | 0.14% | 0.021%(+0.123)#6 | 0.071%(+0.073)#768 |
| 7. | Bothell West | 0.13% | 0.021%(+0.110)#7 | 0.071%(+0.061)#814 |
| 8. | Spanaway | 0.13% | 0.021%(+0.108)#8 | 0.071%(+0.059)#823 |
| 9. | Lacey | 0.11% | 0.021%(+0.093)#9 | 0.071%(+0.043)#877 |
| 10. | Maple Valley | 0.11% | 0.021%(+0.086)#10 | 0.071%(+0.037)#907 |
| 11. | Winlock | 0.10% | 0.021%(+0.081)#11 | 0.071%(+0.031)#926 |
| 12. | Olympia | 0.10% | 0.021%(+0.080)#12 | 0.071%(+0.031)#930 |
| 13. | Sammamish | 0.10% | 0.021%(+0.080)#13 | 0.071%(+0.030)#935 |
| 14. | Ellensburg | 0.095% | 0.021%(+0.074)#14 | 0.071%(+0.024)#973 |
| 15. | Spokane Valley | 0.078% | 0.021%(+0.057)#15 | 0.071%(+0.007)#1,053 |
| 16. | Woodinville | 0.075% | 0.021%(+0.054)#16 | 0.071%(+0.005)#1,067 |
| 17. | Tacoma | 0.067% | 0.021%(+0.045)#17 | 0.071%(-0.004)#1,111 |
| 18. | Seattle | 0.059% | 0.021%(+0.037)#18 | 0.071%(-0.012)#1,157 |
| 19. | Renton | 0.047% | 0.021%(+0.026)#19 | 0.071%(-0.023)#1,236 |
| 20. | Parkland | 0.046% | 0.021%(+0.025)#20 | 0.071%(-0.025)#1,254 |
| 21. | Issaquah | 0.046% | 0.021%(+0.025)#21 | 0.071%(-0.025)#1,255 |
| 22. | Lynden | 0.045% | 0.021%(+0.023)#22 | 0.071%(-0.026)#1,261 |
| 23. | Bremerton | 0.043% | 0.021%(+0.022)#23 | 0.071%(-0.027)#1,273 |
| 24. | Poulsbo | 0.042% | 0.021%(+0.021)#24 | 0.071%(-0.028)#1,277 |
| 25. | South Hill | 0.040% | 0.021%(+0.019)#25 | 0.071%(-0.031)#1,299 |
| 26. | Richland | 0.028% | 0.021%(+0.007)#26 | 0.071%(-0.043)#1,404 |
| 27. | Bellingham | 0.026% | 0.021%(+0.005)#27 | 0.071%(-0.044)#1,415 |
| 28. | Vancouver | 0.014% | 0.021%(-0.007)#28 | 0.071%(-0.057)#1,553 |
| 29. | Bellevue | 0.0046% | 0.021%(-0.016)#29 | 0.071%(-0.066)#1,642 |
Common Questions
What are the Top 10 Cities with the Highest Percentage of Trinidadian and Tobagonian Population in Washington?
Top 10 Cities with the Highest Percentage of Trinidadian and Tobagonian Population in Washington are:
#1
1.04%
#2
0.71%
#3
0.47%
#4
0.23%
#5
0.20%
#6
0.14%
#7
0.13%
#8
0.13%
#9
0.11%
#10
0.11%
What city has the Highest Percentage of Trinidadian and Tobagonian Population in Washington?
Fall City has the Highest Percentage of Trinidadian and Tobagonian Population in Washington with 1.04%.
What is the Percentage of Trinidadian and Tobagonian Population in the State of Washington?
Percentage of Trinidadian and Tobagonian Population in Washington is 0.021%.
What is the Percentage of Trinidadian and Tobagonian Population in the United States?
Percentage of Trinidadian and Tobagonian Population in the United States is 0.071%.