Cities with the Highest Percentage of Immigrants from Northern Africa in Washington
RELATED REPORTS & OPTIONS
Northern Africa
Washington
Compare Cities
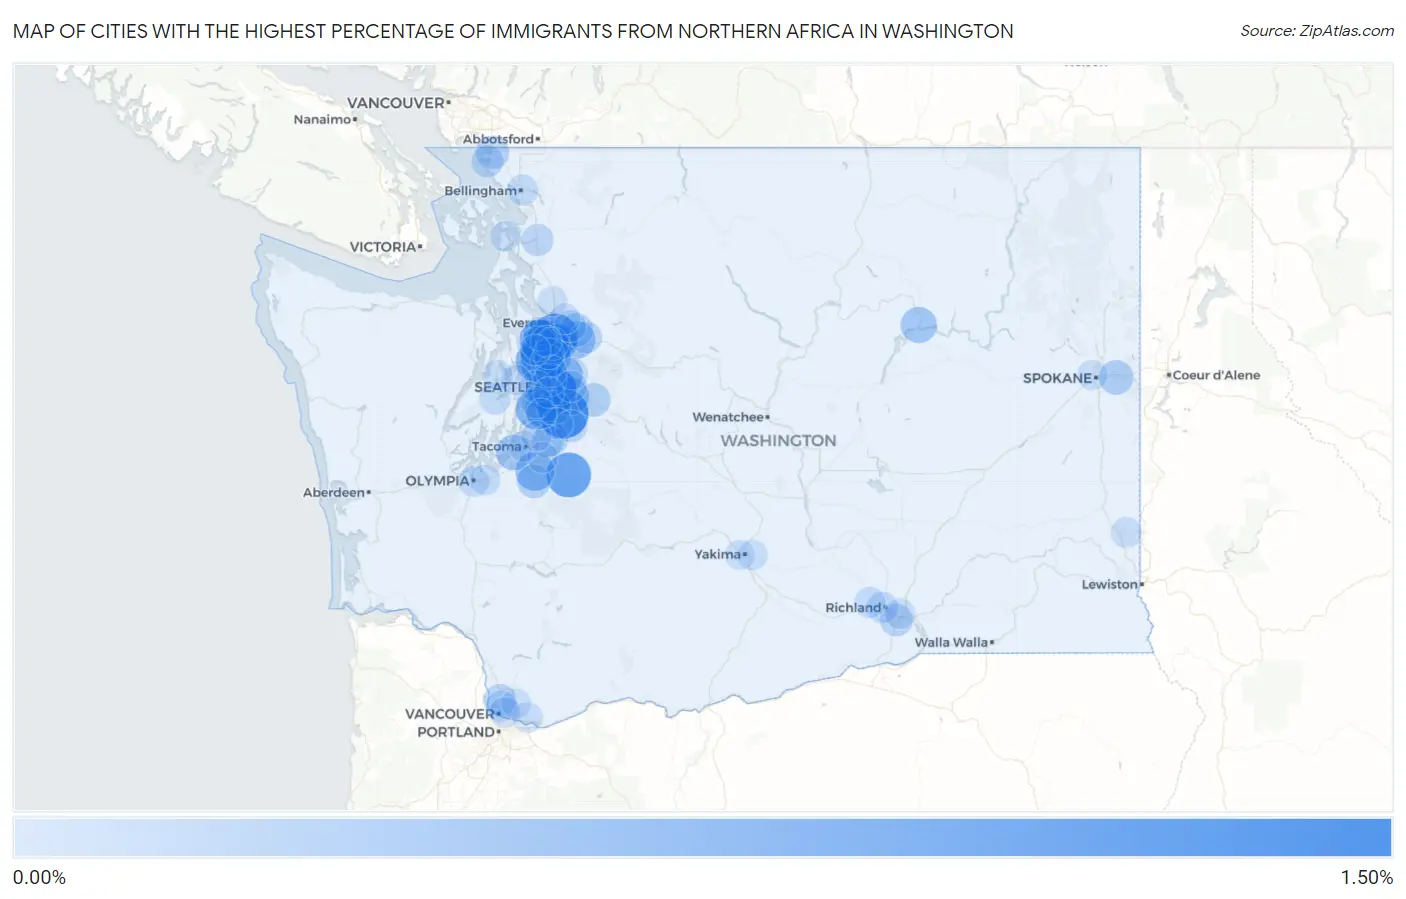
Map of Cities with the Highest Percentage of Immigrants from Northern Africa in Washington
0.00%
1.50%
Cities with the Highest Percentage of Immigrants from Northern Africa in Washington
| City | Northern Africa | vs State | vs National | |
| 1. | Maple Heights Lake Desire | 1.22% | 0.093%(+1.13)#-1 | 0.13%(+1.09)#0 |
| 2. | Beaux Arts Village | 1.16% | 0.093%(+1.07)#0 | 0.13%(+1.04)#1 |
| 3. | Martha Lake | 1.11% | 0.093%(+1.02)#13 | 0.13%(+0.982)#848 |
| 4. | Eastmont | 0.97% | 0.093%(+0.878)#14 | 0.13%(+0.844)#849 |
| 5. | Lake Forest Park | 0.91% | 0.093%(+0.821)#15 | 0.13%(+0.786)#850 |
| 6. | Carbonado | 0.91% | 0.093%(+0.816)#16 | 0.13%(+0.782)#851 |
| 7. | Shoreline | 0.70% | 0.093%(+0.602)#17 | 0.13%(+0.568)#852 |
| 8. | Picnic Point | 0.68% | 0.093%(+0.590)#18 | 0.13%(+0.556)#853 |
| 9. | Burien | 0.68% | 0.093%(+0.587)#30 | 0.13%(+0.552)#1,301 |
| 10. | Mountlake Terrace | 0.59% | 0.093%(+0.492)#31 | 0.13%(+0.458)#1,302 |
| 11. | Frederickson | 0.55% | 0.093%(+0.461)#32 | 0.13%(+0.426)#1,303 |
| 12. | Issaquah | 0.50% | 0.093%(+0.404)#33 | 0.13%(+0.370)#1,304 |
| 13. | Redmond | 0.49% | 0.093%(+0.399)#34 | 0.13%(+0.365)#1,305 |
| 14. | Monroe North | 0.48% | 0.093%(+0.386)#35 | 0.13%(+0.351)#1,306 |
| 15. | Tukwila | 0.48% | 0.093%(+0.385)#36 | 0.13%(+0.350)#1,307 |
| 16. | Silver Firs | 0.46% | 0.093%(+0.366)#37 | 0.13%(+0.331)#1,308 |
| 17. | Bothell | 0.43% | 0.093%(+0.339)#38 | 0.13%(+0.305)#1,309 |
| 18. | Coulee Dam | 0.37% | 0.093%(+0.282)#39 | 0.13%(+0.247)#1,310 |
| 19. | University Place | 0.34% | 0.093%(+0.247)#40 | 0.13%(+0.213)#1,311 |
| 20. | Bellevue | 0.33% | 0.093%(+0.240)#41 | 0.13%(+0.206)#1,312 |
| 21. | Mill Creek East | 0.30% | 0.093%(+0.211)#42 | 0.13%(+0.177)#1,313 |
| 22. | Meadowdale | 0.30% | 0.093%(+0.208)#43 | 0.13%(+0.173)#1,314 |
| 23. | Spokane Valley | 0.27% | 0.093%(+0.180)#44 | 0.13%(+0.145)#1,315 |
| 24. | Auburn | 0.23% | 0.093%(+0.142)#45 | 0.13%(+0.107)#1,316 |
| 25. | Snoqualmie | 0.23% | 0.093%(+0.132)#46 | 0.13%(+0.098)#1,317 |
| 26. | Elk Plain | 0.22% | 0.093%(+0.132)#47 | 0.13%(+0.098)#1,318 |
| 27. | Three Lakes | 0.22% | 0.093%(+0.131)#48 | 0.13%(+0.097)#1,319 |
| 28. | Kenmore | 0.22% | 0.093%(+0.127)#49 | 0.13%(+0.093)#1,320 |
| 29. | Renton | 0.21% | 0.093%(+0.119)#50 | 0.13%(+0.084)#1,321 |
| 30. | Blaine | 0.20% | 0.093%(+0.112)#51 | 0.13%(+0.077)#1,322 |
| 31. | Mukilteo | 0.20% | 0.093%(+0.104)#52 | 0.13%(+0.069)#1,323 |
| 32. | Kennewick | 0.16% | 0.093%(+0.063)#53 | 0.13%(+0.029)#1,324 |
| 33. | Yarrow Point | 0.16% | 0.093%(+0.063)#54 | 0.13%(+0.029)#1,325 |
| 34. | Algona | 0.15% | 0.093%(+0.060)#55 | 0.13%(+0.026)#1,326 |
| 35. | Salmon Creek | 0.14% | 0.093%(+0.050)#56 | 0.13%(+0.015)#1,327 |
| 36. | Mill Creek | 0.13% | 0.093%(+0.042)#57 | 0.13%(+0.007)#1,328 |
| 37. | Seattle | 0.13% | 0.093%(+0.035)#58 | 0.13%(+0.001)#1,329 |
| 38. | Burlington | 0.13% | 0.093%(+0.035)#59 | 0.13%(+0.001)#1,330 |
| 39. | Maple Valley | 0.13% | 0.093%(+0.033)#60 | 0.13%(-0.002)#1,331 |
| 40. | Birch Bay | 0.12% | 0.093%(+0.024)#61 | 0.13%(-0.011)#1,332 |
| 41. | Woods Creek | 0.11% | 0.093%(+0.021)#62 | 0.13%(-0.014)#1,333 |
| 42. | Everett | 0.099% | 0.093%(+0.006)#63 | 0.13%(-0.028)#1,334 |
| 43. | Union Hill Novelty Hill | 0.095% | 0.093%(+0.002)#64 | 0.13%(-0.032)#1,335 |
| 44. | Bremerton | 0.091% | 0.093%(-0.002)#65 | 0.13%(-0.036)#1,336 |
| 45. | White Center | 0.090% | 0.093%(-0.003)#66 | 0.13%(-0.037)#1,337 |
| 46. | Fairwood Cdp King County | 0.086% | 0.093%(-0.007)#67 | 0.13%(-0.041)#1,338 |
| 47. | Richland | 0.076% | 0.093%(-0.017)#68 | 0.13%(-0.052)#1,339 |
| 48. | Kirkland | 0.075% | 0.093%(-0.018)#69 | 0.13%(-0.052)#1,340 |
| 49. | Hazel Dell | 0.075% | 0.093%(-0.018)#70 | 0.13%(-0.053)#1,341 |
| 50. | Sammamish | 0.066% | 0.093%(-0.027)#71 | 0.13%(-0.061)#1,342 |
| 51. | Kent | 0.062% | 0.093%(-0.031)#72 | 0.13%(-0.065)#1,343 |
| 52. | West Richland | 0.060% | 0.093%(-0.033)#73 | 0.13%(-0.067)#1,344 |
| 53. | Bellingham | 0.060% | 0.093%(-0.033)#74 | 0.13%(-0.067)#1,362 |
| 54. | Olympia | 0.054% | 0.093%(-0.039)#75 | 0.13%(-0.073)#1,363 |
| 55. | Pullman | 0.047% | 0.093%(-0.046)#76 | 0.13%(-0.080)#1,364 |
| 56. | Bothell West | 0.044% | 0.093%(-0.049)#77 | 0.13%(-0.084)#1,365 |
| 57. | Puyallup | 0.042% | 0.093%(-0.051)#78 | 0.13%(-0.085)#1,366 |
| 58. | Lake Stevens | 0.041% | 0.093%(-0.052)#79 | 0.13%(-0.086)#1,367 |
| 59. | Lake Stickney | 0.041% | 0.093%(-0.052)#80 | 0.13%(-0.086)#1,368 |
| 60. | Edmonds | 0.040% | 0.093%(-0.053)#81 | 0.13%(-0.088)#1,369 |
| 61. | Vancouver | 0.039% | 0.093%(-0.054)#82 | 0.13%(-0.088)#1,370 |
| 62. | Camas | 0.038% | 0.093%(-0.055)#83 | 0.13%(-0.090)#1,371 |
| 63. | Bainbridge Island | 0.036% | 0.093%(-0.057)#84 | 0.13%(-0.091)#1,372 |
| 64. | Lacey | 0.034% | 0.093%(-0.059)#85 | 0.13%(-0.094)#1,373 |
| 65. | Mercer Island | 0.031% | 0.093%(-0.062)#86 | 0.13%(-0.096)#1,374 |
| 66. | Pasco | 0.030% | 0.093%(-0.063)#87 | 0.13%(-0.098)#1,375 |
| 67. | Silverdale | 0.028% | 0.093%(-0.065)#88 | 0.13%(-0.100)#1,376 |
| 68. | Tacoma | 0.027% | 0.093%(-0.066)#89 | 0.13%(-0.100)#1,377 |
| 69. | Federal Way | 0.023% | 0.093%(-0.070)#90 | 0.13%(-0.104)#1,378 |
| 70. | Seatac | 0.019% | 0.093%(-0.074)#91 | 0.13%(-0.108)#1,379 |
| 71. | Spokane | 0.013% | 0.093%(-0.080)#92 | 0.13%(-0.115)#1,380 |
| 72. | Anacortes | 0.011% | 0.093%(-0.082)#93 | 0.13%(-0.116)#1,381 |
| 73. | Terrace Heights | 0.010% | 0.093%(-0.083)#94 | 0.13%(-0.117)#1,382 |
| 74. | Marysville | 0.0085% | 0.093%(-0.085)#95 | 0.13%(-0.119)#1,383 |
| 75. | Yakima | 0.0072% | 0.093%(-0.086)#96 | 0.13%(-0.120)#1,384 |
| 76. | Orchards | 0.0068% | 0.093%(-0.086)#97 | 0.13%(-0.121)#1,385 |
Common Questions
What are the Top 10 Cities with the Highest Percentage of Immigrants from Northern Africa in Washington?
Top 10 Cities with the Highest Percentage of Immigrants from Northern Africa in Washington are:
#1
1.22%
#2
1.16%
#3
1.11%
#4
0.97%
#5
0.91%
#6
0.91%
#7
0.70%
#8
0.68%
#9
0.68%
#10
0.59%
What city has the Highest Percentage of Immigrants from Northern Africa in Washington?
Maple Heights Lake Desire has the Highest Percentage of Immigrants from Northern Africa in Washington with 1.22%.
What is the Percentage of Immigrants from Northern Africa in the State of Washington?
Percentage of Immigrants from Northern Africa in Washington is 0.093%.
What is the Percentage of Immigrants from Northern Africa in the United States?
Percentage of Immigrants from Northern Africa in the United States is 0.13%.