Cities with the Highest Percentage of Population Employed in Finance & Insurance in Washington
RELATED REPORTS & OPTIONS
Finance & Insurance
Washington
Compare Cities
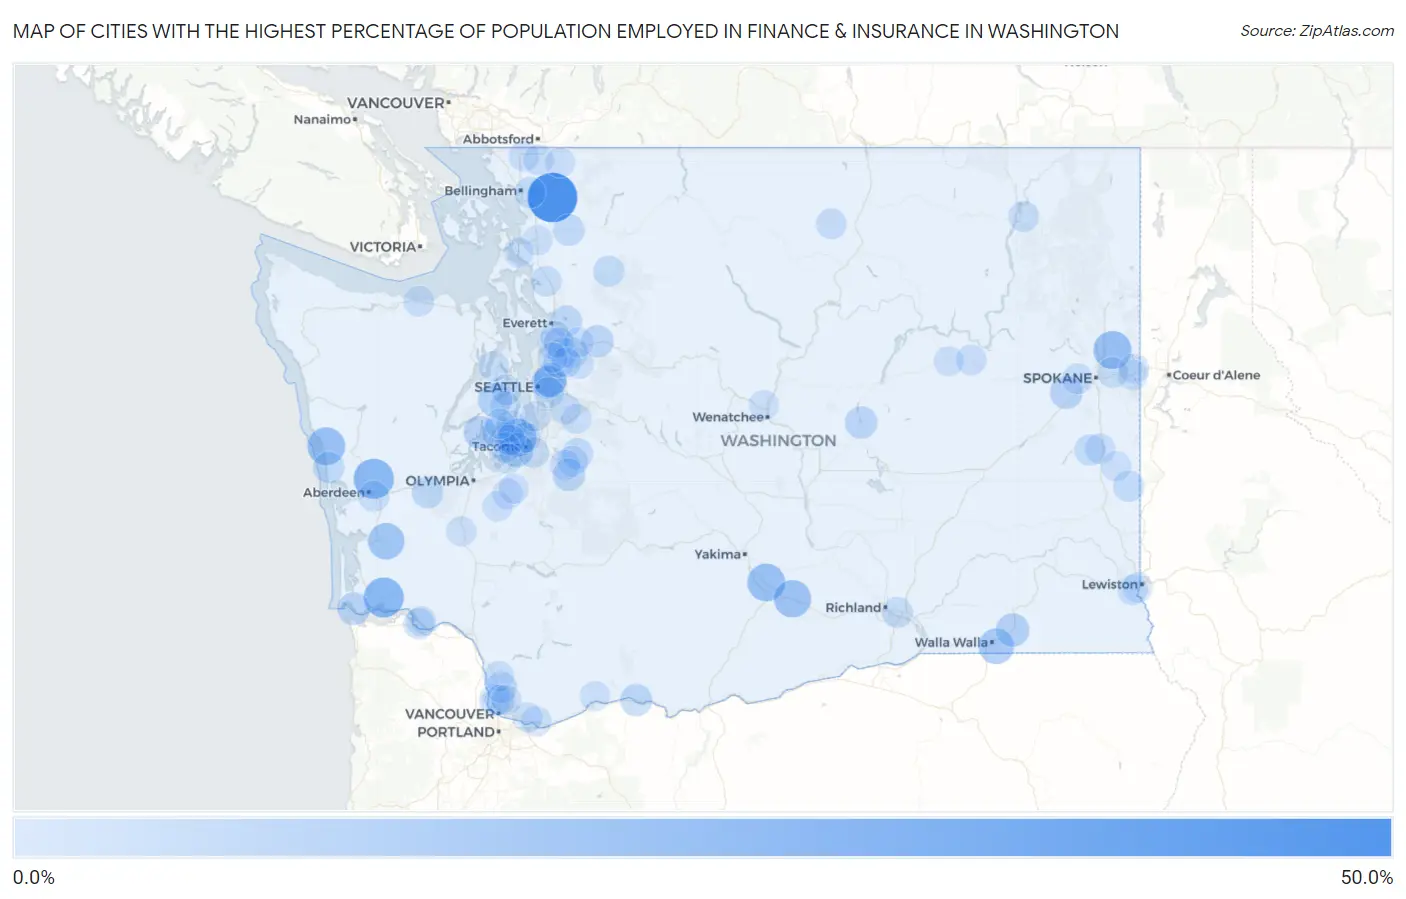
Map of Cities with the Highest Percentage of Population Employed in Finance & Insurance in Washington
0.0%
50.0%
Cities with the Highest Percentage of Population Employed in Finance & Insurance in Washington
| City | % Employed | vs State | vs National | |
| 1. | Acme | 47.8% | 3.2%(+44.6)#1 | 4.8%(+43.0)#50 |
| 2. | Crescent Bar | 29.3% | 3.2%(+26.1)#2 | 4.8%(+24.5)#166 |
| 3. | Aberdeen Gardens | 26.5% | 3.2%(+23.3)#3 | 4.8%(+21.7)#198 |
| 4. | Deep River | 26.3% | 3.2%(+23.1)#4 | 4.8%(+21.5)#200 |
| 5. | Green Bluff | 21.7% | 3.2%(+18.5)#5 | 4.8%(+16.9)#301 |
| 6. | Qui Nai Elt Village | 21.4% | 3.2%(+18.2)#6 | 4.8%(+16.7)#312 |
| 7. | Ruston | 21.4% | 3.2%(+18.2)#7 | 4.8%(+16.7)#314 |
| 8. | Buena | 21.3% | 3.2%(+18.1)#8 | 4.8%(+16.6)#315 |
| 9. | Outlook | 20.2% | 3.2%(+16.9)#9 | 4.8%(+15.4)#358 |
| 10. | Willapa | 18.3% | 3.2%(+15.1)#10 | 4.8%(+13.5)#448 |
| 11. | Walla Walla East | 16.3% | 3.2%(+13.1)#11 | 4.8%(+11.5)#564 |
| 12. | Fircrest | 13.3% | 3.2%(+10.1)#12 | 4.8%(+8.55)#942 |
| 13. | Gorst | 12.7% | 3.2%(+9.45)#13 | 4.8%(+7.90)#1,060 |
| 14. | Yarrow Point | 12.5% | 3.2%(+9.27)#14 | 4.8%(+7.71)#1,107 |
| 15. | Dixie | 11.9% | 3.2%(+8.73)#15 | 4.8%(+7.17)#1,252 |
| 16. | Raft Island | 10.7% | 3.2%(+7.46)#16 | 4.8%(+5.90)#1,645 |
| 17. | Chinook | 10.6% | 3.2%(+7.43)#17 | 4.8%(+5.87)#1,657 |
| 18. | Grapeview | 10.5% | 3.2%(+7.34)#18 | 4.8%(+5.78)#1,688 |
| 19. | Medical Lake | 10.4% | 3.2%(+7.20)#19 | 4.8%(+5.64)#1,734 |
| 20. | Medina | 9.6% | 3.2%(+6.34)#20 | 4.8%(+4.78)#2,147 |
| 21. | Soap Lake | 9.5% | 3.2%(+6.31)#21 | 4.8%(+4.76)#2,163 |
| 22. | Clyde Hill | 9.4% | 3.2%(+6.22)#22 | 4.8%(+4.66)#2,239 |
| 23. | Sultan | 9.4% | 3.2%(+6.20)#23 | 4.8%(+4.64)#2,249 |
| 24. | Bingen | 9.1% | 3.2%(+5.88)#24 | 4.8%(+4.32)#2,415 |
| 25. | Carbonado | 9.0% | 3.2%(+5.78)#25 | 4.8%(+4.23)#2,496 |
| 26. | Malone | 8.1% | 3.2%(+4.90)#26 | 4.8%(+3.34)#3,148 |
| 27. | Cavalero | 8.1% | 3.2%(+4.84)#27 | 4.8%(+3.29)#3,189 |
| 28. | Lyman | 8.0% | 3.2%(+4.81)#28 | 4.8%(+3.25)#3,215 |
| 29. | Copalis Beach | 8.0% | 3.2%(+4.75)#29 | 4.8%(+3.19)#3,279 |
| 30. | Felida | 7.4% | 3.2%(+4.22)#30 | 4.8%(+2.66)#3,804 |
| 31. | Duluth | 7.4% | 3.2%(+4.17)#31 | 4.8%(+2.61)#3,864 |
| 32. | Enumclaw | 7.2% | 3.2%(+4.00)#32 | 4.8%(+2.44)#4,050 |
| 33. | Malden | 7.1% | 3.2%(+3.93)#33 | 4.8%(+2.38)#4,138 |
| 34. | Maplewood | 7.1% | 3.2%(+3.91)#34 | 4.8%(+2.35)#4,177 |
| 35. | Puget Island | 7.0% | 3.2%(+3.81)#35 | 4.8%(+2.25)#4,298 |
| 36. | Geneva | 6.9% | 3.2%(+3.71)#36 | 4.8%(+2.15)#4,435 |
| 37. | Garfield | 6.9% | 3.2%(+3.70)#37 | 4.8%(+2.14)#4,442 |
| 38. | Tehaleh | 6.9% | 3.2%(+3.65)#38 | 4.8%(+2.09)#4,516 |
| 39. | High Bridge | 6.8% | 3.2%(+3.60)#39 | 4.8%(+2.05)#4,583 |
| 40. | Swede Heaven | 6.7% | 3.2%(+3.54)#40 | 4.8%(+1.98)#4,670 |
| 41. | Lexington | 6.6% | 3.2%(+3.41)#41 | 4.8%(+1.86)#4,837 |
| 42. | West Pasco | 6.6% | 3.2%(+3.35)#42 | 4.8%(+1.79)#4,926 |
| 43. | East Renton Highlands | 6.4% | 3.2%(+3.23)#43 | 4.8%(+1.68)#5,114 |
| 44. | Fairwood Cdp Spokane County | 6.4% | 3.2%(+3.23)#44 | 4.8%(+1.67)#5,128 |
| 45. | Buckley | 6.4% | 3.2%(+3.16)#45 | 4.8%(+1.60)#5,222 |
| 46. | Cosmopolis | 6.3% | 3.2%(+3.13)#46 | 4.8%(+1.57)#5,257 |
| 47. | Waller | 6.1% | 3.2%(+2.93)#47 | 4.8%(+1.38)#5,551 |
| 48. | Kettle Falls | 6.1% | 3.2%(+2.91)#48 | 4.8%(+1.36)#5,585 |
| 49. | Mill Creek | 6.1% | 3.2%(+2.90)#49 | 4.8%(+1.35)#5,600 |
| 50. | Suncrest | 6.1% | 3.2%(+2.89)#50 | 4.8%(+1.33)#5,619 |
| 51. | Millwood | 6.0% | 3.2%(+2.83)#51 | 4.8%(+1.27)#5,719 |
| 52. | Sunday Lake | 6.0% | 3.2%(+2.79)#52 | 4.8%(+1.23)#5,804 |
| 53. | Enetai | 6.0% | 3.2%(+2.77)#53 | 4.8%(+1.21)#5,833 |
| 54. | Conconully | 6.0% | 3.2%(+2.76)#54 | 4.8%(+1.20)#5,854 |
| 55. | Airway Heights | 5.9% | 3.2%(+2.69)#55 | 4.8%(+1.13)#5,978 |
| 56. | Port Angeles East | 5.8% | 3.2%(+2.64)#56 | 4.8%(+1.08)#6,061 |
| 57. | South Prairie | 5.8% | 3.2%(+2.57)#57 | 4.8%(+1.01)#6,182 |
| 58. | Liberty Lake | 5.8% | 3.2%(+2.54)#58 | 4.8%(+0.987)#6,226 |
| 59. | North Yelm | 5.7% | 3.2%(+2.51)#59 | 4.8%(+0.952)#6,276 |
| 60. | Lynden | 5.7% | 3.2%(+2.49)#60 | 4.8%(+0.934)#6,307 |
| 61. | Rosalia | 5.6% | 3.2%(+2.41)#61 | 4.8%(+0.851)#6,497 |
| 62. | Nooksack | 5.6% | 3.2%(+2.40)#62 | 4.8%(+0.846)#6,508 |
| 63. | Eastmont | 5.5% | 3.2%(+2.32)#63 | 4.8%(+0.762)#6,678 |
| 64. | La Center | 5.5% | 3.2%(+2.30)#64 | 4.8%(+0.737)#6,720 |
| 65. | Woodinville | 5.5% | 3.2%(+2.28)#65 | 4.8%(+0.724)#6,755 |
| 66. | Mercer Island | 5.5% | 3.2%(+2.27)#66 | 4.8%(+0.716)#6,769 |
| 67. | Browns Point | 5.5% | 3.2%(+2.25)#67 | 4.8%(+0.691)#6,813 |
| 68. | Normandy Park | 5.4% | 3.2%(+2.22)#68 | 4.8%(+0.662)#6,864 |
| 69. | Creston | 5.4% | 3.2%(+2.20)#69 | 4.8%(+0.638)#6,910 |
| 70. | Washougal | 5.4% | 3.2%(+2.16)#70 | 4.8%(+0.597)#6,985 |
| 71. | Maltby | 5.4% | 3.2%(+2.15)#71 | 4.8%(+0.593)#6,990 |
| 72. | Wollochet | 5.4% | 3.2%(+2.15)#72 | 4.8%(+0.590)#6,994 |
| 73. | Salmon Creek | 5.2% | 3.2%(+2.04)#73 | 4.8%(+0.481)#7,231 |
| 74. | Clarkston Heights Vineland | 5.2% | 3.2%(+2.02)#74 | 4.8%(+0.459)#7,270 |
| 75. | Bangor Base | 5.2% | 3.2%(+2.01)#75 | 4.8%(+0.455)#7,277 |
| 76. | Sunnyslope | 5.2% | 3.2%(+1.96)#76 | 4.8%(+0.397)#7,400 |
| 77. | Rainier | 5.2% | 3.2%(+1.95)#77 | 4.8%(+0.391)#7,415 |
| 78. | Camas | 5.2% | 3.2%(+1.95)#78 | 4.8%(+0.391)#7,416 |
| 79. | West Clarkston Highland | 5.1% | 3.2%(+1.94)#79 | 4.8%(+0.380)#7,439 |
| 80. | Duvall | 5.1% | 3.2%(+1.91)#80 | 4.8%(+0.354)#7,513 |
| 81. | Fox Island | 5.1% | 3.2%(+1.90)#81 | 4.8%(+0.341)#7,537 |
| 82. | Silver Firs | 5.1% | 3.2%(+1.90)#82 | 4.8%(+0.338)#7,544 |
| 83. | Burlington | 5.1% | 3.2%(+1.84)#83 | 4.8%(+0.285)#7,659 |
| 84. | Bethel | 5.1% | 3.2%(+1.84)#84 | 4.8%(+0.283)#7,660 |
| 85. | Barberton | 5.0% | 3.2%(+1.83)#85 | 4.8%(+0.268)#7,695 |
| 86. | Oakesdale | 5.0% | 3.2%(+1.79)#86 | 4.8%(+0.233)#7,765 |
| 87. | Carson | 5.0% | 3.2%(+1.78)#87 | 4.8%(+0.222)#7,795 |
| 88. | Steilacoom | 5.0% | 3.2%(+1.78)#88 | 4.8%(+0.218)#7,804 |
| 89. | Wilbur | 5.0% | 3.2%(+1.77)#89 | 4.8%(+0.213)#7,815 |
| 90. | Wauna | 5.0% | 3.2%(+1.75)#90 | 4.8%(+0.189)#7,875 |
| 91. | Monroe | 4.9% | 3.2%(+1.72)#91 | 4.8%(+0.161)#7,929 |
| 92. | Cottage Lake | 4.9% | 3.2%(+1.71)#92 | 4.8%(+0.157)#7,935 |
| 93. | Fords Prairie | 4.9% | 3.2%(+1.71)#93 | 4.8%(+0.157)#7,936 |
| 94. | Bothell | 4.9% | 3.2%(+1.70)#94 | 4.8%(+0.145)#7,959 |
| 95. | Hobart | 4.9% | 3.2%(+1.69)#95 | 4.8%(+0.131)#7,997 |
| 96. | Otis Orchards East Farms | 4.9% | 3.2%(+1.67)#96 | 4.8%(+0.111)#8,043 |
| 97. | Roy | 4.9% | 3.2%(+1.67)#97 | 4.8%(+0.111)#8,047 |
| 98. | La Conner | 4.9% | 3.2%(+1.66)#98 | 4.8%(+0.100)#8,075 |
| 99. | East Cathlamet | 4.8% | 3.2%(+1.62)#99 | 4.8%(+0.060)#8,167 |
| 100. | Kendall | 4.8% | 3.2%(+1.60)#100 | 4.8%(+0.043)#8,217 |
Common Questions
What are the Top 10 Cities with the Highest Percentage of Population Employed in Finance & Insurance in Washington?
Top 10 Cities with the Highest Percentage of Population Employed in Finance & Insurance in Washington are:
#1
47.8%
#2
26.5%
#3
26.3%
#4
21.7%
#5
21.4%
#6
21.4%
#7
21.3%
#8
20.2%
#9
18.3%
#10
16.3%
What city has the Highest Percentage of Population Employed in Finance & Insurance in Washington?
Acme has the Highest Percentage of Population Employed in Finance & Insurance in Washington with 47.8%.
What is the Percentage of Population Employed in Finance & Insurance in the State of Washington?
Percentage of Population Employed in Finance & Insurance in Washington is 3.2%.
What is the Percentage of Population Employed in Finance & Insurance in the United States?
Percentage of Population Employed in Finance & Insurance in the United States is 4.8%.