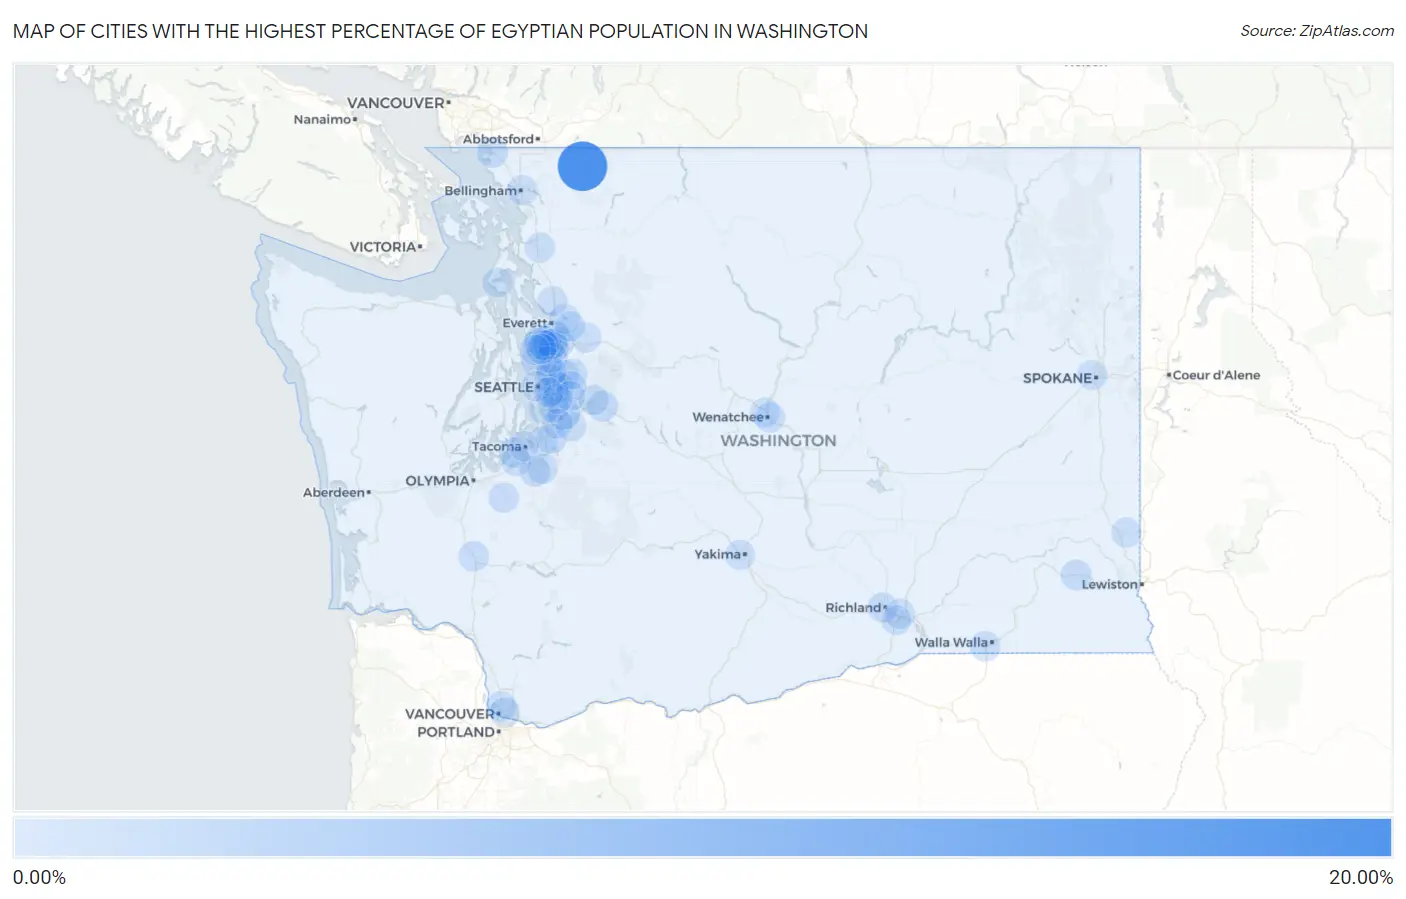
Cities with the Highest Percentage of Egyptian Population in Washington
RELATED REPORTS & OPTIONS
Egyptian
Washington
Compare Cities
Map of Cities with the Highest Percentage of Egyptian Population in Washington
0.00%
20.00%
Cities with the Highest Percentage of Egyptian Population in Washington
| City | Egyptian | vs State | vs National | |
| 1. | Glacier | 18.26% | 0.063%(+18.2)#1 | 0.093%(+18.2)#4 |
| 2. | Maple Heights Lake Desire | 1.69% | 0.063%(+1.62)#2 | 0.093%(+1.59)#110 |
| 3. | Eastmont | 0.97% | 0.063%(+0.907)#3 | 0.093%(+0.878)#234 |
| 4. | Beaux Arts Village | 0.78% | 0.063%(+0.712)#4 | 0.093%(+0.682)#312 |
| 5. | Picnic Point | 0.68% | 0.063%(+0.620)#5 | 0.093%(+0.590)#348 |
| 6. | Meadowdale | 0.67% | 0.063%(+0.604)#6 | 0.093%(+0.574)#360 |
| 7. | Blaine | 0.66% | 0.063%(+0.601)#7 | 0.093%(+0.572)#363 |
| 8. | Pomeroy | 0.64% | 0.063%(+0.581)#8 | 0.093%(+0.551)#380 |
| 9. | Yarrow Point | 0.63% | 0.063%(+0.562)#9 | 0.093%(+0.532)#392 |
| 10. | North Bend | 0.62% | 0.063%(+0.559)#10 | 0.093%(+0.529)#394 |
| 11. | Larch Way | 0.59% | 0.063%(+0.528)#11 | 0.093%(+0.498)#418 |
| 12. | Frederickson | 0.55% | 0.063%(+0.490)#12 | 0.093%(+0.460)#450 |
| 13. | Silver Firs | 0.50% | 0.063%(+0.436)#13 | 0.093%(+0.406)#491 |
| 14. | Martha Lake | 0.50% | 0.063%(+0.435)#14 | 0.093%(+0.405)#493 |
| 15. | Mill Creek East | 0.42% | 0.063%(+0.359)#15 | 0.093%(+0.329)#576 |
| 16. | Roche Harbor | 0.40% | 0.063%(+0.335)#16 | 0.093%(+0.305)#603 |
| 17. | Bothell | 0.39% | 0.063%(+0.329)#17 | 0.093%(+0.299)#611 |
| 18. | Napavine | 0.35% | 0.063%(+0.289)#18 | 0.093%(+0.260)#680 |
| 19. | Redmond | 0.31% | 0.063%(+0.246)#19 | 0.093%(+0.216)#755 |
| 20. | Bellevue | 0.26% | 0.063%(+0.197)#20 | 0.093%(+0.167)#863 |
| 21. | College Place | 0.26% | 0.063%(+0.192)#21 | 0.093%(+0.162)#880 |
| 22. | Union Hill Novelty Hill | 0.23% | 0.063%(+0.170)#22 | 0.093%(+0.140)#936 |
| 23. | Snoqualmie | 0.23% | 0.063%(+0.162)#23 | 0.093%(+0.132)#952 |
| 24. | Auburn | 0.20% | 0.063%(+0.134)#24 | 0.093%(+0.104)#1,040 |
| 25. | Shoreline | 0.19% | 0.063%(+0.129)#25 | 0.093%(+0.099)#1,061 |
| 26. | Yelm | 0.19% | 0.063%(+0.128)#26 | 0.093%(+0.098)#1,064 |
| 27. | Tukwila | 0.19% | 0.063%(+0.127)#27 | 0.093%(+0.097)#1,070 |
| 28. | Sammamish | 0.16% | 0.063%(+0.094)#28 | 0.093%(+0.064)#1,172 |
| 29. | Lake Stickney | 0.16% | 0.063%(+0.093)#29 | 0.093%(+0.063)#1,176 |
| 30. | Kenmore | 0.16% | 0.063%(+0.093)#30 | 0.093%(+0.063)#1,177 |
| 31. | Coupeville | 0.15% | 0.063%(+0.084)#31 | 0.093%(+0.054)#1,216 |
| 32. | East Wenatchee | 0.14% | 0.063%(+0.079)#32 | 0.093%(+0.049)#1,237 |
| 33. | Renton | 0.14% | 0.063%(+0.078)#33 | 0.093%(+0.048)#1,245 |
| 34. | Mill Creek | 0.13% | 0.063%(+0.071)#34 | 0.093%(+0.041)#1,281 |
| 35. | Maple Valley | 0.12% | 0.063%(+0.058)#35 | 0.093%(+0.028)#1,347 |
| 36. | Richland | 0.12% | 0.063%(+0.052)#36 | 0.093%(+0.022)#1,385 |
| 37. | Woods Creek | 0.11% | 0.063%(+0.050)#37 | 0.093%(+0.020)#1,392 |
| 38. | Kirkland | 0.11% | 0.063%(+0.042)#38 | 0.093%(+0.012)#1,442 |
| 39. | Seattle | 0.10% | 0.063%(+0.040)#39 | 0.093%(+0.010)#1,445 |
| 40. | Bellingham | 0.10% | 0.063%(+0.038)#40 | 0.093%(+0.008)#1,459 |
| 41. | Issaquah | 0.091% | 0.063%(+0.028)#41 | 0.093%(-0.002)#1,525 |
| 42. | Pasco | 0.091% | 0.063%(+0.027)#42 | 0.093%(-0.003)#1,529 |
| 43. | University Place | 0.086% | 0.063%(+0.023)#43 | 0.093%(-0.007)#1,551 |
| 44. | Lakeland South | 0.079% | 0.063%(+0.016)#44 | 0.093%(-0.014)#1,602 |
| 45. | Newcastle | 0.077% | 0.063%(+0.014)#45 | 0.093%(-0.016)#1,615 |
| 46. | Hazel Dell | 0.075% | 0.063%(+0.011)#46 | 0.093%(-0.019)#1,637 |
| 47. | Lake Stevens | 0.070% | 0.063%(+0.006)#47 | 0.093%(-0.024)#1,678 |
| 48. | North Lynnwood | 0.066% | 0.063%(+0.003)#48 | 0.093%(-0.027)#1,701 |
| 49. | Mercer Island | 0.055% | 0.063%(-0.009)#49 | 0.093%(-0.038)#1,783 |
| 50. | Kennewick | 0.054% | 0.063%(-0.010)#50 | 0.093%(-0.040)#1,795 |
| 51. | Pullman | 0.047% | 0.063%(-0.017)#51 | 0.093%(-0.047)#1,852 |
| 52. | Kent | 0.044% | 0.063%(-0.019)#52 | 0.093%(-0.049)#1,878 |
| 53. | Edmonds | 0.040% | 0.063%(-0.024)#53 | 0.093%(-0.054)#1,926 |
| 54. | Yakima | 0.037% | 0.063%(-0.026)#54 | 0.093%(-0.056)#1,957 |
| 55. | Spokane | 0.037% | 0.063%(-0.027)#55 | 0.093%(-0.057)#1,962 |
| 56. | Mount Vernon | 0.034% | 0.063%(-0.029)#56 | 0.093%(-0.059)#1,985 |
| 57. | Everett | 0.028% | 0.063%(-0.036)#57 | 0.093%(-0.065)#2,050 |
| 58. | Lynnwood | 0.025% | 0.063%(-0.038)#58 | 0.093%(-0.068)#2,084 |
| 59. | Wenatchee | 0.023% | 0.063%(-0.041)#59 | 0.093%(-0.071)#2,113 |
| 60. | Lakewood | 0.022% | 0.063%(-0.041)#60 | 0.093%(-0.071)#2,120 |
| 61. | South Hill | 0.015% | 0.063%(-0.049)#61 | 0.093%(-0.079)#2,196 |
| 62. | Tacoma | 0.013% | 0.063%(-0.050)#62 | 0.093%(-0.080)#2,225 |
| 63. | Vancouver | 0.013% | 0.063%(-0.051)#63 | 0.093%(-0.081)#2,227 |
| 64. | Marysville | 0.0085% | 0.063%(-0.055)#64 | 0.093%(-0.085)#2,262 |
Common Questions
What are the Top 10 Cities with the Highest Percentage of Egyptian Population in Washington?
Top 10 Cities with the Highest Percentage of Egyptian Population in Washington are:
#1
18.26%
#2
1.69%
#3
0.97%
#4
0.78%
#5
0.68%
#6
0.67%
#7
0.66%
#8
0.64%
#9
0.63%
#10
0.62%
What city has the Highest Percentage of Egyptian Population in Washington?
Glacier has the Highest Percentage of Egyptian Population in Washington with 18.26%.
What is the Percentage of Egyptian Population in the State of Washington?
Percentage of Egyptian Population in Washington is 0.063%.
What is the Percentage of Egyptian Population in the United States?
Percentage of Egyptian Population in the United States is 0.093%.