Ashford, WA Map & Demographics
Ashford Map
Ashford Overview
$32,951
PER CAPITA INCOME
$74,700
AVG FAMILY INCOME
$74,600
AVG HOUSEHOLD INCOME
51.0%
WAGE / INCOME GAP [ % ]
49.0¢/ $1
WAGE / INCOME GAP [ $ ]
0.31
INEQUALITY / GINI INDEX
675
TOTAL POPULATION
383
MALE POPULATION
292
FEMALE POPULATION
131.16
MALES / 100 FEMALES
76.24
FEMALES / 100 MALES
55.1
MEDIAN AGE
2.8
AVG FAMILY SIZE
2.5
AVG HOUSEHOLD SIZE
332
LABOR FORCE [ PEOPLE ]
51.0%
PERCENT IN LABOR FORCE
Ashford Zip Codes
Ashford Area Codes
Income in Ashford
Income Overview in Ashford
Per Capita Income in Ashford is $32,951, while median incomes of families and households are $74,700 and $74,600 respectively.
| Characteristic | Number | Measure |
| Per Capita Income | 675 | $32,951 |
| Median Family Income | 180 | $74,700 |
| Mean Family Income | 180 | $86,528 |
| Median Household Income | 268 | $74,600 |
| Mean Household Income | 268 | $83,494 |
| Income Deficit | 180 | $0 |
| Wage / Income Gap (%) | 675 | 51.01% |
| Wage / Income Gap ($) | 675 | 48.99¢ per $1 |
| Gini / Inequality Index | 675 | 0.31 |
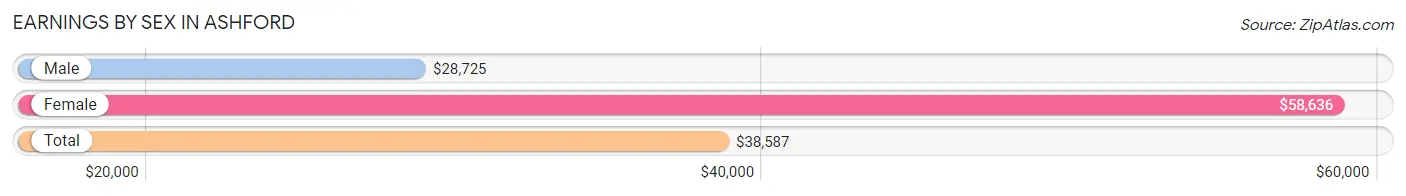
Earnings by Sex in Ashford
Average Earnings in Ashford are $38,587, $28,725 for men and $58,636 for women, a difference of 51.0%.
| Sex | Number | Average Earnings |
| Male | 244 (64.5%) | $28,725 |
| Female | 134 (35.4%) | $58,636 |
| Total | 378 (100.0%) | $38,587 |
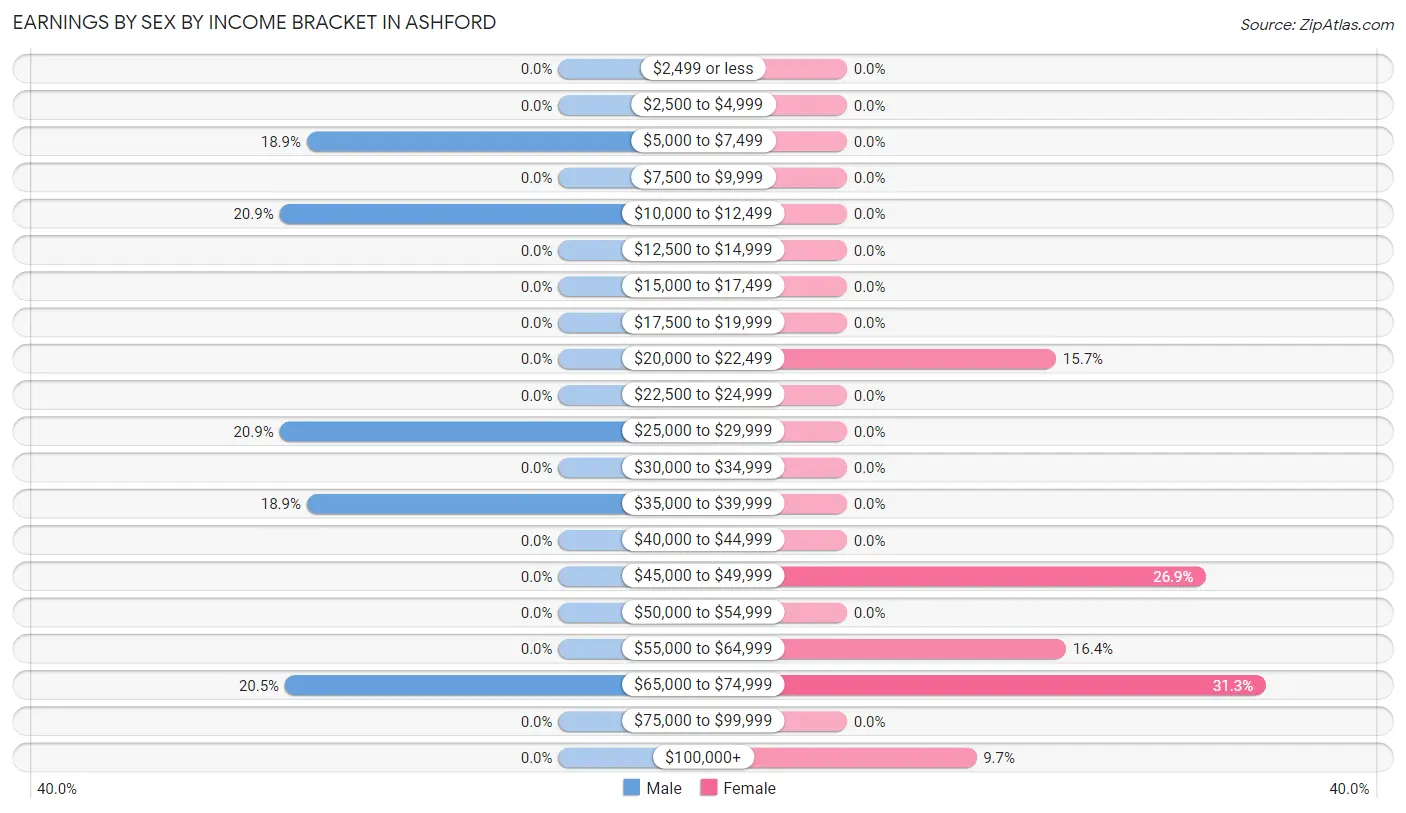
Earnings by Sex by Income Bracket in Ashford
The most common earnings brackets in Ashford are $10,000 to $12,499 for men (51 | 20.9%) and $65,000 to $74,999 for women (42 | 31.3%).
| Income | Male | Female |
| $2,499 or less | 0 (0.0%) | 0 (0.0%) |
| $2,500 to $4,999 | 0 (0.0%) | 0 (0.0%) |
| $5,000 to $7,499 | 46 (18.9%) | 0 (0.0%) |
| $7,500 to $9,999 | 0 (0.0%) | 0 (0.0%) |
| $10,000 to $12,499 | 51 (20.9%) | 0 (0.0%) |
| $12,500 to $14,999 | 0 (0.0%) | 0 (0.0%) |
| $15,000 to $17,499 | 0 (0.0%) | 0 (0.0%) |
| $17,500 to $19,999 | 0 (0.0%) | 0 (0.0%) |
| $20,000 to $22,499 | 0 (0.0%) | 21 (15.7%) |
| $22,500 to $24,999 | 0 (0.0%) | 0 (0.0%) |
| $25,000 to $29,999 | 51 (20.9%) | 0 (0.0%) |
| $30,000 to $34,999 | 0 (0.0%) | 0 (0.0%) |
| $35,000 to $39,999 | 46 (18.9%) | 0 (0.0%) |
| $40,000 to $44,999 | 0 (0.0%) | 0 (0.0%) |
| $45,000 to $49,999 | 0 (0.0%) | 36 (26.9%) |
| $50,000 to $54,999 | 0 (0.0%) | 0 (0.0%) |
| $55,000 to $64,999 | 0 (0.0%) | 22 (16.4%) |
| $65,000 to $74,999 | 50 (20.5%) | 42 (31.3%) |
| $75,000 to $99,999 | 0 (0.0%) | 0 (0.0%) |
| $100,000+ | 0 (0.0%) | 13 (9.7%) |
| Total | 244 (100.0%) | 134 (100.0%) |
Earnings by Sex by Educational Attainment in Ashford
| Educational Attainment | Male Income | Female Income |
| Less than High School | - | - |
| High School Diploma | - | - |
| College or Associate's Degree | - | - |
| Bachelor's Degree | - | - |
| Graduate Degree | - | - |
| Total | $28,725 | $58,636 |
Family Income in Ashford
Family Income Brackets in Ashford
According to the Ashford family income data, there are 63 families falling into the $100,000 to $149,999 income range, which is the most common income bracket and makes up 35.0% of all families.
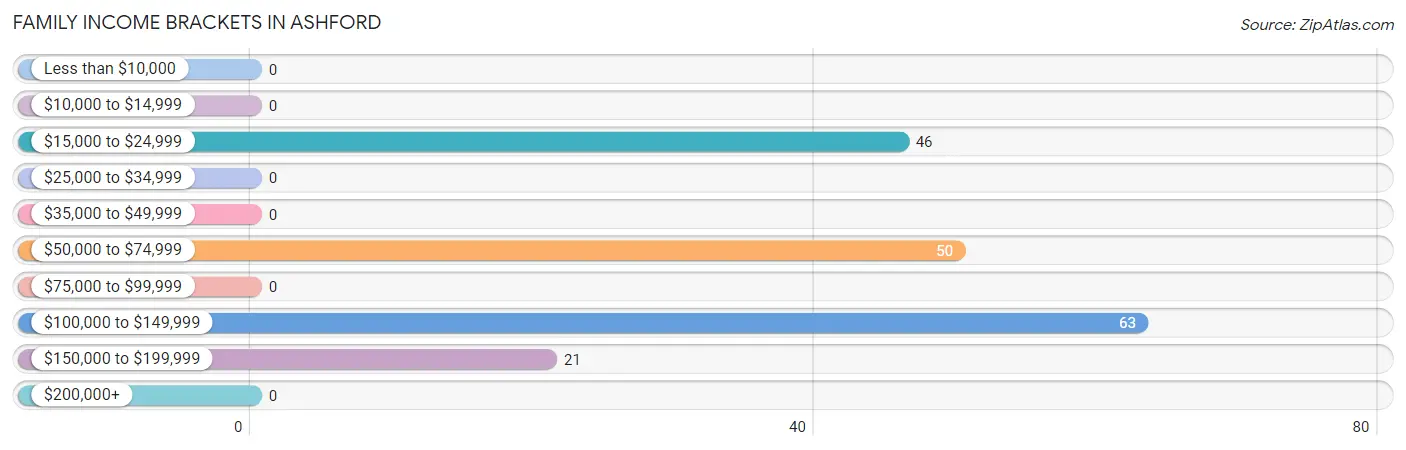
| Income Bracket | # Families | % Families |
| Less than $10,000 | 0 | 0.0% |
| $10,000 to $14,999 | 0 | 0.0% |
| $15,000 to $24,999 | 46 | 25.6% |
| $25,000 to $34,999 | 0 | 0.0% |
| $35,000 to $49,999 | 0 | 0.0% |
| $50,000 to $74,999 | 50 | 27.8% |
| $75,000 to $99,999 | 0 | 0.0% |
| $100,000 to $149,999 | 63 | 35.0% |
| $150,000 to $199,999 | 21 | 11.7% |
| $200,000+ | 0 | 0.0% |
Family Income by Famaliy Size in Ashford
| Income Bracket | # Families | Median Income |
| 2-Person Families | 96 (53.3%) | $0 |
| 3-Person Families | 63 (35.0%) | $0 |
| 4-Person Families | 0 (0.0%) | $0 |
| 5-Person Families | 21 (11.7%) | $0 |
| 6-Person Families | 0 (0.0%) | $0 |
| 7+ Person Families | 0 (0.0%) | $0 |
| Total | 180 (100.0%) | $74,700 |
Family Income by Number of Earners in Ashford
| Number of Earners | # Families | Median Income |
| No Earners | 46 (25.6%) | $0 |
| 1 Earner | 67 (37.2%) | $0 |
| 2 Earners | 46 (25.6%) | $0 |
| 3+ Earners | 21 (11.7%) | $0 |
| Total | 180 (100.0%) | $74,700 |
Household Income in Ashford
Household Income Brackets in Ashford
With 105 households falling in the category, the $100,000 to $149,999 income range is the most frequent in Ashford, accounting for 39.2% of all households.
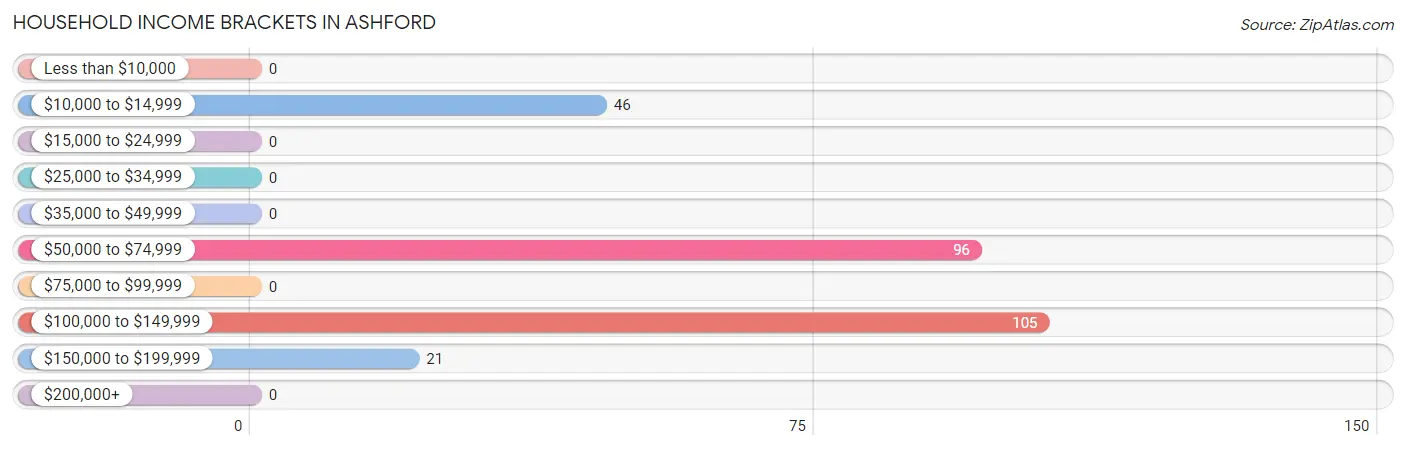
| Income Bracket | # Households | % Households |
| Less than $10,000 | 0 | 0.0% |
| $10,000 to $14,999 | 46 | 17.2% |
| $15,000 to $24,999 | 0 | 0.0% |
| $25,000 to $34,999 | 0 | 0.0% |
| $35,000 to $49,999 | 0 | 0.0% |
| $50,000 to $74,999 | 96 | 35.8% |
| $75,000 to $99,999 | 0 | 0.0% |
| $100,000 to $149,999 | 105 | 39.2% |
| $150,000 to $199,999 | 21 | 7.8% |
| $200,000+ | 0 | 0.0% |
Household Income by Householder Age in Ashford
The median household income in Ashford is $74,600, with the highest median household income of $73,550 found in the 45 to 64 years age bracket for the primary householder. A total of 134 households (50.0%) fall into this category.
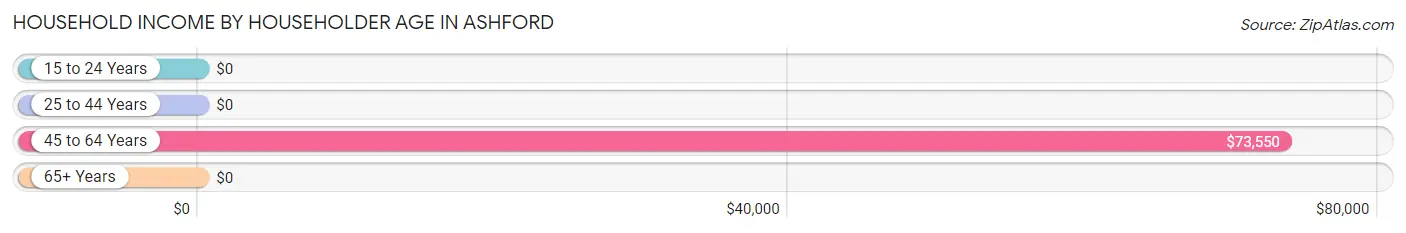
| Income Bracket | # Households | Median Income |
| 15 to 24 Years | 0 (0.0%) | $0 |
| 25 to 44 Years | 42 (15.7%) | $0 |
| 45 to 64 Years | 134 (50.0%) | $73,550 |
| 65+ Years | 92 (34.3%) | $0 |
| Total | 268 (100.0%) | $74,600 |
Poverty in Ashford
Income Below Poverty by Sex and Age in Ashford
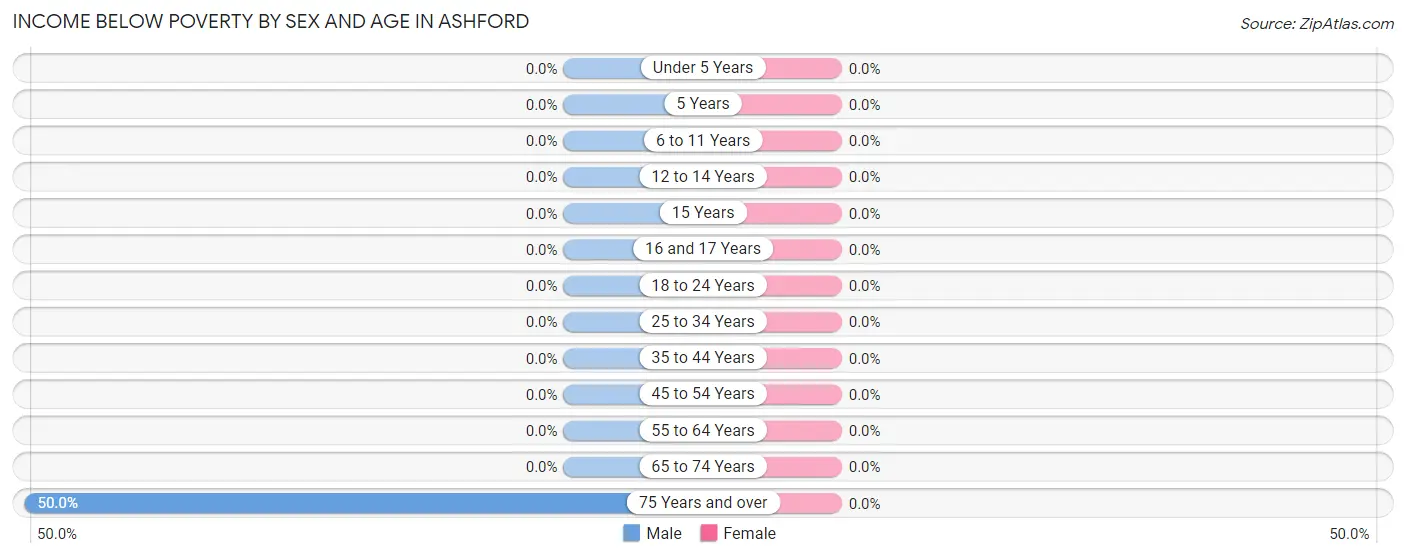
| Age Bracket | Male | Female |
| Under 5 Years | 0 (0.0%) | 0 (0.0%) |
| 5 Years | 0 (0.0%) | 0 (0.0%) |
| 6 to 11 Years | 0 (0.0%) | 0 (0.0%) |
| 12 to 14 Years | 0 (0.0%) | 0 (0.0%) |
| 15 Years | 0 (0.0%) | 0 (0.0%) |
| 16 and 17 Years | 0 (0.0%) | 0 (0.0%) |
| 18 to 24 Years | 0 (0.0%) | 0 (0.0%) |
| 25 to 34 Years | 0 (0.0%) | 0 (0.0%) |
| 35 to 44 Years | 0 (0.0%) | 0 (0.0%) |
| 45 to 54 Years | 0 (0.0%) | 0 (0.0%) |
| 55 to 64 Years | 0 (0.0%) | 0 (0.0%) |
| 65 to 74 Years | 0 (0.0%) | 0 (0.0%) |
| 75 Years and over | 46 (50.0%) | 0 (0.0%) |
| Total | 46 (12.0%) | 0 (0.0%) |
Income Above Poverty by Sex and Age in Ashford
According to the poverty statistics in Ashford, males aged under 5 years and females aged 16 and 17 years are the age groups that are most secure financially, with 100.0% of males and 100.0% of females in these age groups living above the poverty line.
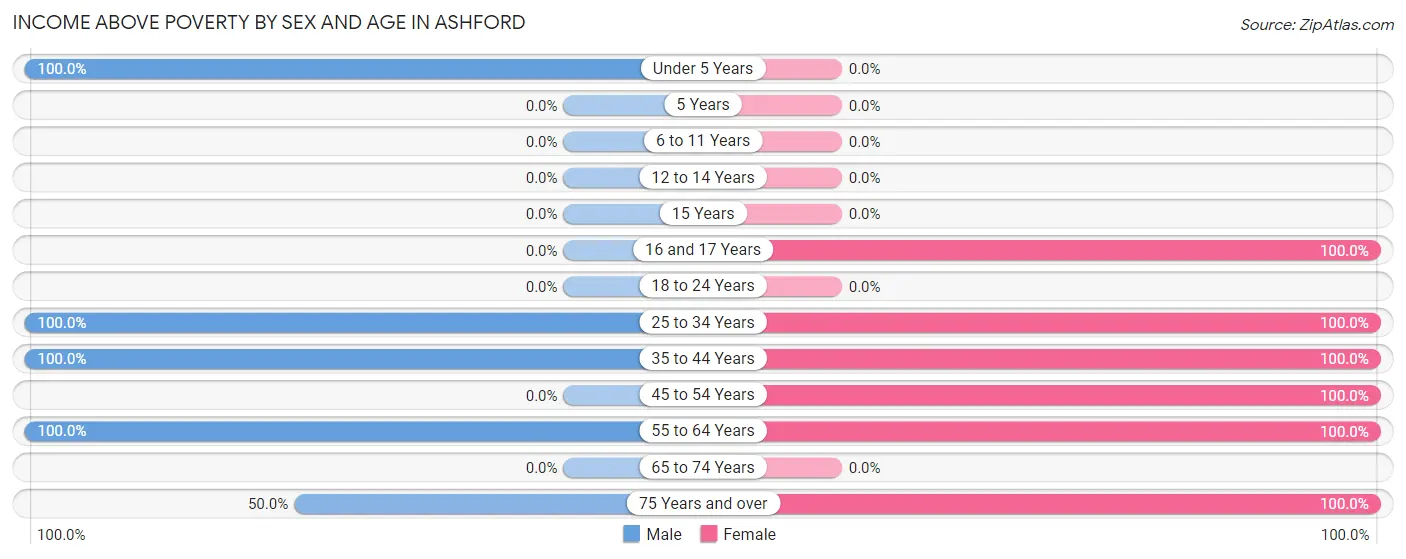
| Age Bracket | Male | Female |
| Under 5 Years | 24 (100.0%) | 0 (0.0%) |
| 5 Years | 0 (0.0%) | 0 (0.0%) |
| 6 to 11 Years | 0 (0.0%) | 0 (0.0%) |
| 12 to 14 Years | 0 (0.0%) | 0 (0.0%) |
| 15 Years | 0 (0.0%) | 0 (0.0%) |
| 16 and 17 Years | 0 (0.0%) | 18 (100.0%) |
| 18 to 24 Years | 0 (0.0%) | 0 (0.0%) |
| 25 to 34 Years | 24 (100.0%) | 113 (100.0%) |
| 35 to 44 Years | 103 (100.0%) | 36 (100.0%) |
| 45 to 54 Years | 0 (0.0%) | 13 (100.0%) |
| 55 to 64 Years | 140 (100.0%) | 67 (100.0%) |
| 65 to 74 Years | 0 (0.0%) | 0 (0.0%) |
| 75 Years and over | 46 (50.0%) | 45 (100.0%) |
| Total | 337 (88.0%) | 292 (100.0%) |
Income Below Poverty Among Married-Couple Families in Ashford
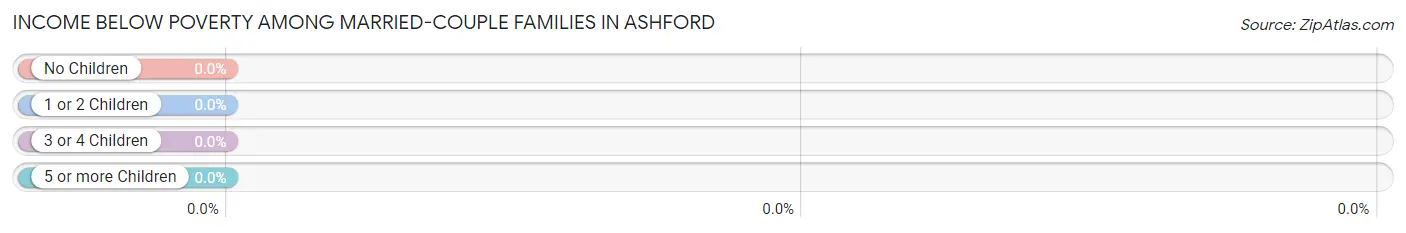
| Children | Above Poverty | Below Poverty |
| No Children | 46 (100.0%) | 0 (0.0%) |
| 1 or 2 Children | 38 (100.0%) | 0 (0.0%) |
| 3 or 4 Children | 0 (0.0%) | 0 (0.0%) |
| 5 or more Children | 0 (0.0%) | 0 (0.0%) |
| Total | 84 (100.0%) | 0 (0.0%) |
Income Below Poverty Among Single-Parent Households in Ashford
| Children | Single Father | Single Mother |
| No Children | 0 (0.0%) | 0 (0.0%) |
| 1 or 2 Children | 0 (0.0%) | 0 (0.0%) |
| 3 or 4 Children | 0 (0.0%) | 0 (0.0%) |
| 5 or more Children | 0 (0.0%) | 0 (0.0%) |
| Total | 0 (0.0%) | 0 (0.0%) |
Income Below Poverty Among Married-Couple vs Single-Parent Households in Ashford
| Children | Married-Couple Families | Single-Parent Households |
| No Children | 0 (0.0%) | 0 (0.0%) |
| 1 or 2 Children | 0 (0.0%) | 0 (0.0%) |
| 3 or 4 Children | 0 (0.0%) | 0 (0.0%) |
| 5 or more Children | 0 (0.0%) | 0 (0.0%) |
| Total | 0 (0.0%) | 0 (0.0%) |
Race in Ashford
The most populous races in Ashford are White / Caucasian (608 | 90.1%), Hispanic or Latino (106 | 15.7%), and Two or more Races (36 | 5.3%).
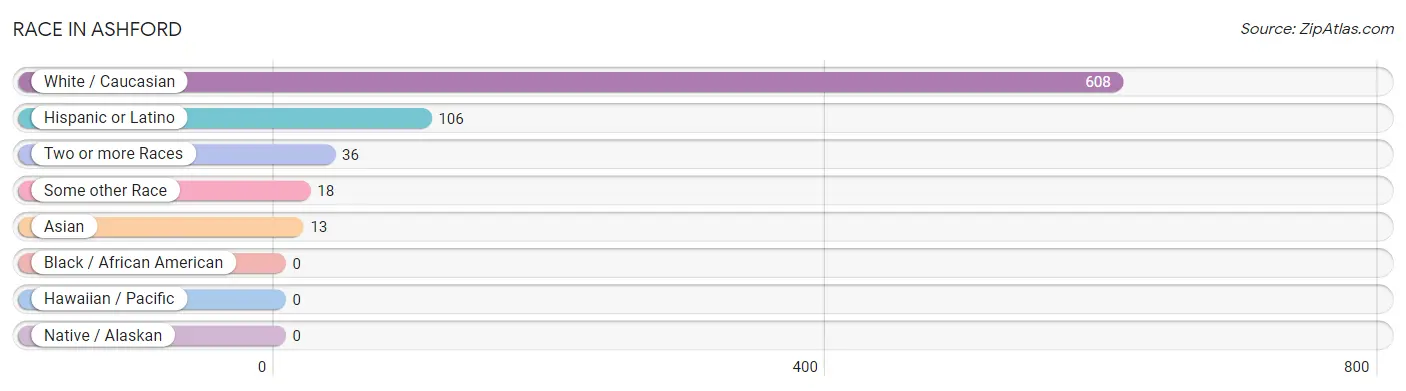
| Race | # Population | % Population |
| Asian | 13 | 1.9% |
| Black / African American | 0 | 0.0% |
| Hawaiian / Pacific | 0 | 0.0% |
| Hispanic or Latino | 106 | 15.7% |
| Native / Alaskan | 0 | 0.0% |
| White / Caucasian | 608 | 90.1% |
| Two or more Races | 36 | 5.3% |
| Some other Race | 18 | 2.7% |
| Total | 675 | 100.0% |
Ancestry in Ashford
The most populous ancestries reported in Ashford are Irish (231 | 34.2%), German (160 | 23.7%), English (127 | 18.8%), Norwegian (99 | 14.7%), and Belgian (69 | 10.2%), together accounting for 101.6% of all Ashford residents.
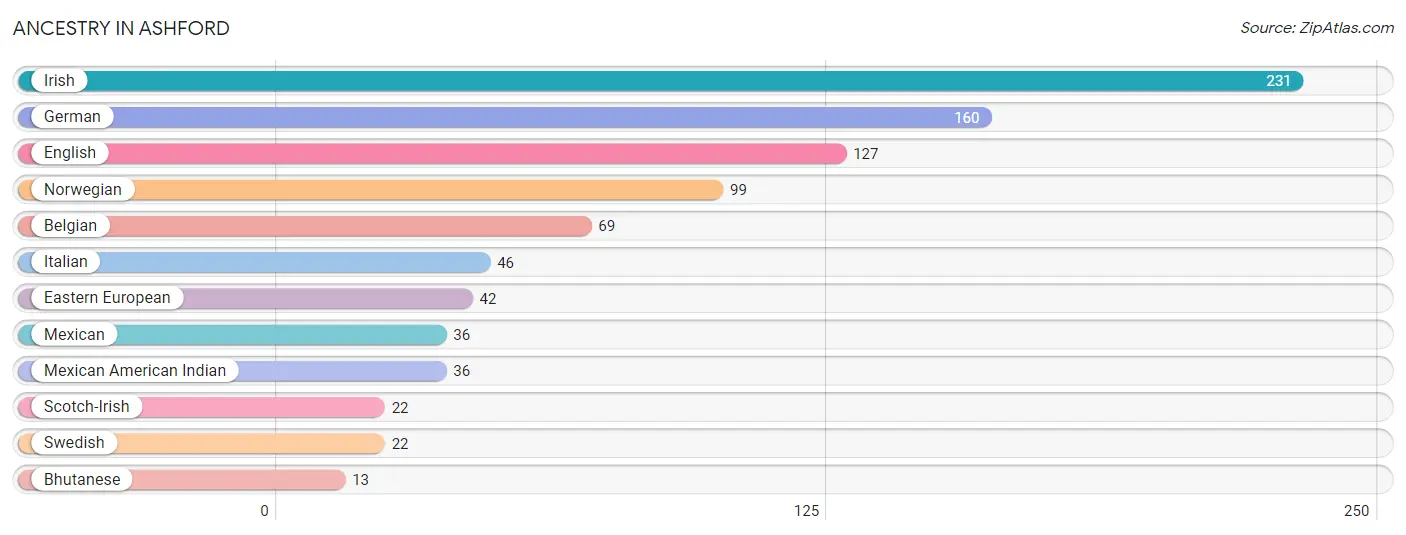
| Ancestry | # Population | % Population |
| Belgian | 69 | 10.2% |
| Bhutanese | 13 | 1.9% |
| Eastern European | 42 | 6.2% |
| English | 127 | 18.8% |
| German | 160 | 23.7% |
| Irish | 231 | 34.2% |
| Italian | 46 | 6.8% |
| Mexican | 36 | 5.3% |
| Mexican American Indian | 36 | 5.3% |
| Norwegian | 99 | 14.7% |
| Scotch-Irish | 22 | 3.3% |
| Swedish | 22 | 3.3% | View All 12 Rows |
Immigrants in Ashford
The most numerous immigrant groups reported in Ashford came from Asia (13 | 1.9%), Eastern Asia (13 | 1.9%), and Japan (13 | 1.9%), together accounting for 5.8% of all Ashford residents.
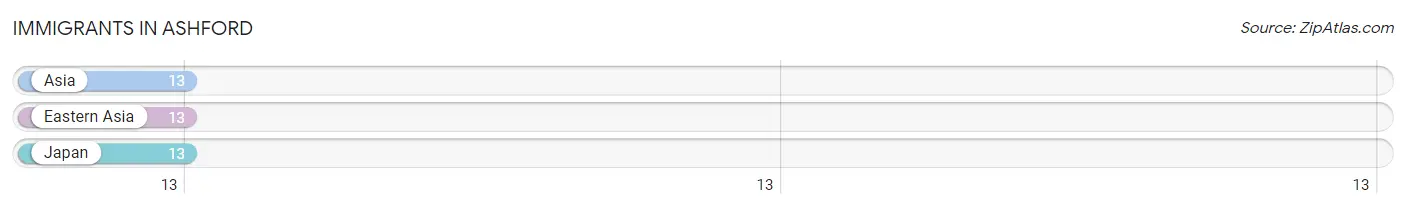
| Immigration Origin | # Population | % Population |
| Asia | 13 | 1.9% |
| Eastern Asia | 13 | 1.9% |
| Japan | 13 | 1.9% | View All 3 Rows |
Sex and Age in Ashford
Sex and Age in Ashford
The most populous age groups in Ashford are 60 to 64 Years (140 | 36.5%) for men and 30 to 34 Years (113 | 38.7%) for women.
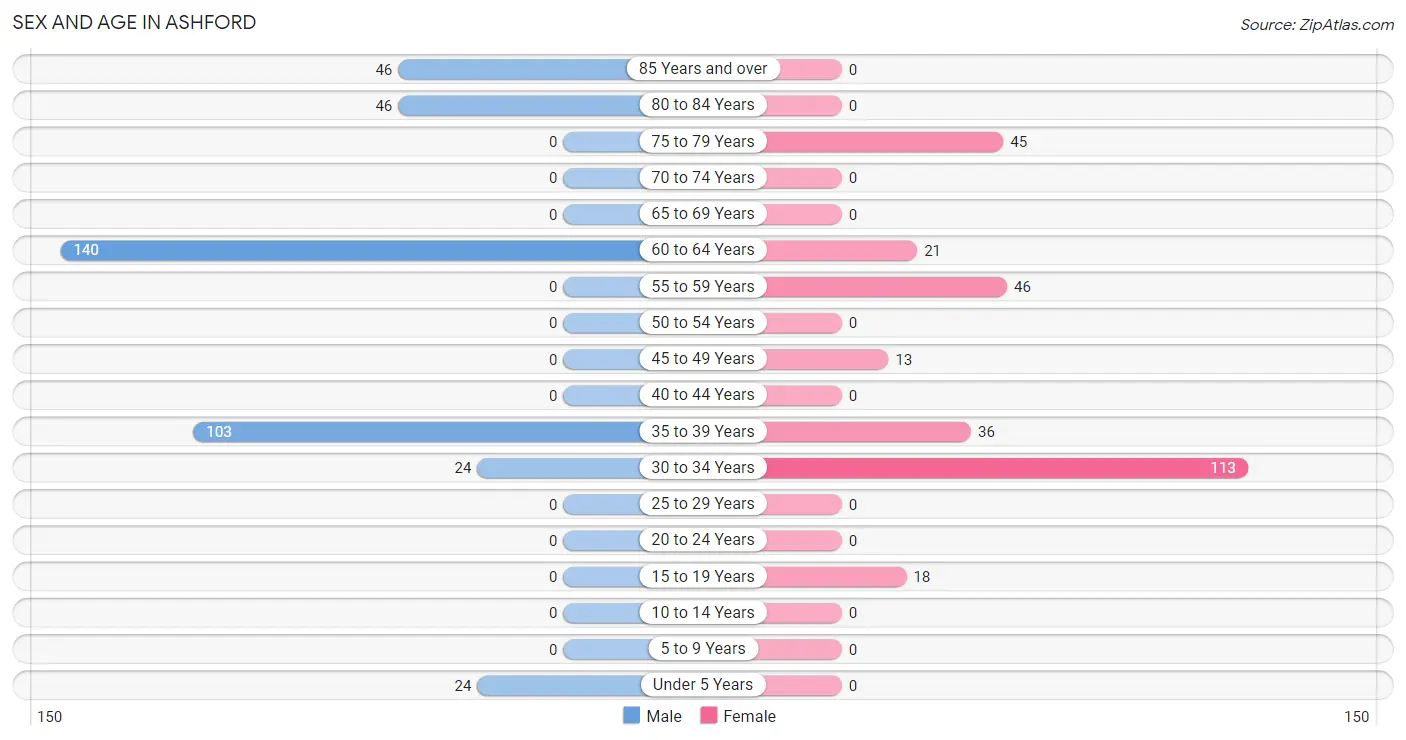
| Age Bracket | Male | Female |
| Under 5 Years | 24 (6.3%) | 0 (0.0%) |
| 5 to 9 Years | 0 (0.0%) | 0 (0.0%) |
| 10 to 14 Years | 0 (0.0%) | 0 (0.0%) |
| 15 to 19 Years | 0 (0.0%) | 18 (6.2%) |
| 20 to 24 Years | 0 (0.0%) | 0 (0.0%) |
| 25 to 29 Years | 0 (0.0%) | 0 (0.0%) |
| 30 to 34 Years | 24 (6.3%) | 113 (38.7%) |
| 35 to 39 Years | 103 (26.9%) | 36 (12.3%) |
| 40 to 44 Years | 0 (0.0%) | 0 (0.0%) |
| 45 to 49 Years | 0 (0.0%) | 13 (4.4%) |
| 50 to 54 Years | 0 (0.0%) | 0 (0.0%) |
| 55 to 59 Years | 0 (0.0%) | 46 (15.8%) |
| 60 to 64 Years | 140 (36.5%) | 21 (7.2%) |
| 65 to 69 Years | 0 (0.0%) | 0 (0.0%) |
| 70 to 74 Years | 0 (0.0%) | 0 (0.0%) |
| 75 to 79 Years | 0 (0.0%) | 45 (15.4%) |
| 80 to 84 Years | 46 (12.0%) | 0 (0.0%) |
| 85 Years and over | 46 (12.0%) | 0 (0.0%) |
| Total | 383 (100.0%) | 292 (100.0%) |
Families and Households in Ashford
Median Family Size in Ashford
The median family size in Ashford is 2.78 persons per family, with married-couple families (84 | 46.7%) accounting for the largest median family size of 3.61 persons per family. On the other hand, single male/father families (50 | 27.8%) represent the smallest median family size with 1.98 persons per family.
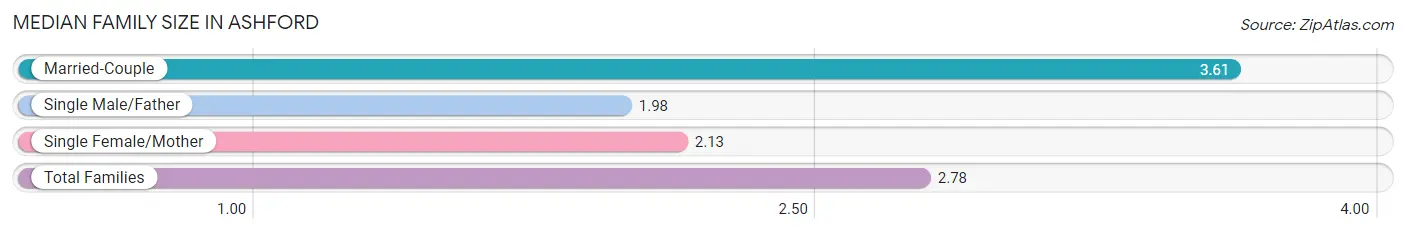
| Family Type | # Families | Family Size |
| Married-Couple | 84 (46.7%) | 3.61 |
| Single Male/Father | 50 (27.8%) | 1.98 |
| Single Female/Mother | 46 (25.6%) | 2.13 |
| Total Families | 180 (100.0%) | 2.78 |
Median Household Size in Ashford
The median household size in Ashford is 2.52 persons per household, with married-couple households (84 | 31.3%) accounting for the largest median household size of 3.61 persons per household. non-family households (88 | 32.8%) represent the smallest median household size with 1.41 persons per household.
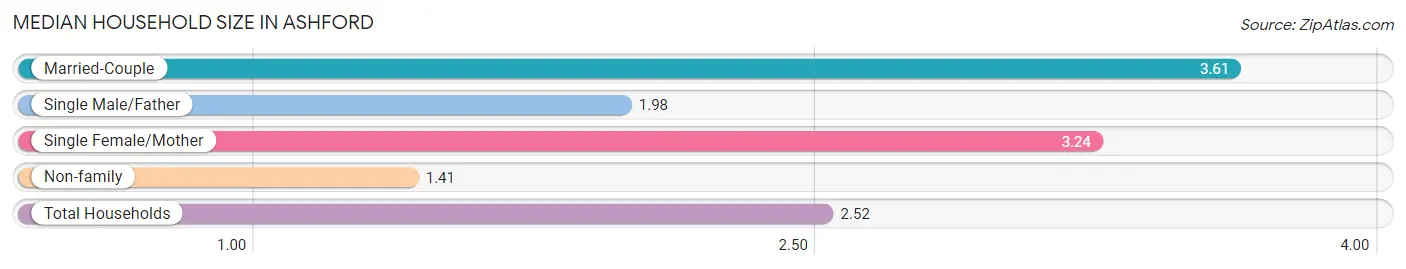
| Household Type | # Households | Household Size |
| Married-Couple | 84 (31.3%) | 3.61 |
| Single Male/Father | 50 (18.7%) | 1.98 |
| Single Female/Mother | 46 (17.2%) | 3.24 |
| Non-family | 88 (32.8%) | 1.41 |
| Total Households | 268 (100.0%) | 2.52 |
Household Size by Marriage Status in Ashford
Out of a total of 268 households in Ashford, 180 (67.2%) are family households, while 88 (32.8%) are nonfamily households. The most numerous type of family households are 3-person households, comprising 109, and the most common type of nonfamily households are 1-person households, comprising 46.
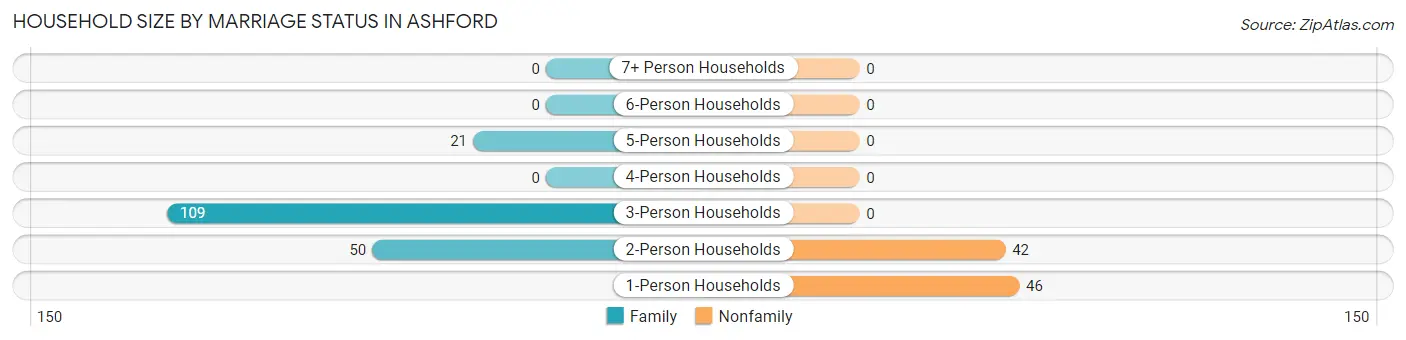
| Household Size | Family Households | Nonfamily Households |
| 1-Person Households | - | 46 (17.2%) |
| 2-Person Households | 50 (18.7%) | 42 (15.7%) |
| 3-Person Households | 109 (40.7%) | 0 (0.0%) |
| 4-Person Households | 0 (0.0%) | 0 (0.0%) |
| 5-Person Households | 21 (7.8%) | 0 (0.0%) |
| 6-Person Households | 0 (0.0%) | 0 (0.0%) |
| 7+ Person Households | 0 (0.0%) | 0 (0.0%) |
| Total | 180 (67.2%) | 88 (32.8%) |
Female Fertility in Ashford
Fertility by Age in Ashford
| Age Bracket | Women with Births | Births / 1,000 Women |
| 15 to 19 years | 0 (0.0%) | 0.0 |
| 20 to 34 years | 0 (0.0%) | 0.0 |
| 35 to 50 years | 0 (0.0%) | 0.0 |
| Total | 0 (0.0%) | 0.0 |
Fertility by Age by Marriage Status in Ashford
| Age Bracket | Married | Unmarried |
| 15 to 19 years | 0 (0.0%) | 0 (0.0%) |
| 20 to 34 years | 0 (0.0%) | 0 (0.0%) |
| 35 to 50 years | 0 (0.0%) | 0 (0.0%) |
| Total | 0 (0.0%) | 0 (0.0%) |
Fertility by Education in Ashford
| Educational Attainment | Women with Births | Births / 1,000 Women |
| Less than High School | 0 (0.0%) | 0.0 |
| High School Diploma | 0 (0.0%) | 0.0 |
| College or Associate's Degree | 0 (0.0%) | 0.0 |
| Bachelor's Degree | 0 (0.0%) | 0.0 |
| Graduate Degree | 0 (0.0%) | 0.0 |
| Total | 0 (0.0%) | 0.0 |
Fertility by Education by Marriage Status in Ashford
| Educational Attainment | Married | Unmarried |
| Less than High School | 0 (0.0%) | 0 (0.0%) |
| High School Diploma | 0 (0.0%) | 0 (0.0%) |
| College or Associate's Degree | 0 (0.0%) | 0 (0.0%) |
| Bachelor's Degree | 0 (0.0%) | 0 (0.0%) |
| Graduate Degree | 0 (0.0%) | 0 (0.0%) |
| Total | 0 (0.0%) | 0 (0.0%) |
Employment Characteristics in Ashford
Employment by Class of Employer in Ashford
Among the 332 employed individuals in Ashford, private company employees (240 | 72.3%), local government employees (79 | 23.8%), and self-employed (incorporated) (13 | 3.9%) make up the most common classes of employment.
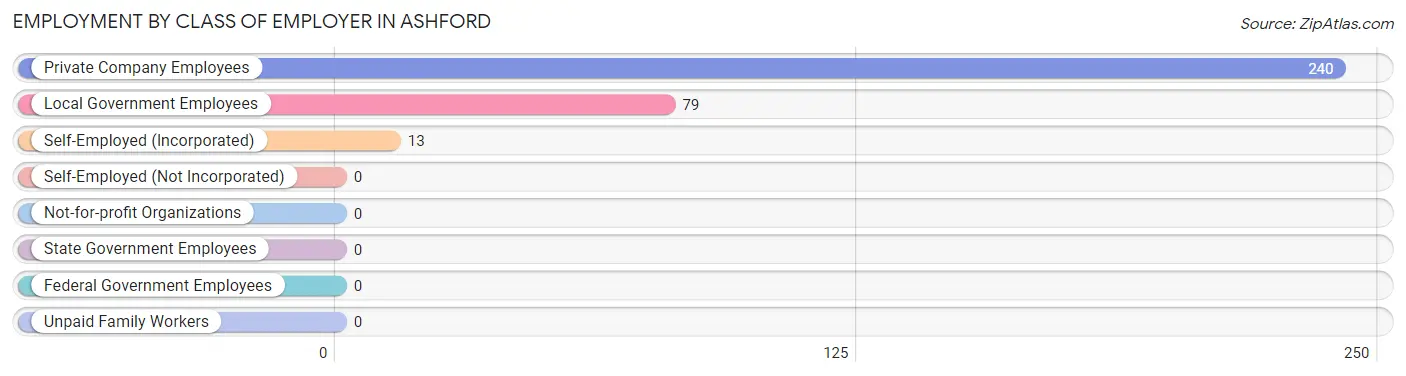
| Employer Class | # Employees | % Employees |
| Private Company Employees | 240 | 72.3% |
| Self-Employed (Incorporated) | 13 | 3.9% |
| Self-Employed (Not Incorporated) | 0 | 0.0% |
| Not-for-profit Organizations | 0 | 0.0% |
| Local Government Employees | 79 | 23.8% |
| State Government Employees | 0 | 0.0% |
| Federal Government Employees | 0 | 0.0% |
| Unpaid Family Workers | 0 | 0.0% |
| Total | 332 | 100.0% |
Employment Status by Age in Ashford
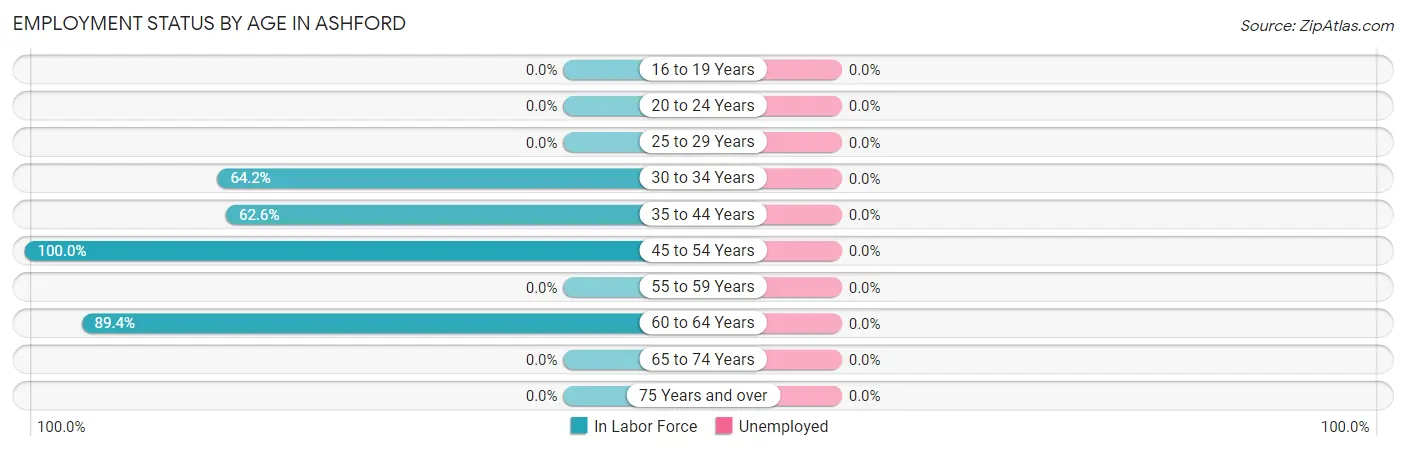
| Age Bracket | In Labor Force | Unemployed |
| 16 to 19 Years | 0 (0.0%) | 0 (0.0%) |
| 20 to 24 Years | 0 (0.0%) | 0 (0.0%) |
| 25 to 29 Years | 0 (0.0%) | 0 (0.0%) |
| 30 to 34 Years | 88 (64.2%) | 0 (0.0%) |
| 35 to 44 Years | 87 (62.6%) | 0 (0.0%) |
| 45 to 54 Years | 13 (100.0%) | 0 (0.0%) |
| 55 to 59 Years | 0 (0.0%) | 0 (0.0%) |
| 60 to 64 Years | 144 (89.4%) | 0 (0.0%) |
| 65 to 74 Years | 0 (0.0%) | 0 (0.0%) |
| 75 Years and over | 0 (0.0%) | 0 (0.0%) |
| Total | 332 (51.0%) | 0 (0.0%) |
Employment Status by Educational Attainment in Ashford
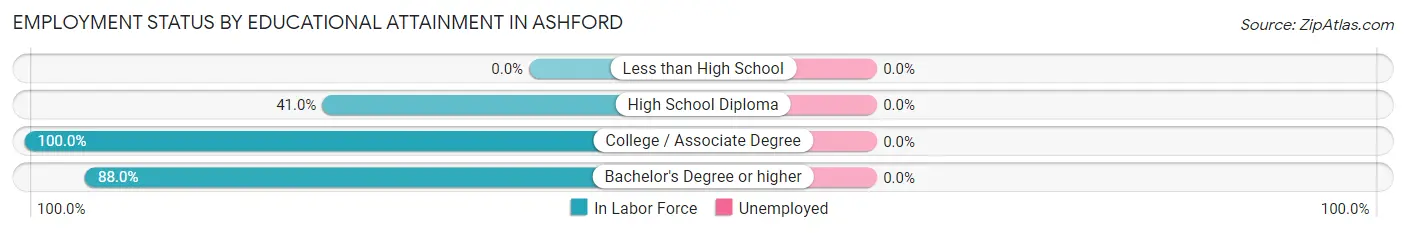
| Educational Attainment | In Labor Force | Unemployed |
| Less than High School | 0 (0.0%) | 0 (0.0%) |
| High School Diploma | 102 (41.0%) | 0 (0.0%) |
| College / Associate Degree | 105 (100.0%) | 0 (0.0%) |
| Bachelor's Degree or higher | 125 (88.0%) | 0 (0.0%) |
| Total | 332 (66.9%) | 0 (0.0%) |
Employment Occupations by Sex in Ashford
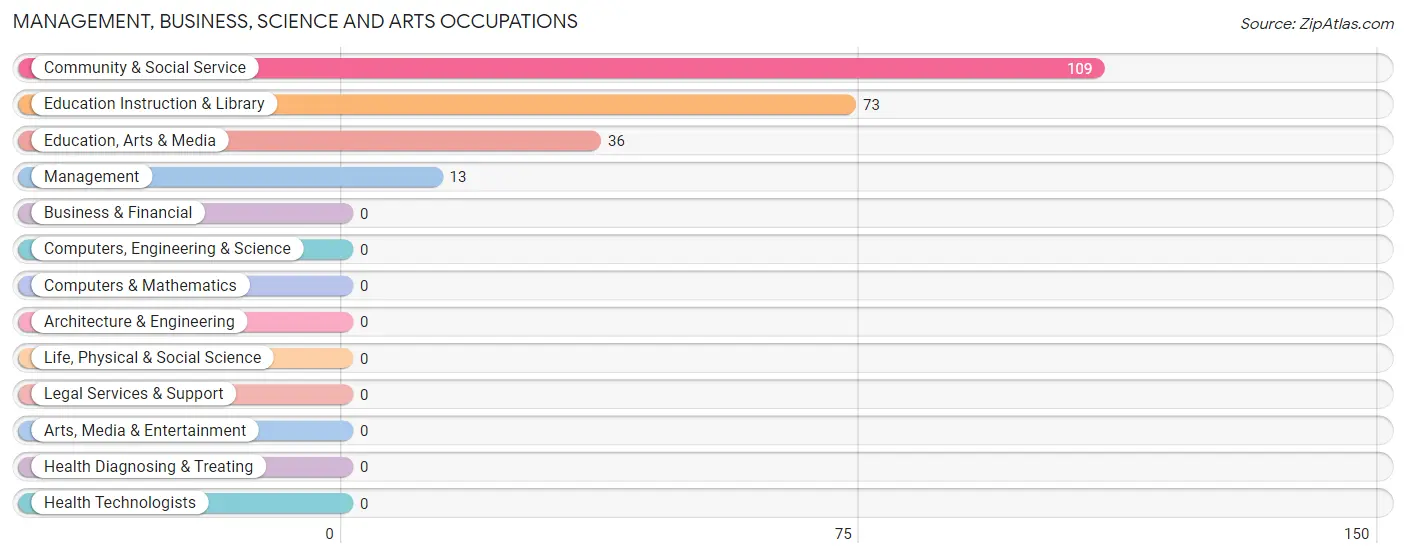
Management, Business, Science and Arts Occupations
The most common Management, Business, Science and Arts occupations in Ashford are Community & Social Service (109 | 32.8%), Education Instruction & Library (73 | 22.0%), Education, Arts & Media (36 | 10.8%), and Management (13 | 3.9%).
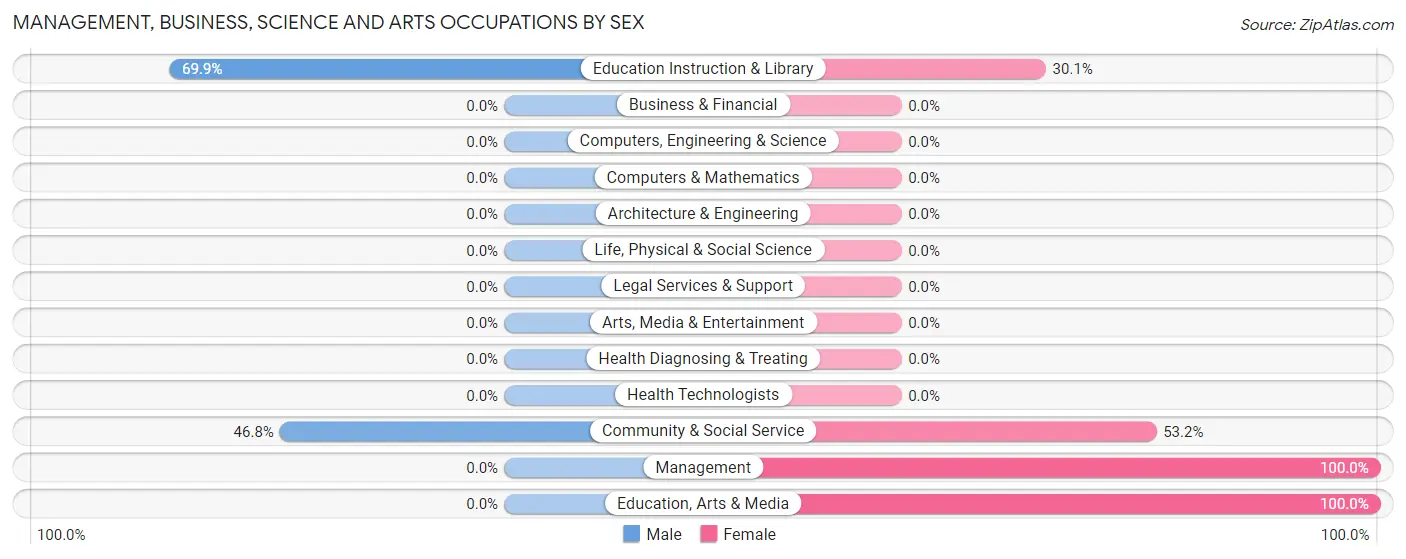
Management, Business, Science and Arts Occupations by Sex
Within the Management, Business, Science and Arts occupations in Ashford, the most male-oriented occupations are Education Instruction & Library (69.9%), and Community & Social Service (46.8%), while the most female-oriented occupations are Management (100.0%), Education, Arts & Media (100.0%), and Community & Social Service (53.2%).
| Occupation | Male | Female |
| Management | 0 (0.0%) | 13 (100.0%) |
| Business & Financial | 0 (0.0%) | 0 (0.0%) |
| Computers, Engineering & Science | 0 (0.0%) | 0 (0.0%) |
| Computers & Mathematics | 0 (0.0%) | 0 (0.0%) |
| Architecture & Engineering | 0 (0.0%) | 0 (0.0%) |
| Life, Physical & Social Science | 0 (0.0%) | 0 (0.0%) |
| Community & Social Service | 51 (46.8%) | 58 (53.2%) |
| Education, Arts & Media | 0 (0.0%) | 36 (100.0%) |
| Legal Services & Support | 0 (0.0%) | 0 (0.0%) |
| Education Instruction & Library | 51 (69.9%) | 22 (30.1%) |
| Arts, Media & Entertainment | 0 (0.0%) | 0 (0.0%) |
| Health Diagnosing & Treating | 0 (0.0%) | 0 (0.0%) |
| Health Technologists | 0 (0.0%) | 0 (0.0%) |
| Total (Category) | 51 (41.8%) | 71 (58.2%) |
| Total (Overall) | 198 (59.6%) | 134 (40.4%) |
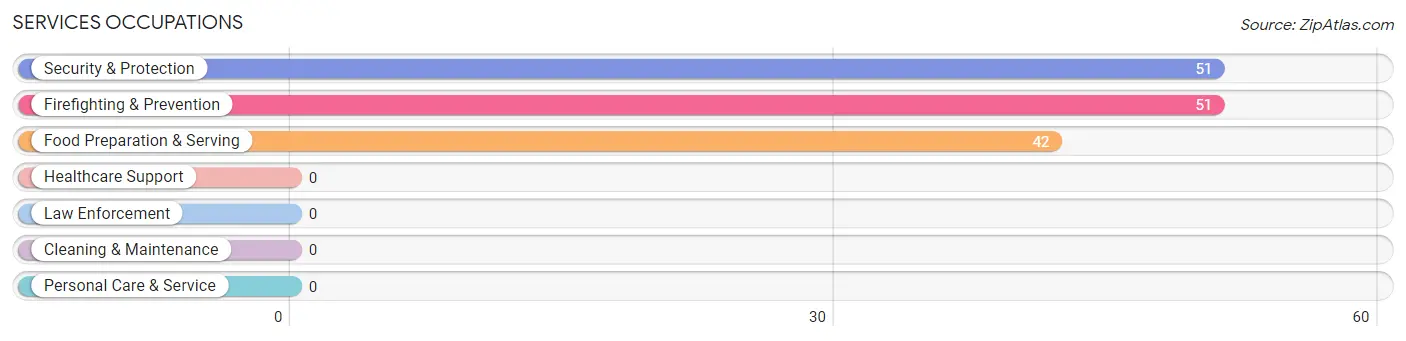
Services Occupations
The most common Services occupations in Ashford are Security & Protection (51 | 15.4%), Firefighting & Prevention (51 | 15.4%), and Food Preparation & Serving (42 | 12.7%).
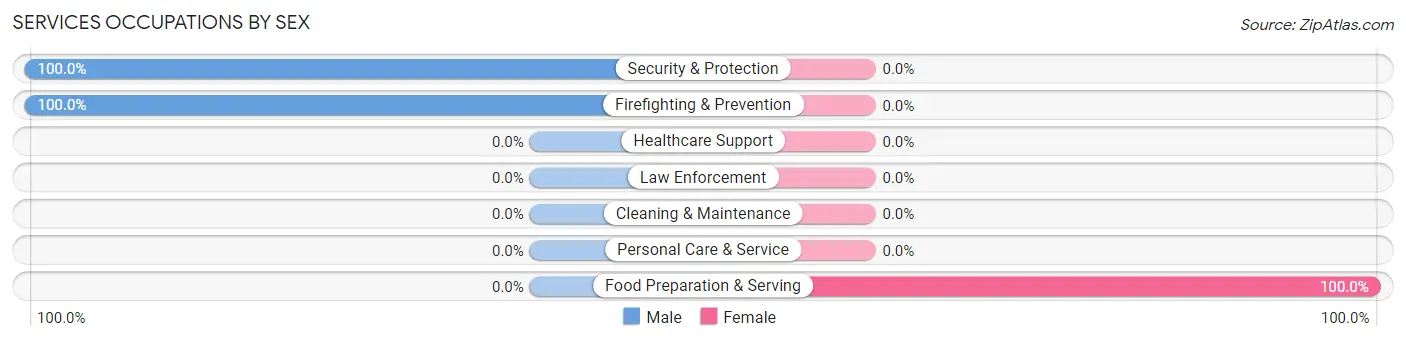
Services Occupations by Sex
| Occupation | Male | Female |
| Healthcare Support | 0 (0.0%) | 0 (0.0%) |
| Security & Protection | 51 (100.0%) | 0 (0.0%) |
| Firefighting & Prevention | 51 (100.0%) | 0 (0.0%) |
| Law Enforcement | 0 (0.0%) | 0 (0.0%) |
| Food Preparation & Serving | 0 (0.0%) | 42 (100.0%) |
| Cleaning & Maintenance | 0 (0.0%) | 0 (0.0%) |
| Personal Care & Service | 0 (0.0%) | 0 (0.0%) |
| Total (Category) | 51 (54.8%) | 42 (45.2%) |
| Total (Overall) | 198 (59.6%) | 134 (40.4%) |
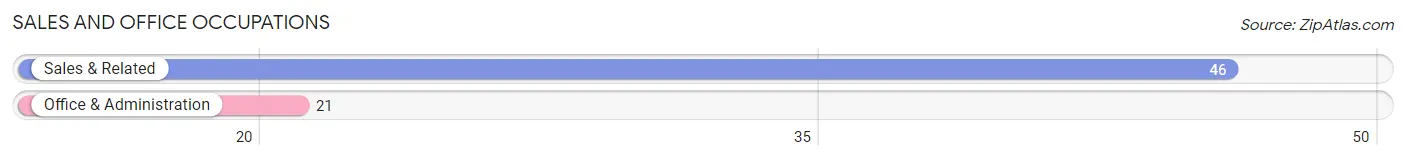
Sales and Office Occupations
The most common Sales and Office occupations in Ashford are Sales & Related (46 | 13.9%), and Office & Administration (21 | 6.3%).
Sales and Office Occupations by Sex
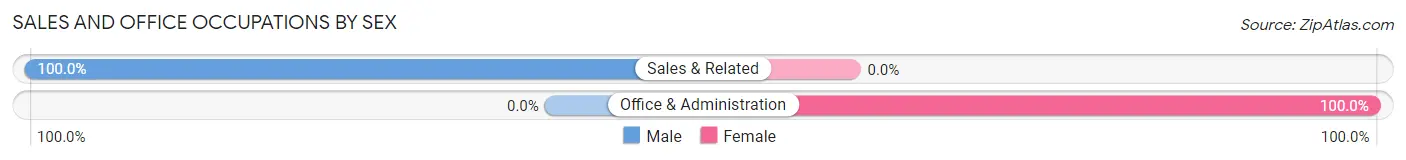
| Occupation | Male | Female |
| Sales & Related | 46 (100.0%) | 0 (0.0%) |
| Office & Administration | 0 (0.0%) | 21 (100.0%) |
| Total (Category) | 46 (68.7%) | 21 (31.3%) |
| Total (Overall) | 198 (59.6%) | 134 (40.4%) |
Natural Resources, Construction and Maintenance Occupations
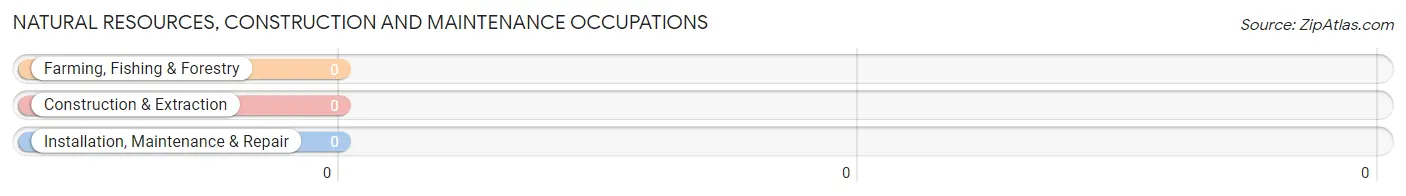
Natural Resources, Construction and Maintenance Occupations by Sex
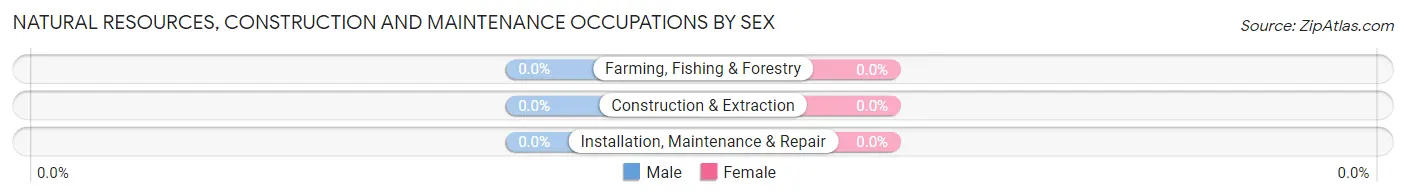
| Occupation | Male | Female |
| Farming, Fishing & Forestry | 0 (0.0%) | 0 (0.0%) |
| Construction & Extraction | 0 (0.0%) | 0 (0.0%) |
| Installation, Maintenance & Repair | 0 (0.0%) | 0 (0.0%) |
| Total (Category) | 0 (0.0%) | 0 (0.0%) |
| Total (Overall) | 198 (59.6%) | 134 (40.4%) |
Production, Transportation and Moving Occupations
The most common Production, Transportation and Moving occupations in Ashford are , and Transportation (50 | 15.1%).
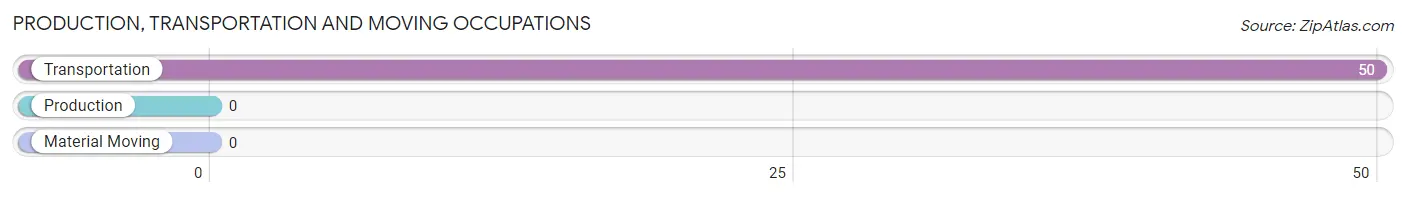
Production, Transportation and Moving Occupations by Sex
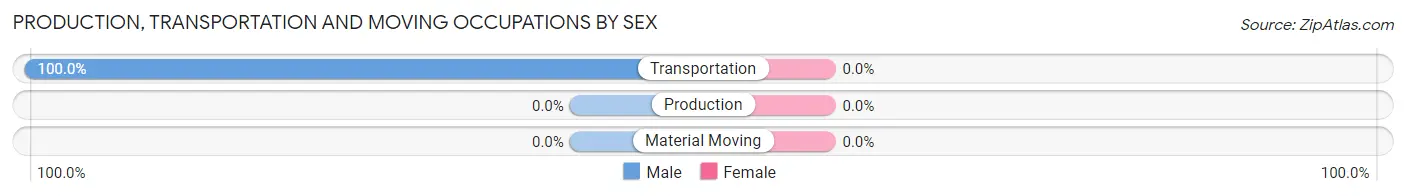
| Occupation | Male | Female |
| Production | 0 (0.0%) | 0 (0.0%) |
| Transportation | 50 (100.0%) | 0 (0.0%) |
| Material Moving | 0 (0.0%) | 0 (0.0%) |
| Total (Category) | 50 (100.0%) | 0 (0.0%) |
| Total (Overall) | 198 (59.6%) | 134 (40.4%) |
Employment Industries by Sex in Ashford
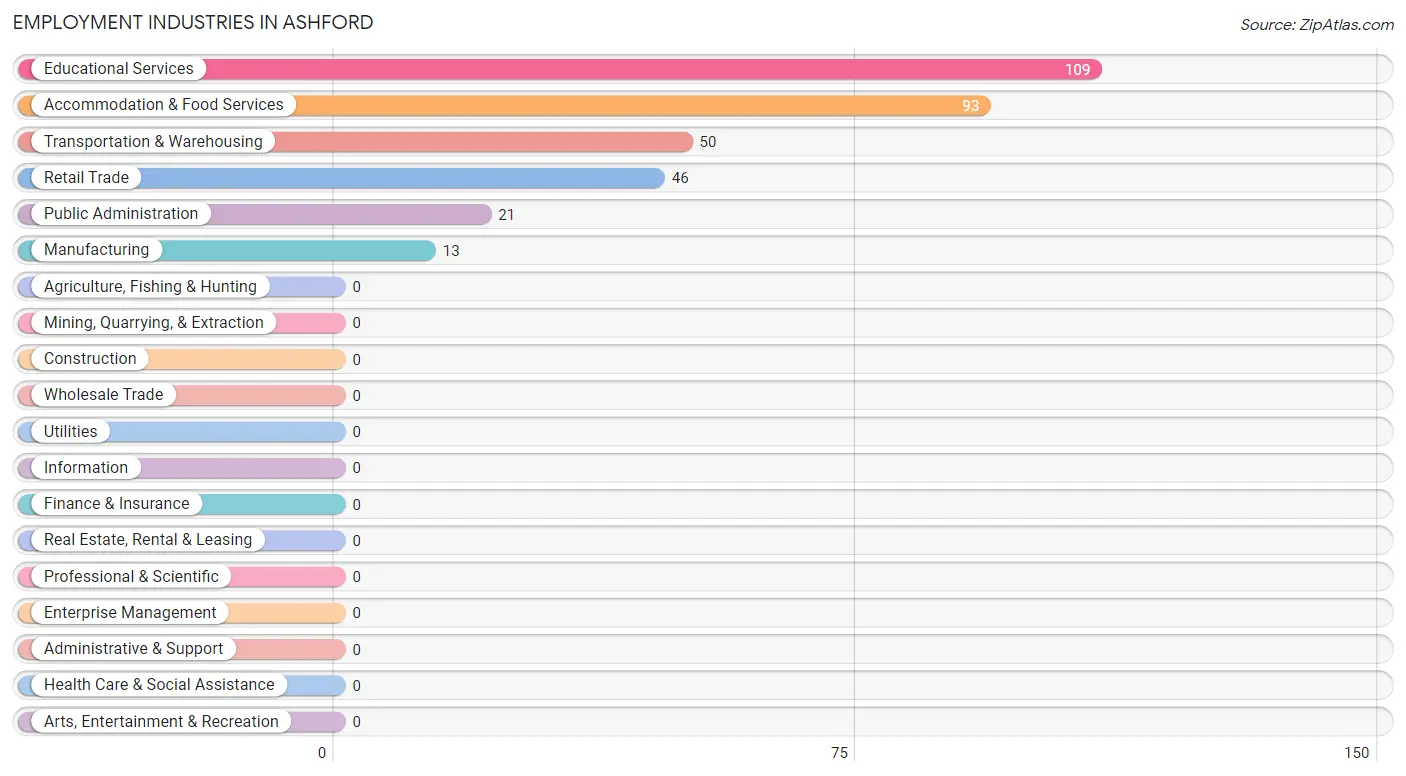
Employment Industries in Ashford
The major employment industries in Ashford include Educational Services (109 | 32.8%), Accommodation & Food Services (93 | 28.0%), Transportation & Warehousing (50 | 15.1%), Retail Trade (46 | 13.9%), and Public Administration (21 | 6.3%).
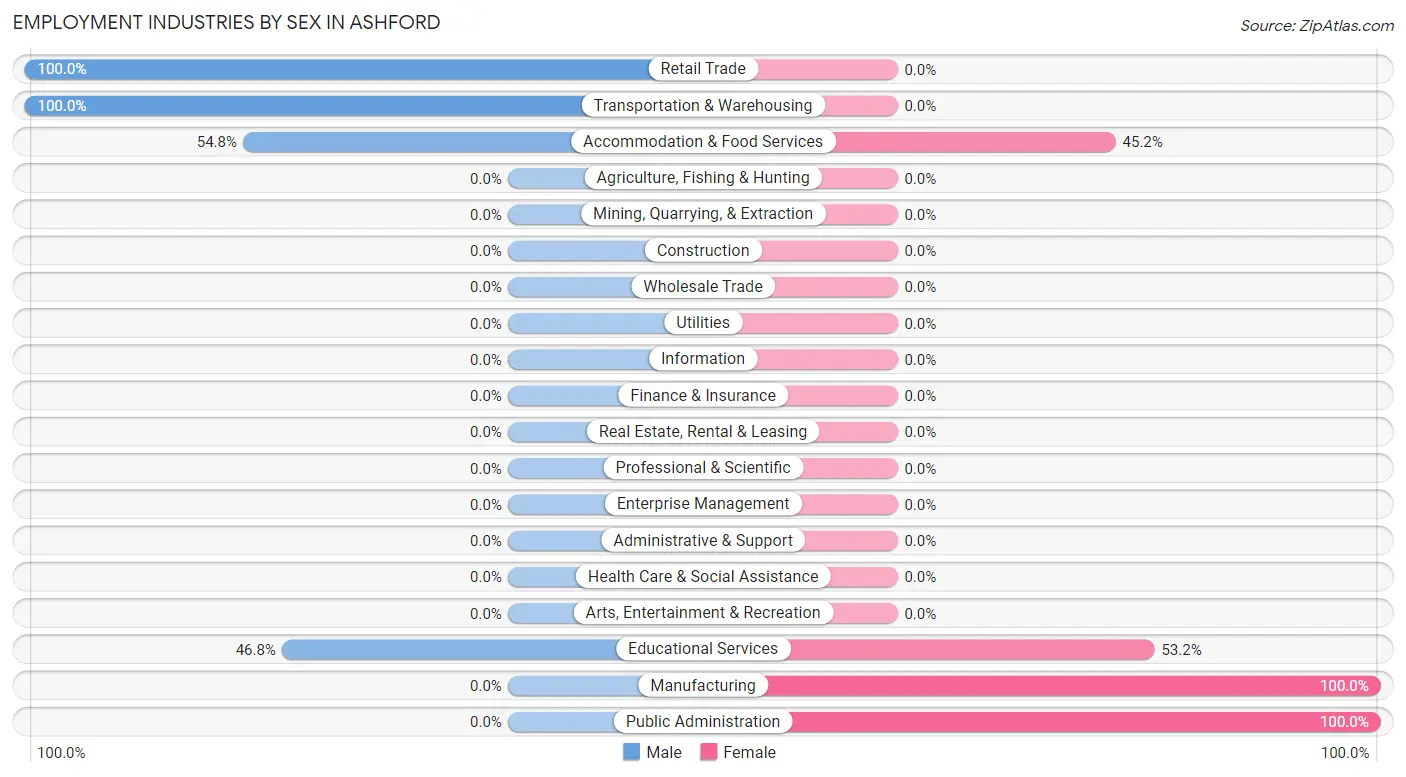
Employment Industries by Sex in Ashford
The Ashford industries that see more men than women are Retail Trade (100.0%), Transportation & Warehousing (100.0%), and Accommodation & Food Services (54.8%), whereas the industries that tend to have a higher number of women are Manufacturing (100.0%), Public Administration (100.0%), and Educational Services (53.2%).
| Industry | Male | Female |
| Agriculture, Fishing & Hunting | 0 (0.0%) | 0 (0.0%) |
| Mining, Quarrying, & Extraction | 0 (0.0%) | 0 (0.0%) |
| Construction | 0 (0.0%) | 0 (0.0%) |
| Manufacturing | 0 (0.0%) | 13 (100.0%) |
| Wholesale Trade | 0 (0.0%) | 0 (0.0%) |
| Retail Trade | 46 (100.0%) | 0 (0.0%) |
| Transportation & Warehousing | 50 (100.0%) | 0 (0.0%) |
| Utilities | 0 (0.0%) | 0 (0.0%) |
| Information | 0 (0.0%) | 0 (0.0%) |
| Finance & Insurance | 0 (0.0%) | 0 (0.0%) |
| Real Estate, Rental & Leasing | 0 (0.0%) | 0 (0.0%) |
| Professional & Scientific | 0 (0.0%) | 0 (0.0%) |
| Enterprise Management | 0 (0.0%) | 0 (0.0%) |
| Administrative & Support | 0 (0.0%) | 0 (0.0%) |
| Educational Services | 51 (46.8%) | 58 (53.2%) |
| Health Care & Social Assistance | 0 (0.0%) | 0 (0.0%) |
| Arts, Entertainment & Recreation | 0 (0.0%) | 0 (0.0%) |
| Accommodation & Food Services | 51 (54.8%) | 42 (45.2%) |
| Public Administration | 0 (0.0%) | 21 (100.0%) |
| Total | 198 (59.6%) | 134 (40.4%) |
Education in Ashford
School Enrollment in Ashford
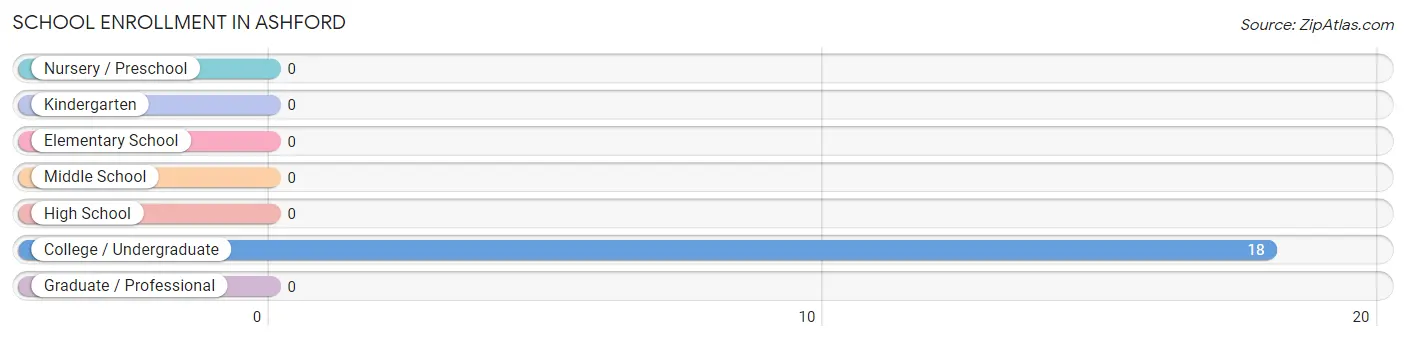
| School Level | # Students | % Students |
| Nursery / Preschool | 0 | 0.0% |
| Kindergarten | 0 | 0.0% |
| Elementary School | 0 | 0.0% |
| Middle School | 0 | 0.0% |
| High School | 0 | 0.0% |
| College / Undergraduate | 18 | 100.0% |
| Graduate / Professional | 0 | 0.0% |
| Total | 18 | 100.0% |
School Enrollment by Age by Funding Source in Ashford
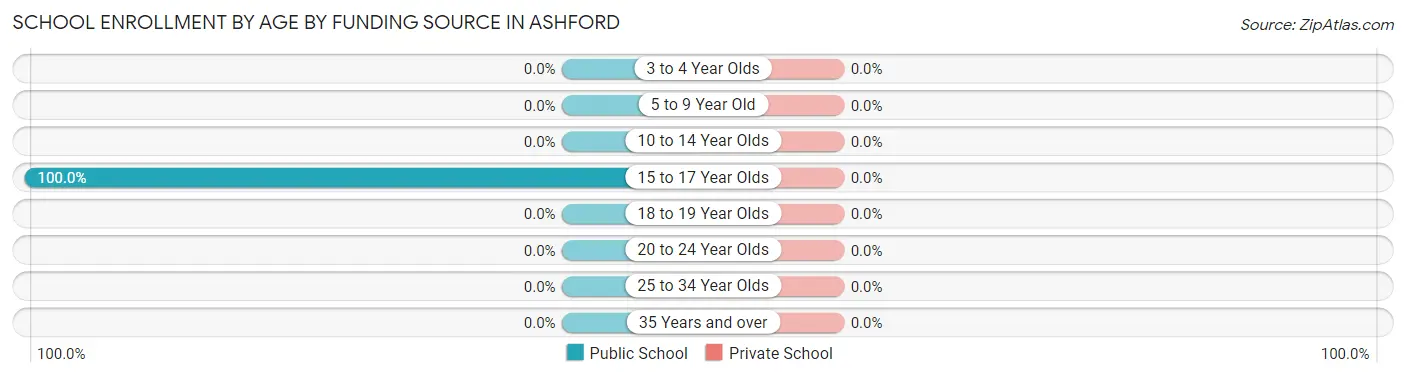
| Age Bracket | Public School | Private School |
| 3 to 4 Year Olds | 0 (0.0%) | 0 (0.0%) |
| 5 to 9 Year Old | 0 (0.0%) | 0 (0.0%) |
| 10 to 14 Year Olds | 0 (0.0%) | 0 (0.0%) |
| 15 to 17 Year Olds | 18 (100.0%) | 0 (0.0%) |
| 18 to 19 Year Olds | 0 (0.0%) | 0 (0.0%) |
| 20 to 24 Year Olds | 0 (0.0%) | 0 (0.0%) |
| 25 to 34 Year Olds | 0 (0.0%) | 0 (0.0%) |
| 35 Years and over | 0 (0.0%) | 0 (0.0%) |
| Total | 18 (100.0%) | 0 (0.0%) |
Educational Attainment by Field of Study in Ashford
Education (103 | 37.3%), business (46 | 16.7%), liberal arts & history (46 | 16.7%), social sciences (22 | 8.0%), and literature & languages (21 | 7.6%) are the most common fields of study among 276 individuals in Ashford who have obtained a bachelor's degree or higher.
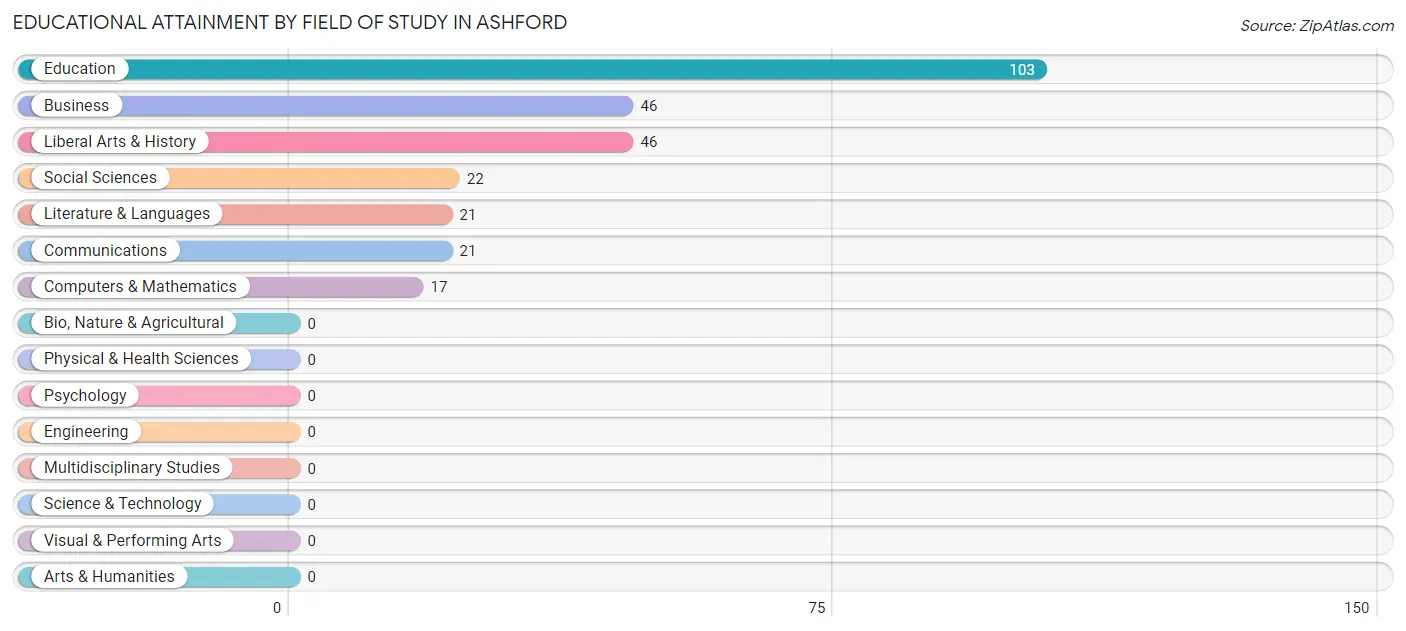
| Field of Study | # Graduates | % Graduates |
| Computers & Mathematics | 17 | 6.2% |
| Bio, Nature & Agricultural | 0 | 0.0% |
| Physical & Health Sciences | 0 | 0.0% |
| Psychology | 0 | 0.0% |
| Social Sciences | 22 | 8.0% |
| Engineering | 0 | 0.0% |
| Multidisciplinary Studies | 0 | 0.0% |
| Science & Technology | 0 | 0.0% |
| Business | 46 | 16.7% |
| Education | 103 | 37.3% |
| Literature & Languages | 21 | 7.6% |
| Liberal Arts & History | 46 | 16.7% |
| Visual & Performing Arts | 0 | 0.0% |
| Communications | 21 | 7.6% |
| Arts & Humanities | 0 | 0.0% |
| Total | 276 | 100.0% |
Transportation & Commute in Ashford
Vehicle Availability by Sex in Ashford
The most prevalent vehicle ownership categories in Ashford are males with 3 vehicles (101, accounting for 51.0%) and females with 3 vehicles (13, making up 75.4%).
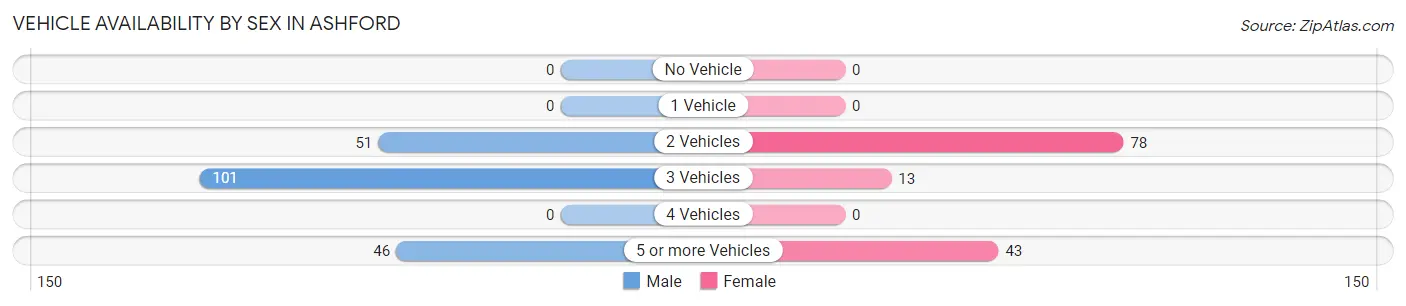
| Vehicles Available | Male | Female |
| No Vehicle | 0 (0.0%) | 0 (0.0%) |
| 1 Vehicle | 0 (0.0%) | 0 (0.0%) |
| 2 Vehicles | 51 (25.8%) | 78 (58.2%) |
| 3 Vehicles | 101 (51.0%) | 13 (9.7%) |
| 4 Vehicles | 0 (0.0%) | 0 (0.0%) |
| 5 or more Vehicles | 46 (23.2%) | 43 (32.1%) |
| Total | 198 (100.0%) | 134 (100.0%) |
Commute Time in Ashford
The most frequently occuring commute durations in Ashford are 60 to 89 minutes (102 commuters, 30.7%), 10 to 14 minutes (64 commuters, 19.3%), and 35 to 39 minutes (50 commuters, 15.1%).
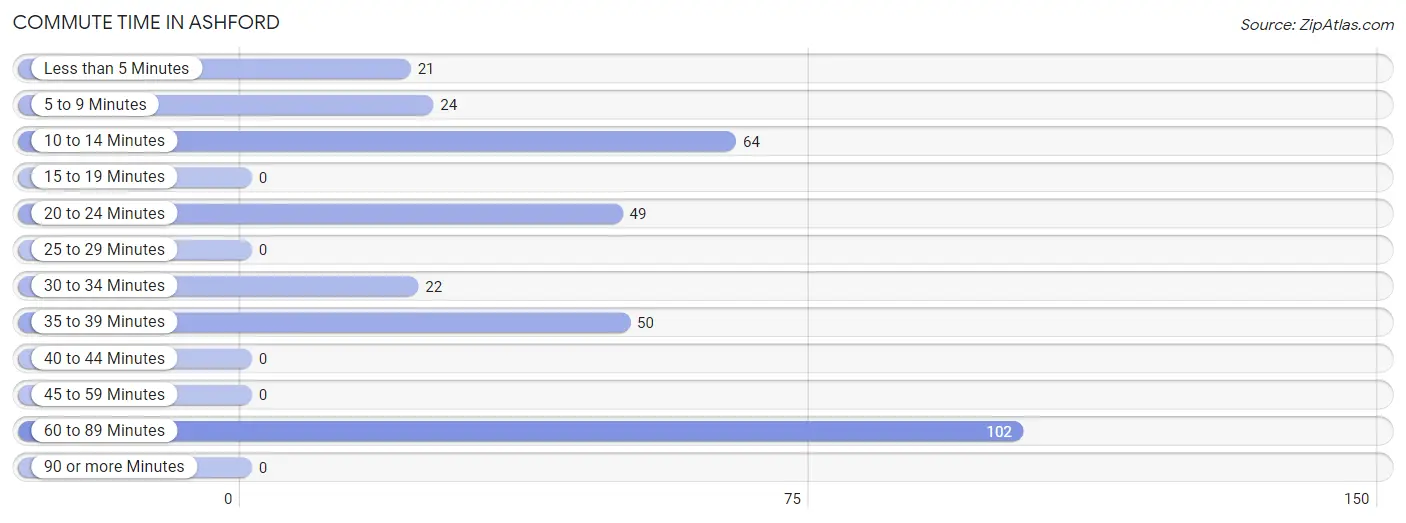
| Commute Time | # Commuters | % Commuters |
| Less than 5 Minutes | 21 | 6.3% |
| 5 to 9 Minutes | 24 | 7.2% |
| 10 to 14 Minutes | 64 | 19.3% |
| 15 to 19 Minutes | 0 | 0.0% |
| 20 to 24 Minutes | 49 | 14.8% |
| 25 to 29 Minutes | 0 | 0.0% |
| 30 to 34 Minutes | 22 | 6.6% |
| 35 to 39 Minutes | 50 | 15.1% |
| 40 to 44 Minutes | 0 | 0.0% |
| 45 to 59 Minutes | 0 | 0.0% |
| 60 to 89 Minutes | 102 | 30.7% |
| 90 or more Minutes | 0 | 0.0% |
Commute Time by Sex in Ashford
The most common commute times in Ashford are 60 to 89 minutes (102 commuters, 51.5%) for males and 20 to 24 minutes (49 commuters, 36.6%) for females.
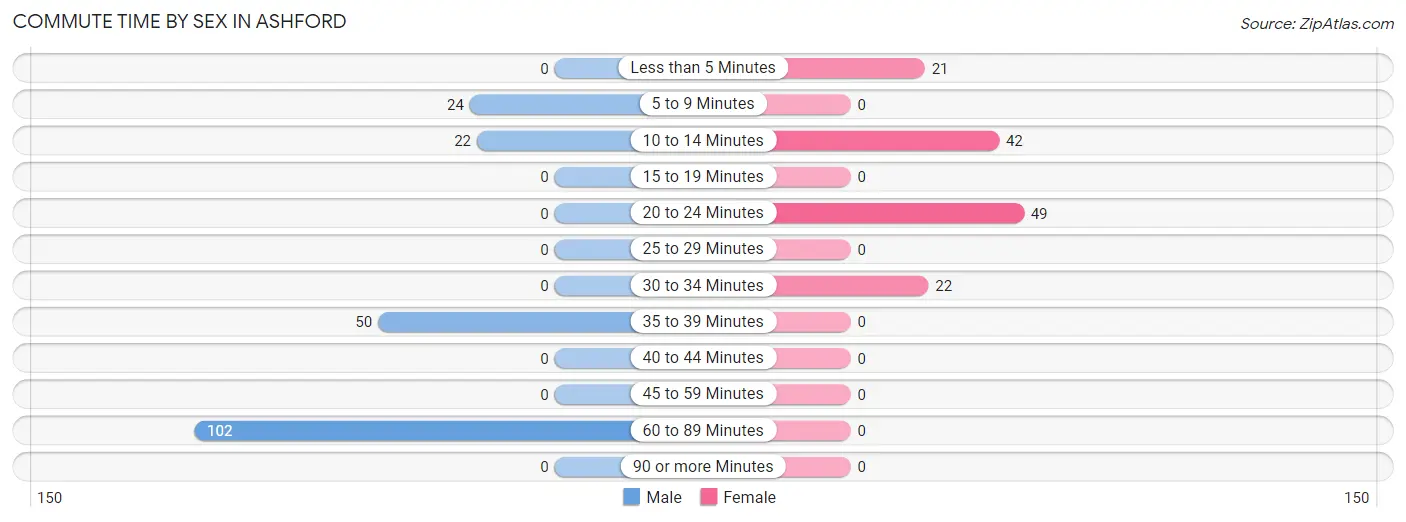
| Commute Time | Male | Female |
| Less than 5 Minutes | 0 (0.0%) | 21 (15.7%) |
| 5 to 9 Minutes | 24 (12.1%) | 0 (0.0%) |
| 10 to 14 Minutes | 22 (11.1%) | 42 (31.3%) |
| 15 to 19 Minutes | 0 (0.0%) | 0 (0.0%) |
| 20 to 24 Minutes | 0 (0.0%) | 49 (36.6%) |
| 25 to 29 Minutes | 0 (0.0%) | 0 (0.0%) |
| 30 to 34 Minutes | 0 (0.0%) | 22 (16.4%) |
| 35 to 39 Minutes | 50 (25.3%) | 0 (0.0%) |
| 40 to 44 Minutes | 0 (0.0%) | 0 (0.0%) |
| 45 to 59 Minutes | 0 (0.0%) | 0 (0.0%) |
| 60 to 89 Minutes | 102 (51.5%) | 0 (0.0%) |
| 90 or more Minutes | 0 (0.0%) | 0 (0.0%) |
Time of Departure to Work by Sex in Ashford
The most frequent times of departure to work in Ashford are 6:00 AM to 6:29 AM (51, 25.8%) for males and 6:00 AM to 6:29 AM (42, 31.3%) for females.
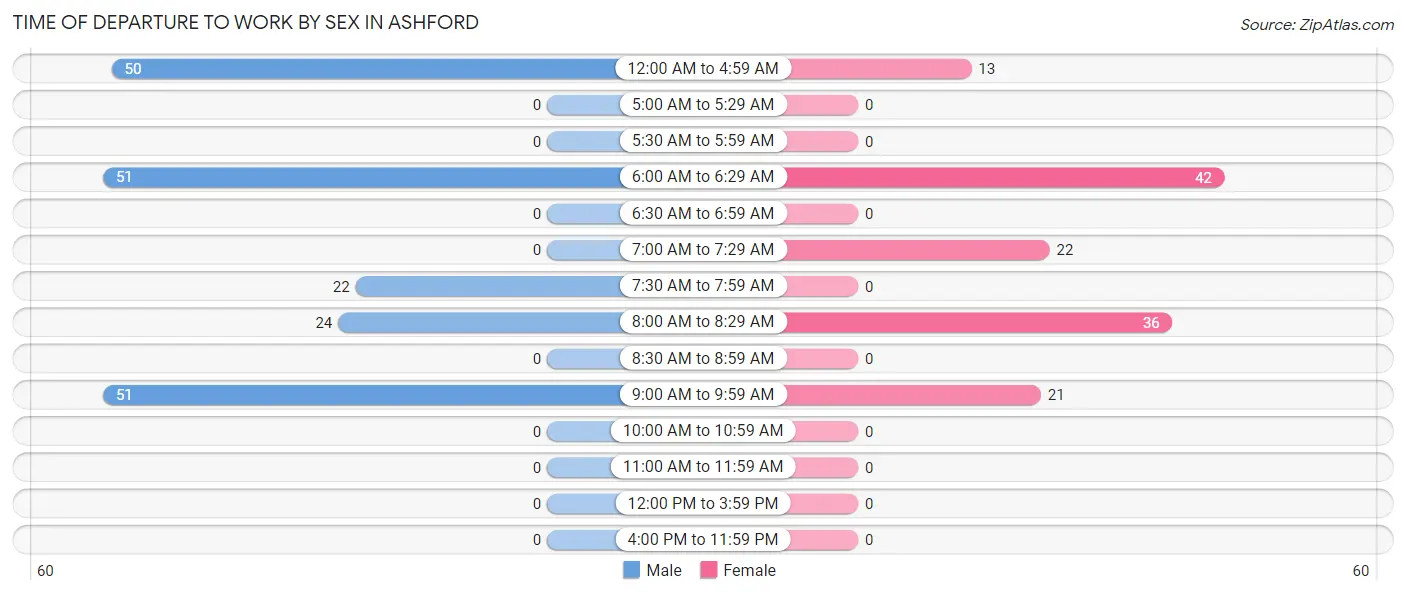
| Time of Departure | Male | Female |
| 12:00 AM to 4:59 AM | 50 (25.3%) | 13 (9.7%) |
| 5:00 AM to 5:29 AM | 0 (0.0%) | 0 (0.0%) |
| 5:30 AM to 5:59 AM | 0 (0.0%) | 0 (0.0%) |
| 6:00 AM to 6:29 AM | 51 (25.8%) | 42 (31.3%) |
| 6:30 AM to 6:59 AM | 0 (0.0%) | 0 (0.0%) |
| 7:00 AM to 7:29 AM | 0 (0.0%) | 22 (16.4%) |
| 7:30 AM to 7:59 AM | 22 (11.1%) | 0 (0.0%) |
| 8:00 AM to 8:29 AM | 24 (12.1%) | 36 (26.9%) |
| 8:30 AM to 8:59 AM | 0 (0.0%) | 0 (0.0%) |
| 9:00 AM to 9:59 AM | 51 (25.8%) | 21 (15.7%) |
| 10:00 AM to 10:59 AM | 0 (0.0%) | 0 (0.0%) |
| 11:00 AM to 11:59 AM | 0 (0.0%) | 0 (0.0%) |
| 12:00 PM to 3:59 PM | 0 (0.0%) | 0 (0.0%) |
| 4:00 PM to 11:59 PM | 0 (0.0%) | 0 (0.0%) |
| Total | 198 (100.0%) | 134 (100.0%) |
Housing Occupancy in Ashford
Occupancy by Ownership in Ashford
Of the total 268 dwellings in Ashford, owner-occupied units account for 218 (81.3%), while renter-occupied units make up 50 (18.7%).
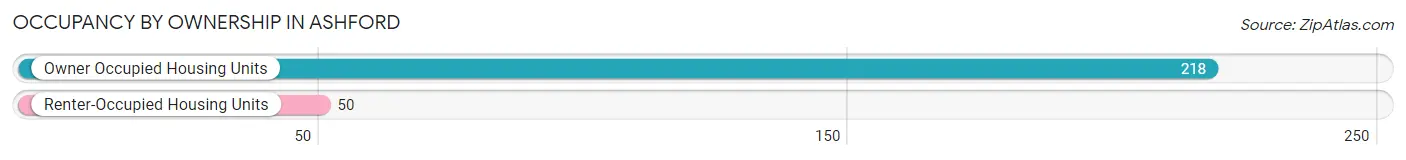
| Occupancy | # Housing Units | % Housing Units |
| Owner Occupied Housing Units | 218 | 81.3% |
| Renter-Occupied Housing Units | 50 | 18.7% |
| Total Occupied Housing Units | 268 | 100.0% |
Occupancy by Household Size in Ashford
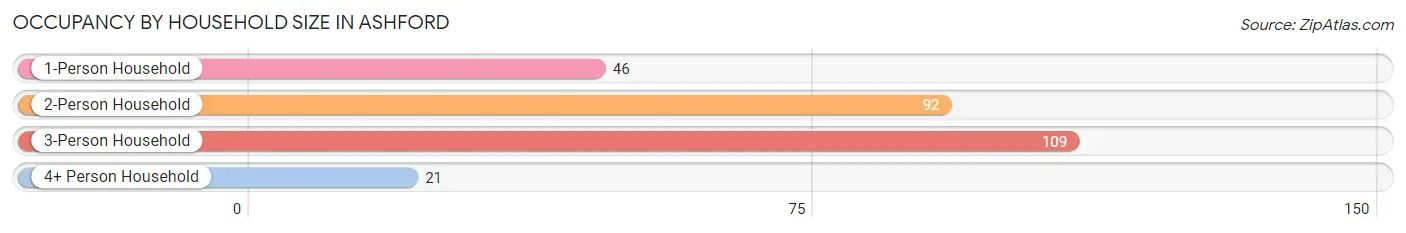
| Household Size | # Housing Units | % Housing Units |
| 1-Person Household | 46 | 17.2% |
| 2-Person Household | 92 | 34.3% |
| 3-Person Household | 109 | 40.7% |
| 4+ Person Household | 21 | 7.8% |
| Total Housing Units | 268 | 100.0% |
Occupancy by Ownership by Household Size in Ashford
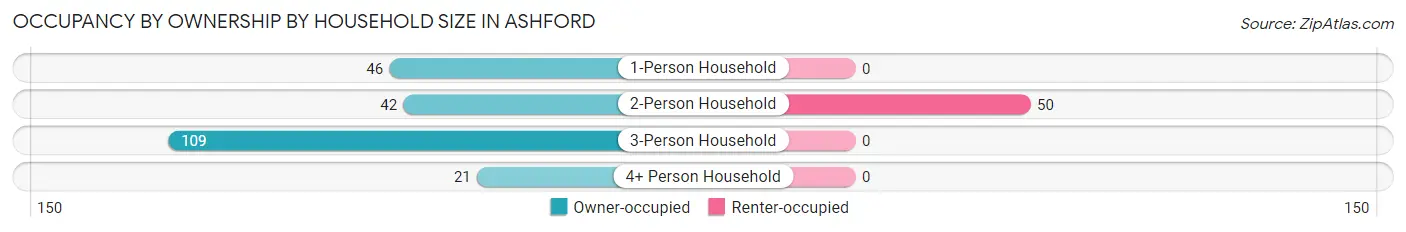
| Household Size | Owner-occupied | Renter-occupied |
| 1-Person Household | 46 (100.0%) | 0 (0.0%) |
| 2-Person Household | 42 (45.7%) | 50 (54.3%) |
| 3-Person Household | 109 (100.0%) | 0 (0.0%) |
| 4+ Person Household | 21 (100.0%) | 0 (0.0%) |
| Total Housing Units | 218 (81.3%) | 50 (18.7%) |
Occupancy by Educational Attainment in Ashford
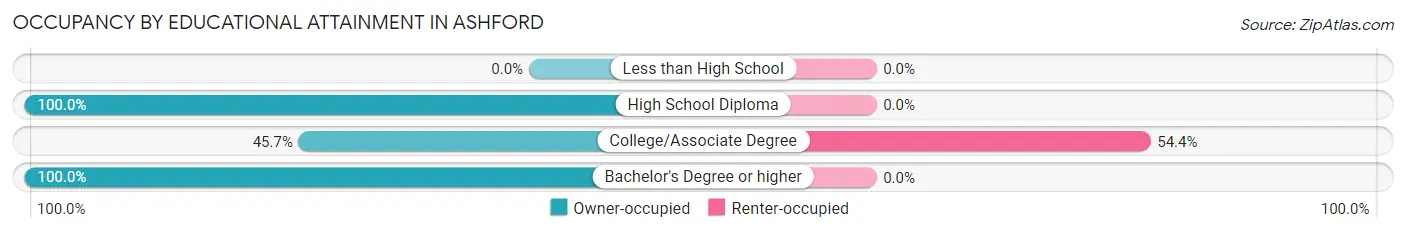
| Household Size | Owner-occupied | Renter-occupied |
| Less than High School | 0 (0.0%) | 0 (0.0%) |
| High School Diploma | 92 (100.0%) | 0 (0.0%) |
| College/Associate Degree | 42 (45.7%) | 50 (54.3%) |
| Bachelor's Degree or higher | 84 (100.0%) | 0 (0.0%) |
Occupancy by Age of Householder in Ashford
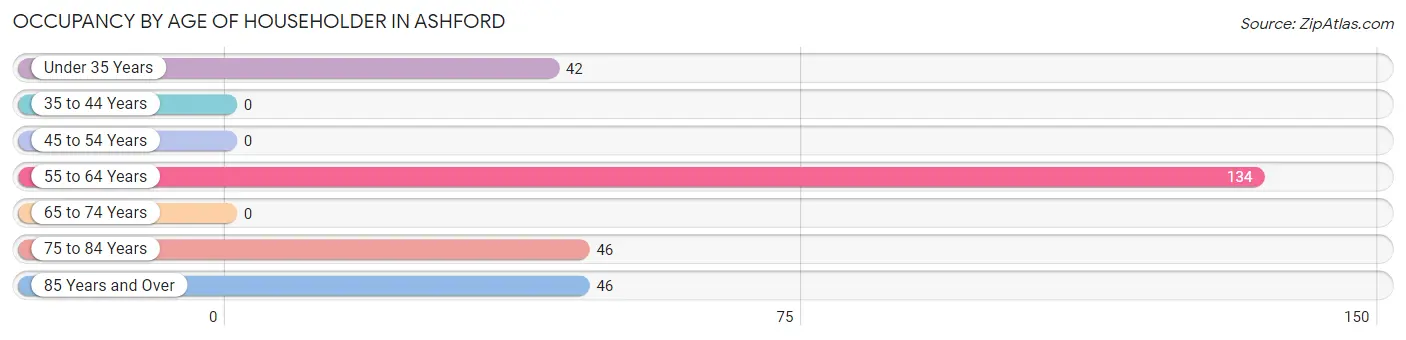
| Age Bracket | # Households | % Households |
| Under 35 Years | 42 | 15.7% |
| 35 to 44 Years | 0 | 0.0% |
| 45 to 54 Years | 0 | 0.0% |
| 55 to 64 Years | 134 | 50.0% |
| 65 to 74 Years | 0 | 0.0% |
| 75 to 84 Years | 46 | 17.2% |
| 85 Years and Over | 46 | 17.2% |
| Total | 268 | 100.0% |
Housing Finances in Ashford
Median Income by Occupancy in Ashford
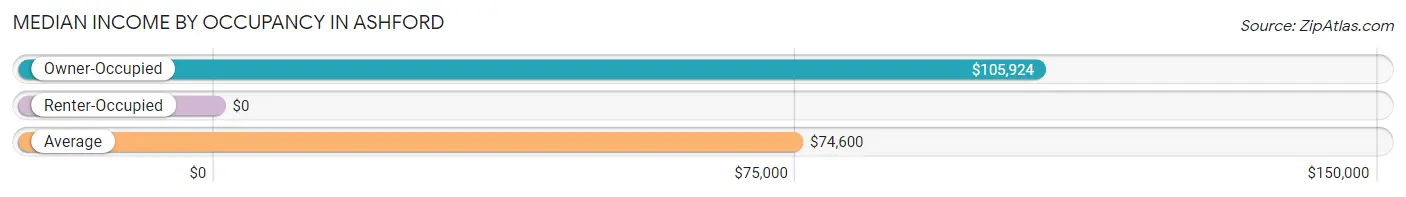
| Occupancy Type | # Households | Median Income |
| Owner-Occupied | 218 (81.3%) | $105,924 |
| Renter-Occupied | 50 (18.7%) | $0 |
| Average | 268 (100.0%) | $74,600 |
Occupancy by Householder Income Bracket in Ashford
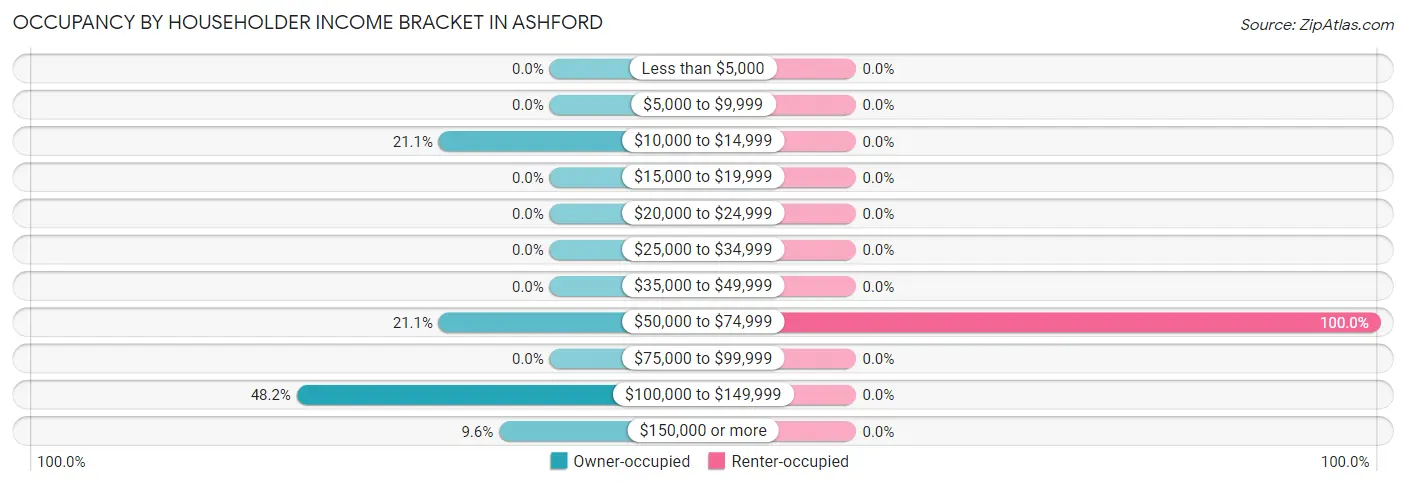
| Income Bracket | Owner-occupied | Renter-occupied |
| Less than $5,000 | 0 (0.0%) | 0 (0.0%) |
| $5,000 to $9,999 | 0 (0.0%) | 0 (0.0%) |
| $10,000 to $14,999 | 46 (21.1%) | 0 (0.0%) |
| $15,000 to $19,999 | 0 (0.0%) | 0 (0.0%) |
| $20,000 to $24,999 | 0 (0.0%) | 0 (0.0%) |
| $25,000 to $34,999 | 0 (0.0%) | 0 (0.0%) |
| $35,000 to $49,999 | 0 (0.0%) | 0 (0.0%) |
| $50,000 to $74,999 | 46 (21.1%) | 50 (100.0%) |
| $75,000 to $99,999 | 0 (0.0%) | 0 (0.0%) |
| $100,000 to $149,999 | 105 (48.2%) | 0 (0.0%) |
| $150,000 or more | 21 (9.6%) | 0 (0.0%) |
| Total | 218 (100.0%) | 50 (100.0%) |
Monthly Housing Cost Tiers in Ashford
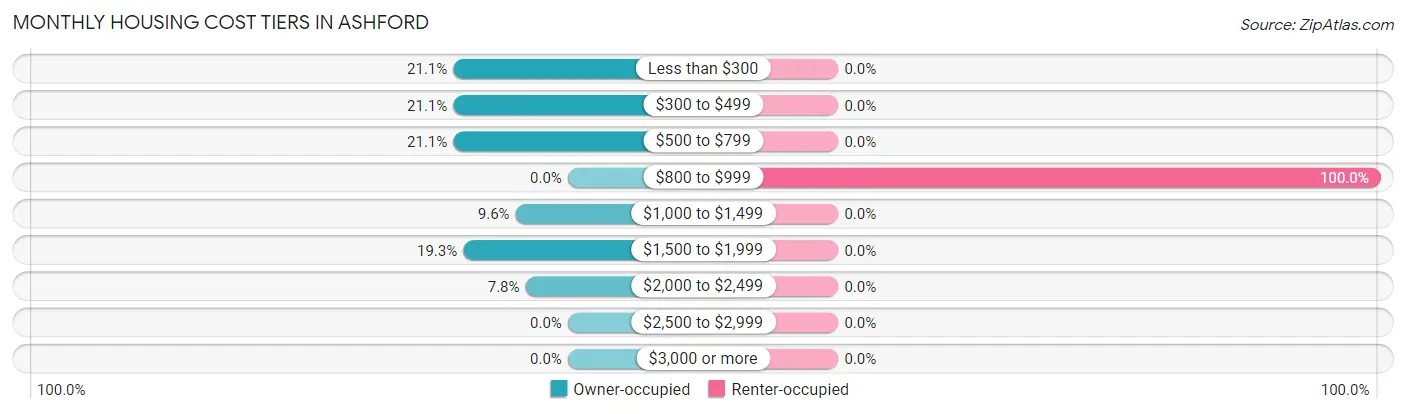
| Monthly Cost | Owner-occupied | Renter-occupied |
| Less than $300 | 46 (21.1%) | 0 (0.0%) |
| $300 to $499 | 46 (21.1%) | 0 (0.0%) |
| $500 to $799 | 46 (21.1%) | 0 (0.0%) |
| $800 to $999 | 0 (0.0%) | 50 (100.0%) |
| $1,000 to $1,499 | 21 (9.6%) | 0 (0.0%) |
| $1,500 to $1,999 | 42 (19.3%) | 0 (0.0%) |
| $2,000 to $2,499 | 17 (7.8%) | 0 (0.0%) |
| $2,500 to $2,999 | 0 (0.0%) | 0 (0.0%) |
| $3,000 or more | 0 (0.0%) | 0 (0.0%) |
| Total | 218 (100.0%) | 50 (100.0%) |
Physical Housing Characteristics in Ashford
Housing Structures in Ashford
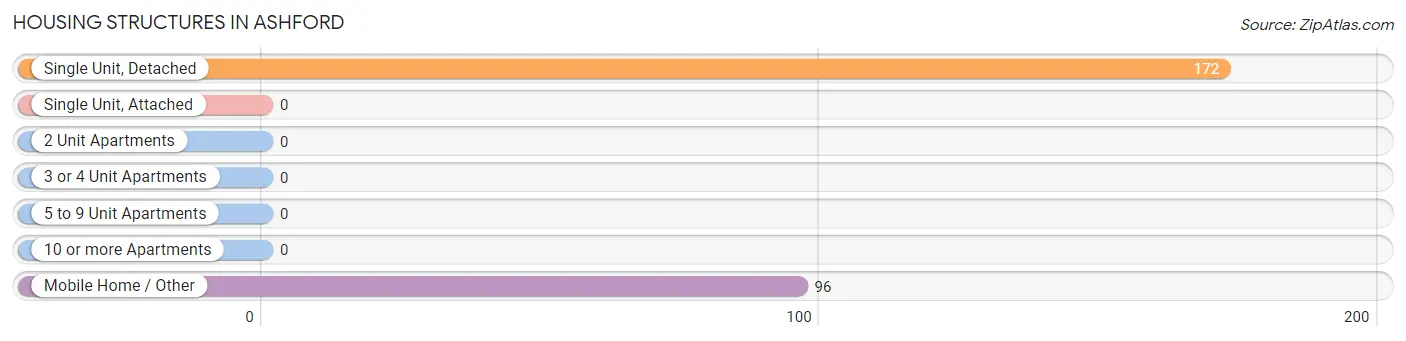
| Structure Type | # Housing Units | % Housing Units |
| Single Unit, Detached | 172 | 64.2% |
| Single Unit, Attached | 0 | 0.0% |
| 2 Unit Apartments | 0 | 0.0% |
| 3 or 4 Unit Apartments | 0 | 0.0% |
| 5 to 9 Unit Apartments | 0 | 0.0% |
| 10 or more Apartments | 0 | 0.0% |
| Mobile Home / Other | 96 | 35.8% |
| Total | 268 | 100.0% |
Housing Structures by Occupancy in Ashford
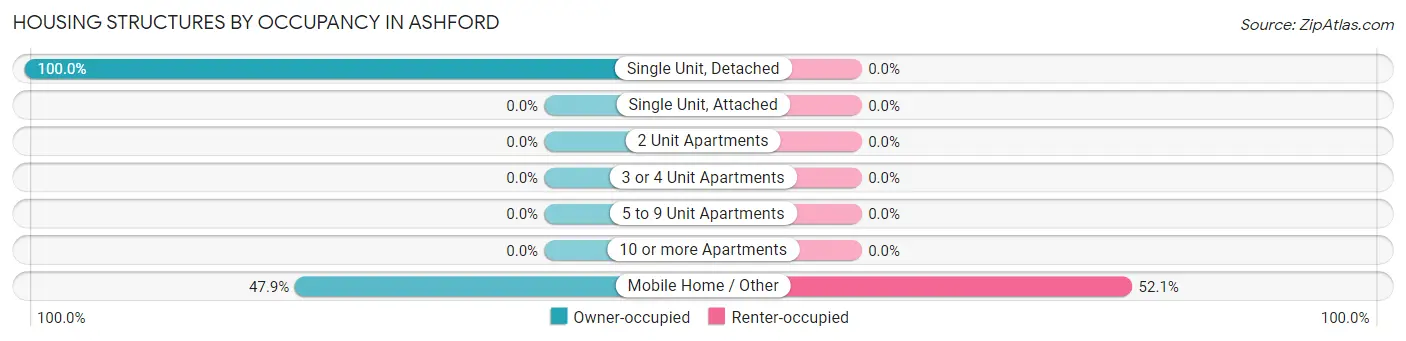
| Structure Type | Owner-occupied | Renter-occupied |
| Single Unit, Detached | 172 (100.0%) | 0 (0.0%) |
| Single Unit, Attached | 0 (0.0%) | 0 (0.0%) |
| 2 Unit Apartments | 0 (0.0%) | 0 (0.0%) |
| 3 or 4 Unit Apartments | 0 (0.0%) | 0 (0.0%) |
| 5 to 9 Unit Apartments | 0 (0.0%) | 0 (0.0%) |
| 10 or more Apartments | 0 (0.0%) | 0 (0.0%) |
| Mobile Home / Other | 46 (47.9%) | 50 (52.1%) |
| Total | 218 (81.3%) | 50 (18.7%) |
Housing Structures by Number of Rooms in Ashford
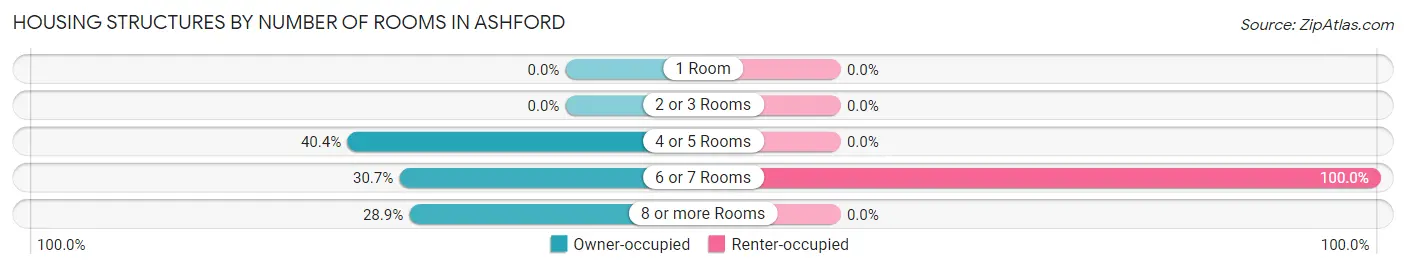
| Number of Rooms | Owner-occupied | Renter-occupied |
| 1 Room | 0 (0.0%) | 0 (0.0%) |
| 2 or 3 Rooms | 0 (0.0%) | 0 (0.0%) |
| 4 or 5 Rooms | 88 (40.4%) | 0 (0.0%) |
| 6 or 7 Rooms | 67 (30.7%) | 50 (100.0%) |
| 8 or more Rooms | 63 (28.9%) | 0 (0.0%) |
| Total | 218 (100.0%) | 50 (100.0%) |
Housing Structure by Heating Type in Ashford
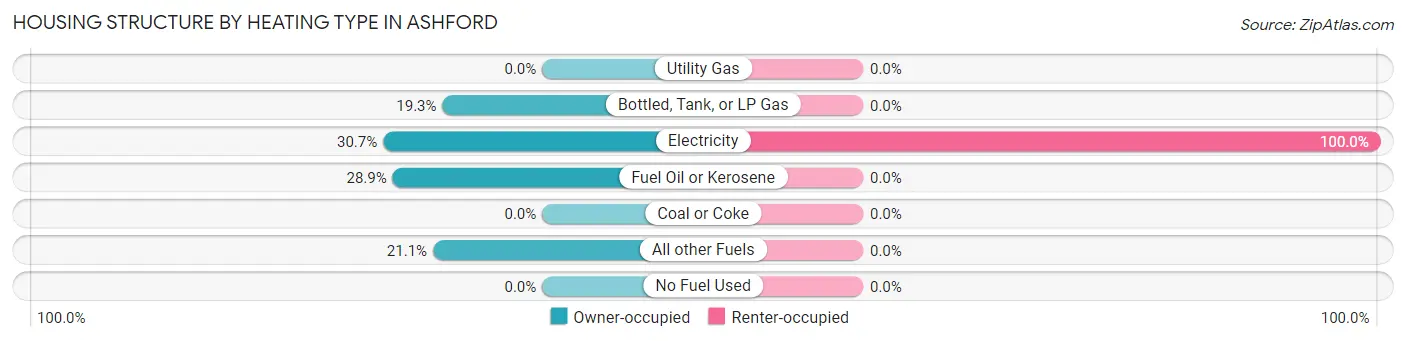
| Heating Type | Owner-occupied | Renter-occupied |
| Utility Gas | 0 (0.0%) | 0 (0.0%) |
| Bottled, Tank, or LP Gas | 42 (19.3%) | 0 (0.0%) |
| Electricity | 67 (30.7%) | 50 (100.0%) |
| Fuel Oil or Kerosene | 63 (28.9%) | 0 (0.0%) |
| Coal or Coke | 0 (0.0%) | 0 (0.0%) |
| All other Fuels | 46 (21.1%) | 0 (0.0%) |
| No Fuel Used | 0 (0.0%) | 0 (0.0%) |
| Total | 218 (100.0%) | 50 (100.0%) |
Household Vehicle Usage in Ashford
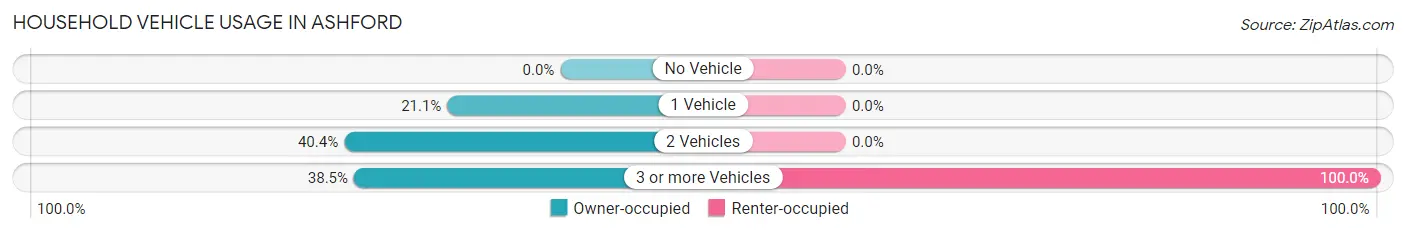
| Vehicles per Household | Owner-occupied | Renter-occupied |
| No Vehicle | 0 (0.0%) | 0 (0.0%) |
| 1 Vehicle | 46 (21.1%) | 0 (0.0%) |
| 2 Vehicles | 88 (40.4%) | 0 (0.0%) |
| 3 or more Vehicles | 84 (38.5%) | 50 (100.0%) |
| Total | 218 (100.0%) | 50 (100.0%) |
Real Estate & Mortgages in Ashford
Real Estate and Mortgage Overview in Ashford
| Characteristic | Without Mortgage | With Mortgage |
| Housing Units | 92 | 126 |
| Median Property Value | - | - |
| Median Household Income | - | - |
| Monthly Housing Costs | - | - |
| Real Estate Taxes | - | - |
Property Value by Mortgage Status in Ashford
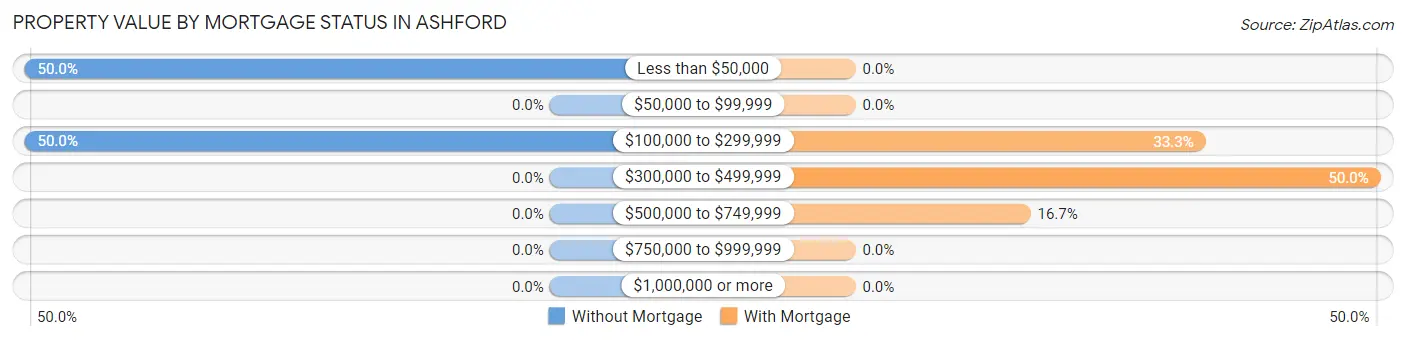
| Property Value | Without Mortgage | With Mortgage |
| Less than $50,000 | 46 (50.0%) | 0 (0.0%) |
| $50,000 to $99,999 | 0 (0.0%) | 0 (0.0%) |
| $100,000 to $299,999 | 46 (50.0%) | 42 (33.3%) |
| $300,000 to $499,999 | 0 (0.0%) | 63 (50.0%) |
| $500,000 to $749,999 | 0 (0.0%) | 21 (16.7%) |
| $750,000 to $999,999 | 0 (0.0%) | 0 (0.0%) |
| $1,000,000 or more | 0 (0.0%) | 0 (0.0%) |
| Total | 92 (100.0%) | 126 (100.0%) |
Household Income by Mortgage Status in Ashford
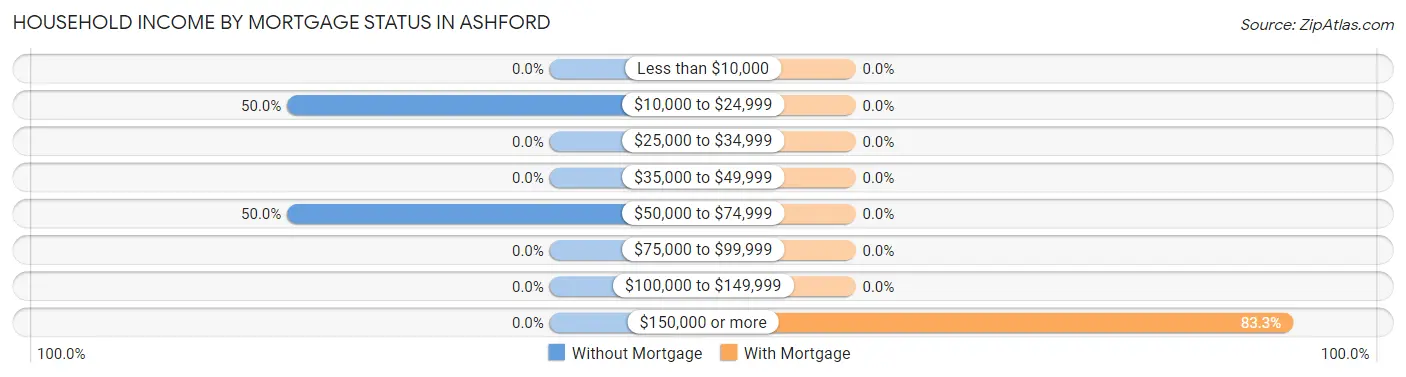
| Household Income | Without Mortgage | With Mortgage |
| Less than $10,000 | 0 (0.0%) | 0 (0.0%) |
| $10,000 to $24,999 | 46 (50.0%) | 0 (0.0%) |
| $25,000 to $34,999 | 0 (0.0%) | 0 (0.0%) |
| $35,000 to $49,999 | 0 (0.0%) | 0 (0.0%) |
| $50,000 to $74,999 | 46 (50.0%) | 0 (0.0%) |
| $75,000 to $99,999 | 0 (0.0%) | 0 (0.0%) |
| $100,000 to $149,999 | 0 (0.0%) | 0 (0.0%) |
| $150,000 or more | 0 (0.0%) | 105 (83.3%) |
| Total | 92 (100.0%) | 126 (100.0%) |
Property Value to Household Income Ratio in Ashford
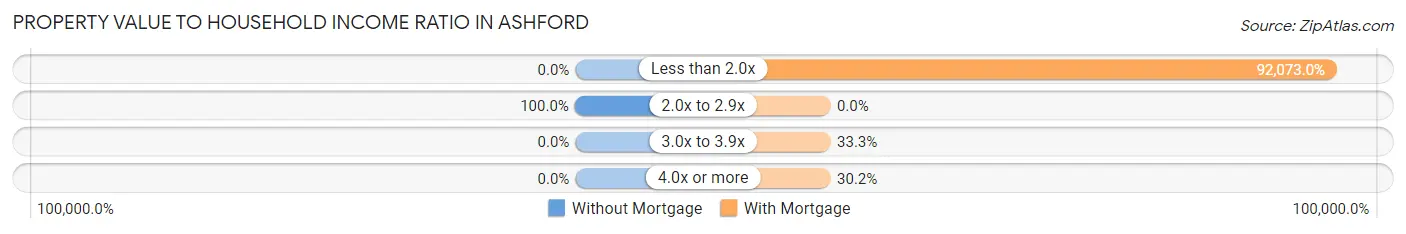
| Value-to-Income Ratio | Without Mortgage | With Mortgage |
| Less than 2.0x | 0 (0.0%) | 116,012 (92,073.0%) |
| 2.0x to 2.9x | 92 (100.0%) | 0 (0.0%) |
| 3.0x to 3.9x | 0 (0.0%) | 42 (33.3%) |
| 4.0x or more | 0 (0.0%) | 38 (30.2%) |
| Total | 92 (100.0%) | 126 (100.0%) |
Real Estate Taxes by Mortgage Status in Ashford
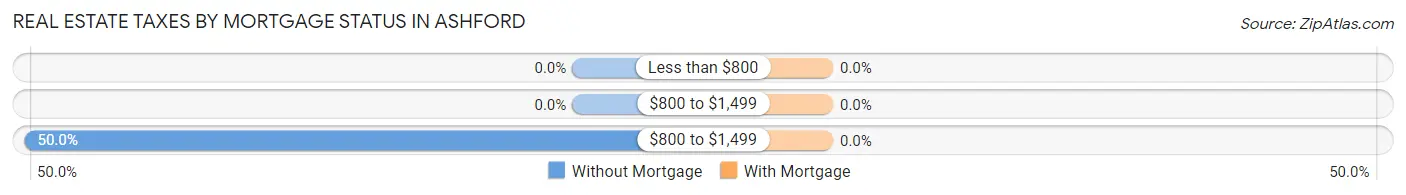
| Property Taxes | Without Mortgage | With Mortgage |
| Less than $800 | 0 (0.0%) | 0 (0.0%) |
| $800 to $1,499 | 0 (0.0%) | 0 (0.0%) |
| $800 to $1,499 | 46 (50.0%) | 0 (0.0%) |
| Total | 92 (100.0%) | 126 (100.0%) |
Health & Disability in Ashford
Health Insurance Coverage by Age in Ashford
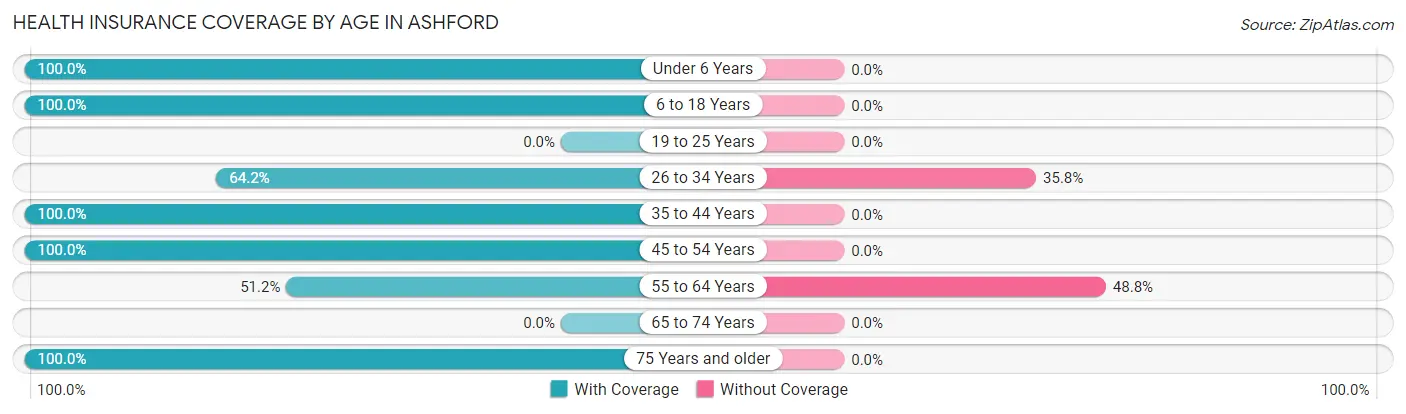
| Age Bracket | With Coverage | Without Coverage |
| Under 6 Years | 24 (100.0%) | 0 (0.0%) |
| 6 to 18 Years | 18 (100.0%) | 0 (0.0%) |
| 19 to 25 Years | 0 (0.0%) | 0 (0.0%) |
| 26 to 34 Years | 88 (64.2%) | 49 (35.8%) |
| 35 to 44 Years | 139 (100.0%) | 0 (0.0%) |
| 45 to 54 Years | 13 (100.0%) | 0 (0.0%) |
| 55 to 64 Years | 106 (51.2%) | 101 (48.8%) |
| 65 to 74 Years | 0 (0.0%) | 0 (0.0%) |
| 75 Years and older | 137 (100.0%) | 0 (0.0%) |
| Total | 525 (77.8%) | 150 (22.2%) |
Health Insurance Coverage by Citizenship Status in Ashford
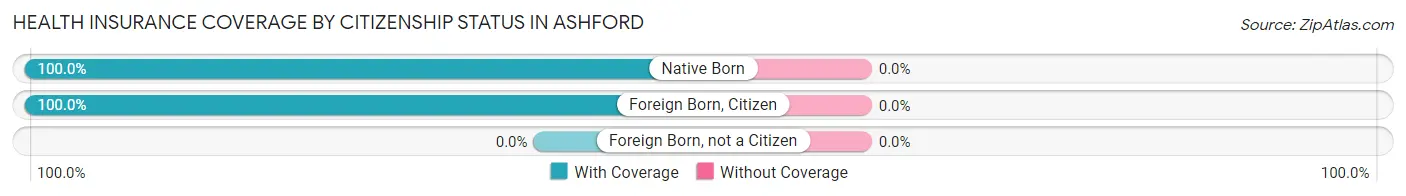
| Citizenship Status | With Coverage | Without Coverage |
| Native Born | 24 (100.0%) | 0 (0.0%) |
| Foreign Born, Citizen | 18 (100.0%) | 0 (0.0%) |
| Foreign Born, not a Citizen | 0 (0.0%) | 0 (0.0%) |
Health Insurance Coverage by Household Income in Ashford
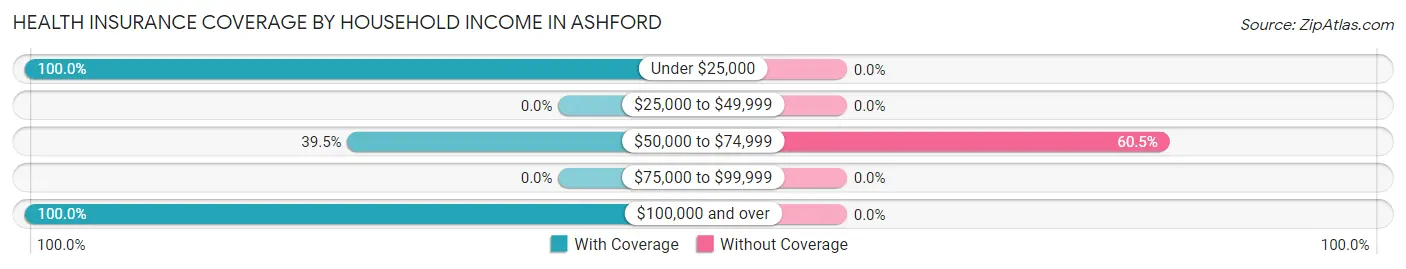
| Household Income | With Coverage | Without Coverage |
| Under $25,000 | 46 (100.0%) | 0 (0.0%) |
| $25,000 to $49,999 | 0 (0.0%) | 0 (0.0%) |
| $50,000 to $74,999 | 98 (39.5%) | 150 (60.5%) |
| $75,000 to $99,999 | 0 (0.0%) | 0 (0.0%) |
| $100,000 and over | 381 (100.0%) | 0 (0.0%) |
Public vs Private Health Insurance Coverage by Age in Ashford
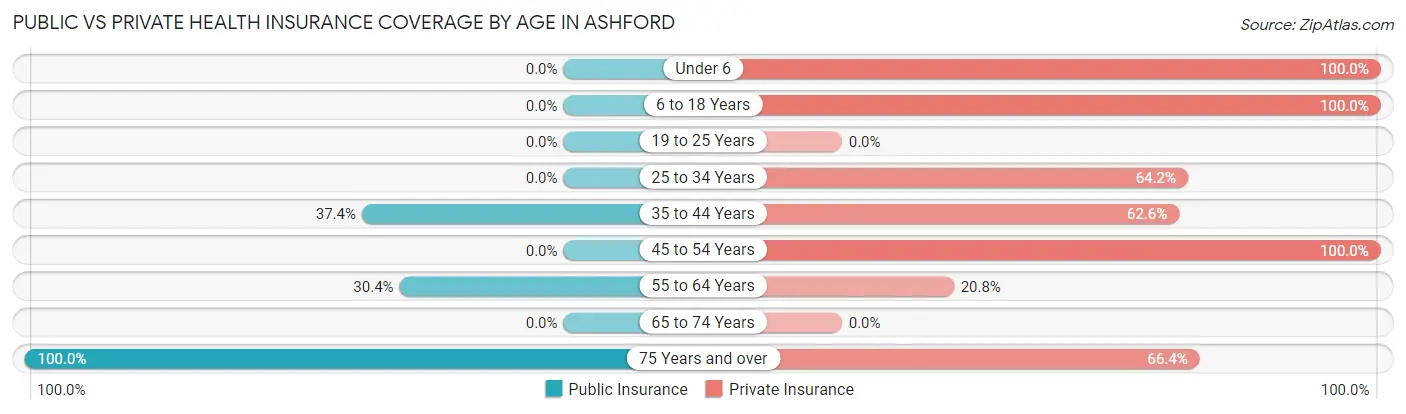
| Age Bracket | Public Insurance | Private Insurance |
| Under 6 | 0 (0.0%) | 24 (100.0%) |
| 6 to 18 Years | 0 (0.0%) | 18 (100.0%) |
| 19 to 25 Years | 0 (0.0%) | 0 (0.0%) |
| 25 to 34 Years | 0 (0.0%) | 88 (64.2%) |
| 35 to 44 Years | 52 (37.4%) | 87 (62.6%) |
| 45 to 54 Years | 0 (0.0%) | 13 (100.0%) |
| 55 to 64 Years | 63 (30.4%) | 43 (20.8%) |
| 65 to 74 Years | 0 (0.0%) | 0 (0.0%) |
| 75 Years and over | 137 (100.0%) | 91 (66.4%) |
| Total | 252 (37.3%) | 364 (53.9%) |
Disability Status by Sex by Age in Ashford
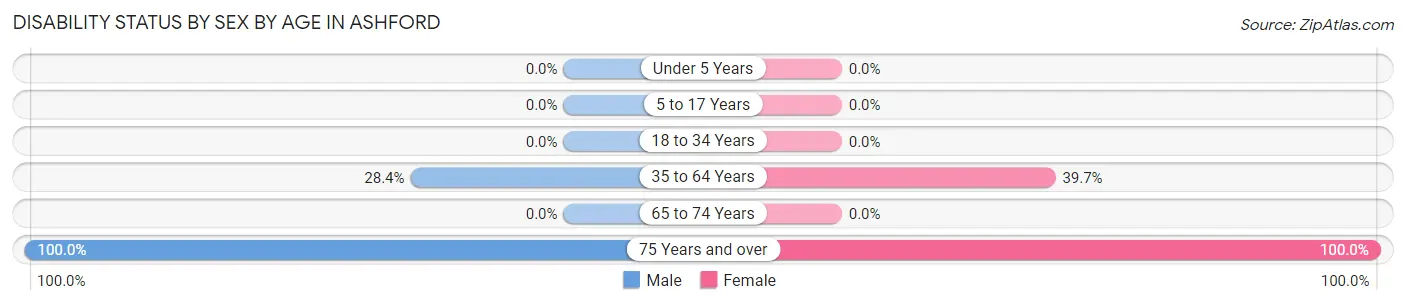
| Age Bracket | Male | Female |
| Under 5 Years | 0 (0.0%) | 0 (0.0%) |
| 5 to 17 Years | 0 (0.0%) | 0 (0.0%) |
| 18 to 34 Years | 0 (0.0%) | 0 (0.0%) |
| 35 to 64 Years | 69 (28.4%) | 46 (39.7%) |
| 65 to 74 Years | 0 (0.0%) | 0 (0.0%) |
| 75 Years and over | 92 (100.0%) | 45 (100.0%) |
Disability Class by Sex by Age in Ashford
Disability Class: Hearing Difficulty
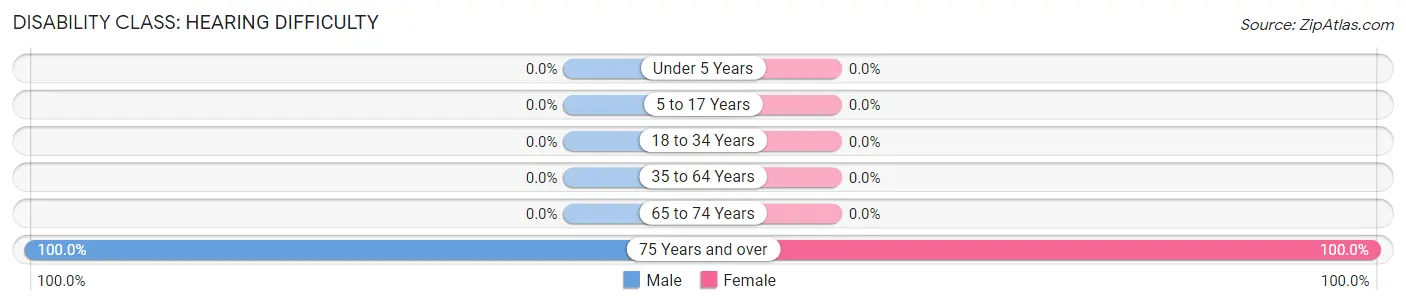
| Age Bracket | Male | Female |
| Under 5 Years | 0 (0.0%) | 0 (0.0%) |
| 5 to 17 Years | 0 (0.0%) | 0 (0.0%) |
| 18 to 34 Years | 0 (0.0%) | 0 (0.0%) |
| 35 to 64 Years | 0 (0.0%) | 0 (0.0%) |
| 65 to 74 Years | 0 (0.0%) | 0 (0.0%) |
| 75 Years and over | 92 (100.0%) | 45 (100.0%) |
Disability Class: Vision Difficulty
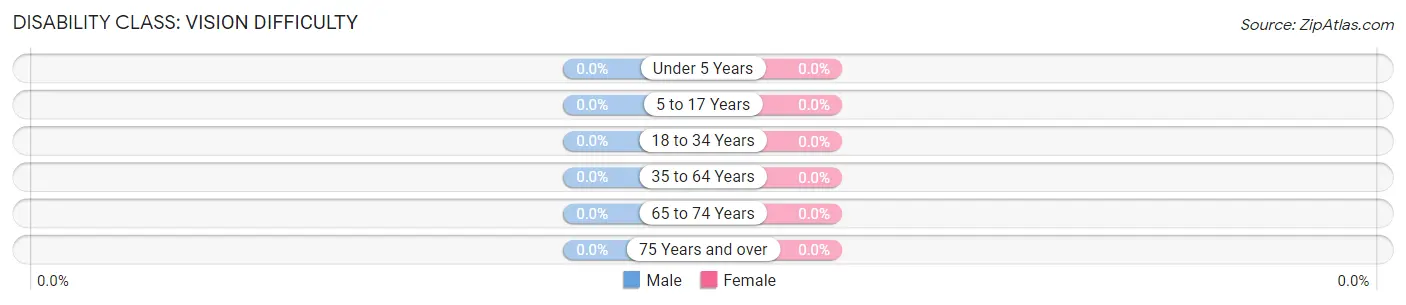
| Age Bracket | Male | Female |
| Under 5 Years | 0 (0.0%) | 0 (0.0%) |
| 5 to 17 Years | 0 (0.0%) | 0 (0.0%) |
| 18 to 34 Years | 0 (0.0%) | 0 (0.0%) |
| 35 to 64 Years | 0 (0.0%) | 0 (0.0%) |
| 65 to 74 Years | 0 (0.0%) | 0 (0.0%) |
| 75 Years and over | 0 (0.0%) | 0 (0.0%) |
Disability Class: Cognitive Difficulty
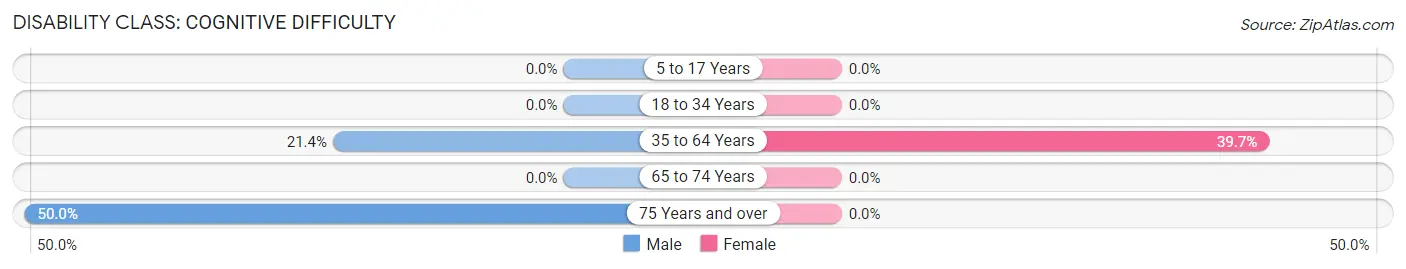
| Age Bracket | Male | Female |
| 5 to 17 Years | 0 (0.0%) | 0 (0.0%) |
| 18 to 34 Years | 0 (0.0%) | 0 (0.0%) |
| 35 to 64 Years | 52 (21.4%) | 46 (39.7%) |
| 65 to 74 Years | 0 (0.0%) | 0 (0.0%) |
| 75 Years and over | 46 (50.0%) | 0 (0.0%) |
Disability Class: Ambulatory Difficulty
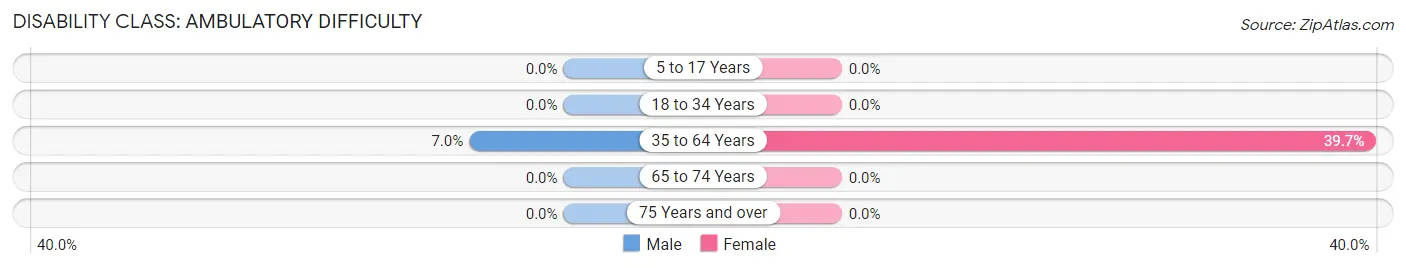
| Age Bracket | Male | Female |
| 5 to 17 Years | 0 (0.0%) | 0 (0.0%) |
| 18 to 34 Years | 0 (0.0%) | 0 (0.0%) |
| 35 to 64 Years | 17 (7.0%) | 46 (39.7%) |
| 65 to 74 Years | 0 (0.0%) | 0 (0.0%) |
| 75 Years and over | 0 (0.0%) | 0 (0.0%) |
Disability Class: Self-Care Difficulty
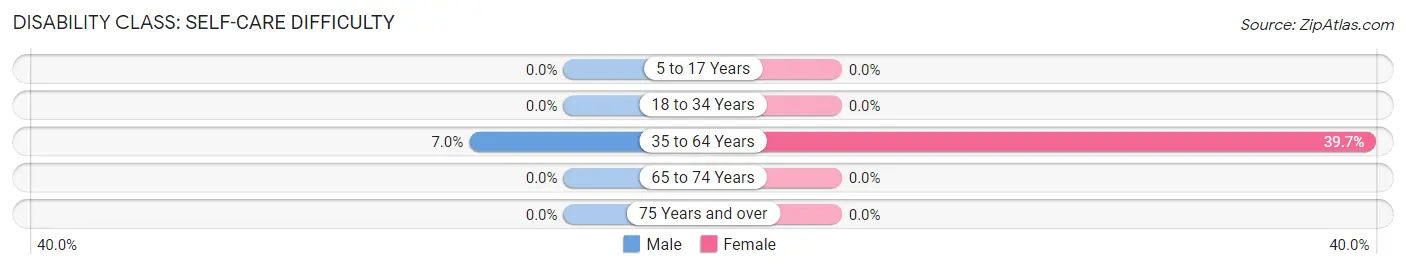
| Age Bracket | Male | Female |
| 5 to 17 Years | 0 (0.0%) | 0 (0.0%) |
| 18 to 34 Years | 0 (0.0%) | 0 (0.0%) |
| 35 to 64 Years | 17 (7.0%) | 46 (39.7%) |
| 65 to 74 Years | 0 (0.0%) | 0 (0.0%) |
| 75 Years and over | 0 (0.0%) | 0 (0.0%) |
Technology Access in Ashford
Computing Device Access in Ashford
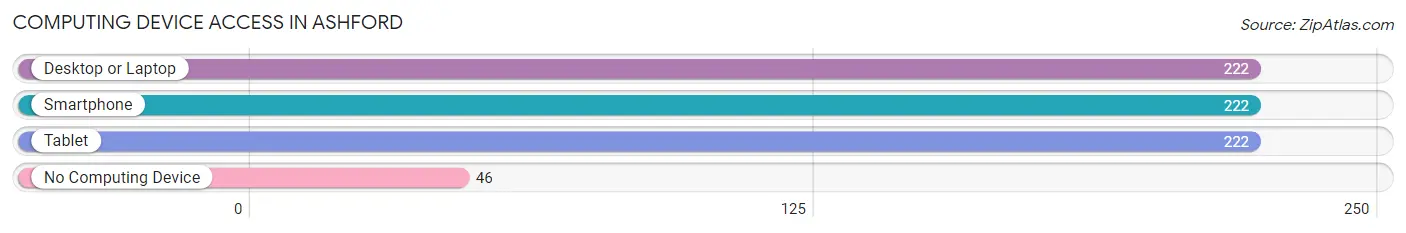
| Device Type | # Households | % Households |
| Desktop or Laptop | 222 | 82.8% |
| Smartphone | 222 | 82.8% |
| Tablet | 222 | 82.8% |
| No Computing Device | 46 | 17.2% |
| Total | 268 | 100.0% |
Internet Access in Ashford
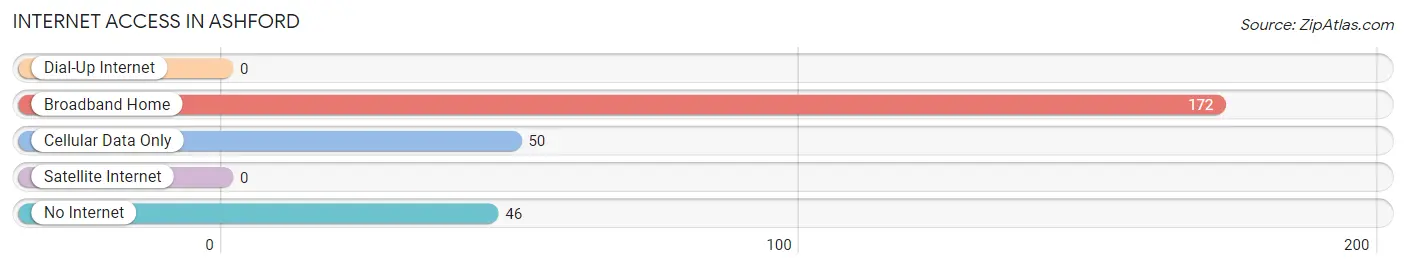
| Internet Type | # Households | % Households |
| Dial-Up Internet | 0 | 0.0% |
| Broadband Home | 172 | 64.2% |
| Cellular Data Only | 50 | 18.7% |
| Satellite Internet | 0 | 0.0% |
| No Internet | 46 | 17.2% |
| Total | 268 | 100.0% |
Ashford Summary
Ashford, Washington is a small town located in the Cascade Mountains of Pierce County, Washington. It is situated at the base of Mount Rainier, the highest peak in the Cascade Range. The town is located on the Nisqually River, which flows through the area and is a popular destination for fishing and rafting. The population of Ashford was 1,092 at the 2010 census.
History
The area that is now Ashford was first settled in the late 1800s by homesteaders. The town was originally known as Nisqually Flats, but was later renamed Ashford in honor of the first postmaster, William Ashford. The town was officially incorporated in 1909.
In the early 1900s, the town was a popular destination for tourists, who came to enjoy the scenery and outdoor activities. The town was also home to several logging camps, which provided employment for many of the town’s residents.
Geography
Ashford is located in the Cascade Mountains of Pierce County, Washington. It is situated at the base of Mount Rainier, the highest peak in the Cascade Range. The town is located on the Nisqually River, which flows through the area and is a popular destination for fishing and rafting.
The town is surrounded by forests and mountains, and is home to several parks and trails. The nearby Mount Rainier National Park is a popular destination for hikers and campers.
Economy
The economy of Ashford is largely based on tourism. The town is a popular destination for outdoor enthusiasts, who come to enjoy the scenery and activities such as fishing, rafting, and hiking. The town is also home to several small businesses, including restaurants, shops, and lodging.
Demographics
As of the 2010 census, the population of Ashford was 1,092. The racial makeup of the town was 94.2% White, 0.7% African American, 0.7% Native American, 0.7% Asian, 0.1% Pacific Islander, 0.7% from other races, and 2.7% from two or more races. Hispanic or Latino of any race were 3.3% of the population.
The median income for a household in the town was $41,250, and the median income for a family was $50,000. The per capita income for the town was $20,945. About 10.2% of families and 14.2% of the population were below the poverty line, including 18.2% of those under age 18 and 8.3% of those age 65 or over.
Common Questions
What is Per Capita Income in Ashford?
Per Capita income in Ashford is $32,951.
What is the Median Family Income in Ashford?
Median Family Income in Ashford is $74,700.
What is the Median Household income in Ashford?
Median Household Income in Ashford is $74,600.
What is Income or Wage Gap in Ashford?
Income or Wage Gap in Ashford is 51.0%.
Women in Ashford earn 49.0 cents for every dollar earned by a man.
What is Inequality or Gini Index in Ashford?
Inequality or Gini Index in Ashford is 0.31.
What is the Total Population of Ashford?
Total Population of Ashford is 675.
What is the Total Male Population of Ashford?
Total Male Population of Ashford is 383.
What is the Total Female Population of Ashford?
Total Female Population of Ashford is 292.
What is the Ratio of Males per 100 Females in Ashford?
There are 131.16 Males per 100 Females in Ashford.
What is the Ratio of Females per 100 Males in Ashford?
There are 76.24 Females per 100 Males in Ashford.
What is the Median Population Age in Ashford?
Median Population Age in Ashford is 55.1 Years.
What is the Average Family Size in Ashford
Average Family Size in Ashford is 2.8 People.
What is the Average Household Size in Ashford
Average Household Size in Ashford is 2.5 People.
How Large is the Labor Force in Ashford?
There are 332 People in the Labor Forcein in Ashford.
What is the Percentage of People in the Labor Force in Ashford?
51.0% of People are in the Labor Force in Ashford.