Zip Codes with the Highest Percentage of Population Employed in Food Preparation & Serving in Edmonds, WA
RELATED REPORTS & OPTIONS
Food Preparation & Serving
Edmonds
Compare Zip Codes
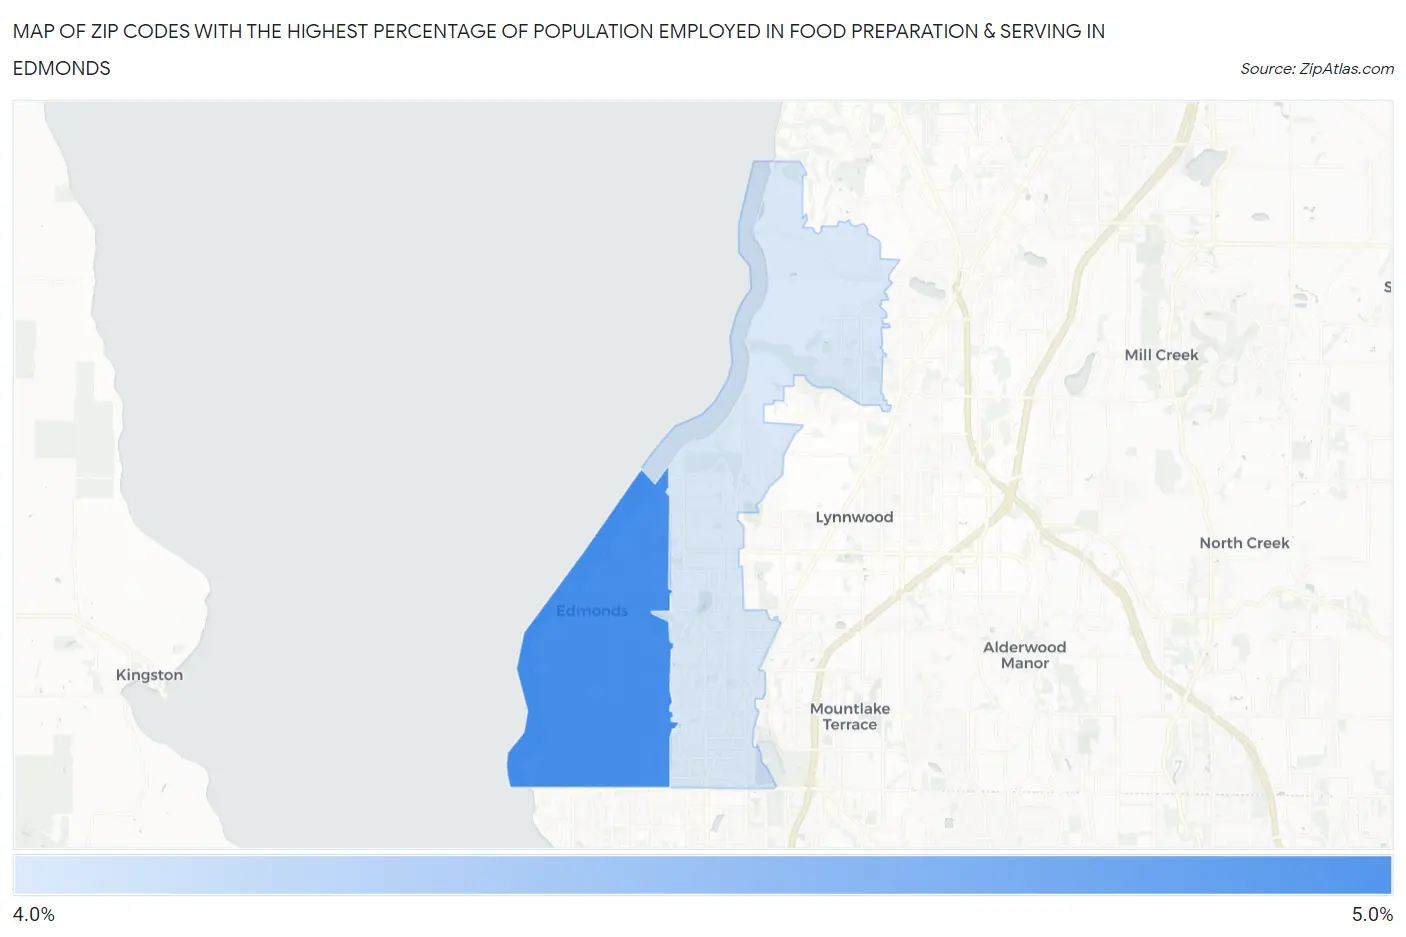
Map of Zip Codes with the Highest Percentage of Population Employed in Food Preparation & Serving in Edmonds
4.3%
4.6%
Zip Codes with the Highest Percentage of Population Employed in Food Preparation & Serving in Edmonds, WA
| Zip Code | % Employed | vs State | vs National | |
| 1. | 98020 | 4.6% | 5.1%(-0.539)#271 | 5.3%(-0.682)#14,572 |
| 2. | 98026 | 4.3% | 5.1%(-0.825)#298 | 5.3%(-0.968)#15,802 |
1
Common Questions
What are the Top Zip Codes with the Highest Percentage of Population Employed in Food Preparation & Serving in Edmonds, WA?
Top Zip Codes with the Highest Percentage of Population Employed in Food Preparation & Serving in Edmonds, WA are:
What zip code has the Highest Percentage of Population Employed in Food Preparation & Serving in Edmonds, WA?
98020 has the Highest Percentage of Population Employed in Food Preparation & Serving in Edmonds, WA with 4.6%.
What is the Percentage of Population Employed in Food Preparation & Serving in Edmonds, WA?
Percentage of Population Employed in Food Preparation & Serving in Edmonds is 5.3%.
What is the Percentage of Population Employed in Food Preparation & Serving in Washington?
Percentage of Population Employed in Food Preparation & Serving in Washington is 5.1%.
What is the Percentage of Population Employed in Food Preparation & Serving in the United States?
Percentage of Population Employed in Food Preparation & Serving in the United States is 5.3%.