Cities with the Highest Percentage of Households Residing in Detached Homes in Washington
RELATED REPORTS & OPTIONS
Detached Home Residency
Washington
Compare Cities
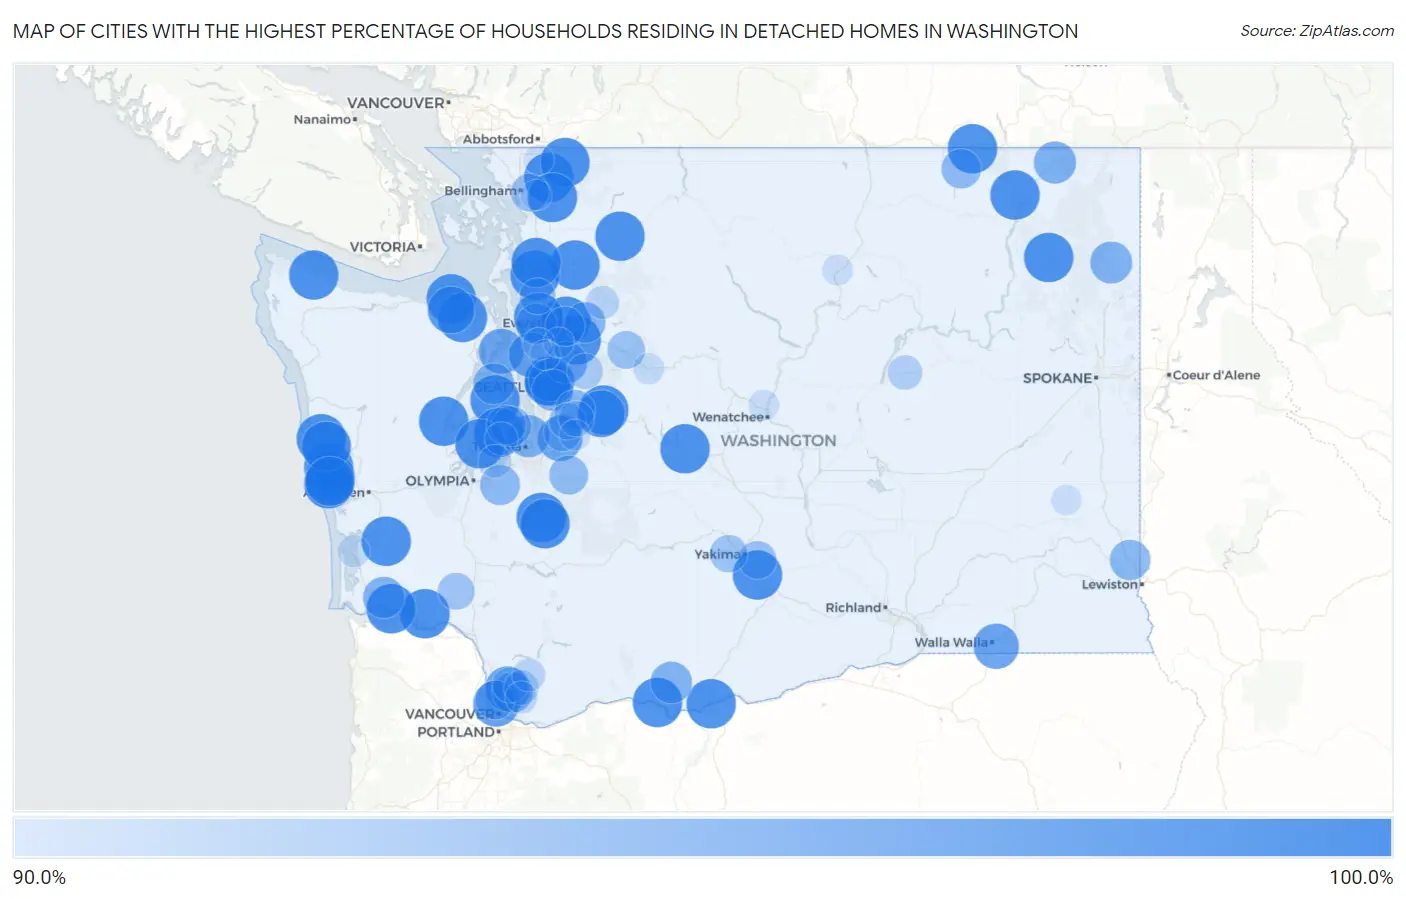
Map of Cities with the Highest Percentage of Households Residing in Detached Homes in Washington
0.0%
100.0%
Cities with the Highest Percentage of Households Residing in Detached Homes in Washington
| City | Detached Home Residency | vs State | vs National | |
| 1. | Riverbend | 100.0% | 63.1%(+36.9)#1 | 62.5%(+37.5)#80 |
| 2. | Monroe North | 100.0% | 63.1%(+36.9)#2 | 62.5%(+37.5)#88 |
| 3. | Cavalero | 100.0% | 63.1%(+36.9)#3 | 62.5%(+37.5)#131 |
| 4. | Gorst | 100.0% | 63.1%(+36.9)#4 | 62.5%(+37.5)#501 |
| 5. | Raft Island | 100.0% | 63.1%(+36.9)#5 | 62.5%(+37.5)#547 |
| 6. | Deming | 100.0% | 63.1%(+36.9)#6 | 62.5%(+37.5)#575 |
| 7. | Bow | 100.0% | 63.1%(+36.9)#7 | 62.5%(+37.5)#671 |
| 8. | Lake Cavanaugh | 100.0% | 63.1%(+36.9)#8 | 62.5%(+37.5)#700 |
| 9. | Jamestown | 100.0% | 63.1%(+36.9)#9 | 62.5%(+37.5)#725 |
| 10. | Copalis Beach | 100.0% | 63.1%(+36.9)#10 | 62.5%(+37.5)#799 |
| 11. | Lyle | 100.0% | 63.1%(+36.9)#11 | 62.5%(+37.5)#918 |
| 12. | Ronald | 100.0% | 63.1%(+36.9)#12 | 62.5%(+37.5)#926 |
| 13. | Maple Falls | 100.0% | 63.1%(+36.9)#13 | 62.5%(+37.5)#992 |
| 14. | La Grande | 100.0% | 63.1%(+36.9)#14 | 62.5%(+37.5)#1,041 |
| 15. | Willapa | 100.0% | 63.1%(+36.9)#15 | 62.5%(+37.5)#1,214 |
| 16. | Blyn | 100.0% | 63.1%(+36.9)#16 | 62.5%(+37.5)#1,239 |
| 17. | Hoodsport | 100.0% | 63.1%(+36.9)#17 | 62.5%(+37.5)#1,293 |
| 18. | Donald | 100.0% | 63.1%(+36.9)#18 | 62.5%(+37.5)#1,525 |
| 19. | Alder | 100.0% | 63.1%(+36.9)#19 | 62.5%(+37.5)#1,539 |
| 20. | Herron Island | 100.0% | 63.1%(+36.9)#20 | 62.5%(+37.5)#1,558 |
| 21. | Acme | 100.0% | 63.1%(+36.9)#21 | 62.5%(+37.5)#1,635 |
| 22. | Upper Elochoman | 100.0% | 63.1%(+36.9)#23 | 62.5%(+37.5)#1,693 |
| 23. | Ocean City | 100.0% | 63.1%(+36.9)#24 | 62.5%(+37.5)#1,694 |
| 24. | Danville | 100.0% | 63.1%(+36.9)#25 | 62.5%(+37.5)#1,933 |
| 25. | Santiago | 100.0% | 63.1%(+36.9)#26 | 62.5%(+37.5)#1,993 |
| 26. | Rockport | 100.0% | 63.1%(+36.9)#27 | 62.5%(+37.5)#2,203 |
| 27. | Sekiu | 100.0% | 63.1%(+36.9)#28 | 62.5%(+37.5)#2,228 |
| 28. | Altoona | 100.0% | 63.1%(+36.9)#29 | 62.5%(+37.5)#2,260 |
| 29. | Oyehut | 100.0% | 63.1%(+36.9)#30 | 62.5%(+37.5)#2,279 |
| 30. | Northwest Stanwood | 100.0% | 63.1%(+36.9)#31 | 62.5%(+37.5)#2,313 |
| 31. | Qui Nai Elt Village | 100.0% | 63.1%(+36.9)#32 | 62.5%(+37.5)#2,314 |
| 32. | Conway | 100.0% | 63.1%(+36.9)#33 | 62.5%(+37.5)#2,382 |
| 33. | Maryhill | 100.0% | 63.1%(+36.9)#34 | 62.5%(+37.5)#2,499 |
| 34. | Boyds | 100.0% | 63.1%(+36.9)#35 | 62.5%(+37.5)#2,549 |
| 35. | Addy | 100.0% | 63.1%(+36.9)#36 | 62.5%(+37.5)#2,608 |
| 36. | Hat Island | 100.0% | 63.1%(+36.9)#37 | 62.5%(+37.5)#2,762 |
| 37. | Anatone | 100.0% | 63.1%(+36.9)#38 | 62.5%(+37.5)#2,997 |
| 38. | Hogans Corner | 100.0% | 63.1%(+36.9)#39 | 62.5%(+37.5)#3,039 |
| 39. | Clyde Hill | 99.8% | 63.1%(+36.7)#40 | 62.5%(+37.3)#3,119 |
| 40. | Hunts Point | 99.3% | 63.1%(+36.2)#41 | 62.5%(+36.8)#3,223 |
| 41. | Wilderness Rim | 99.1% | 63.1%(+36.0)#42 | 62.5%(+36.6)#3,262 |
| 42. | Bell Hill | 99.0% | 63.1%(+35.9)#43 | 62.5%(+36.5)#3,296 |
| 43. | Lake Shore | 98.7% | 63.1%(+35.6)#44 | 62.5%(+36.2)#3,381 |
| 44. | Medina | 98.7% | 63.1%(+35.6)#45 | 62.5%(+36.2)#3,388 |
| 45. | Walla Walla East | 98.4% | 63.1%(+35.3)#46 | 62.5%(+35.9)#3,501 |
| 46. | Lofall | 98.3% | 63.1%(+35.2)#47 | 62.5%(+35.8)#3,543 |
| 47. | Woodway | 98.3% | 63.1%(+35.2)#48 | 62.5%(+35.8)#3,555 |
| 48. | Lake Holm | 98.2% | 63.1%(+35.1)#49 | 62.5%(+35.7)#3,589 |
| 49. | Dollars Corner | 98.2% | 63.1%(+35.1)#50 | 62.5%(+35.7)#3,598 |
| 50. | Yarrow Point | 97.5% | 63.1%(+34.4)#51 | 62.5%(+35.0)#3,886 |
| 51. | Dash Point | 97.2% | 63.1%(+34.1)#52 | 62.5%(+34.7)#4,013 |
| 52. | Northport | 97.2% | 63.1%(+34.1)#53 | 62.5%(+34.7)#4,032 |
| 53. | Cottage Lake | 97.1% | 63.1%(+34.0)#54 | 62.5%(+34.6)#4,044 |
| 54. | Cusick | 97.1% | 63.1%(+34.0)#55 | 62.5%(+34.6)#4,085 |
| 55. | Klickitat | 97.0% | 63.1%(+33.9)#56 | 62.5%(+34.5)#4,145 |
| 56. | Beaux Arts Village | 96.9% | 63.1%(+33.8)#57 | 62.5%(+34.4)#4,195 |
| 57. | Deep River | 96.9% | 63.1%(+33.8)#58 | 62.5%(+34.4)#4,203 |
| 58. | Tehaleh | 96.8% | 63.1%(+33.7)#59 | 62.5%(+34.3)#4,217 |
| 59. | Chico | 96.7% | 63.1%(+33.6)#60 | 62.5%(+34.2)#4,277 |
| 60. | Lake Roesiger | 96.7% | 63.1%(+33.6)#61 | 62.5%(+34.2)#4,287 |
| 61. | Meadow Glade | 96.6% | 63.1%(+33.5)#62 | 62.5%(+34.1)#4,330 |
| 62. | Clinton | 96.6% | 63.1%(+33.5)#63 | 62.5%(+34.1)#4,340 |
| 63. | Colton | 96.5% | 63.1%(+33.4)#64 | 62.5%(+34.0)#4,403 |
| 64. | Mirrormont | 96.4% | 63.1%(+33.3)#65 | 62.5%(+33.9)#4,417 |
| 65. | Nisqually Indian Community | 96.4% | 63.1%(+33.3)#66 | 62.5%(+33.9)#4,435 |
| 66. | Maplewood | 96.3% | 63.1%(+33.2)#67 | 62.5%(+33.8)#4,473 |
| 67. | Bunk Foss | 96.2% | 63.1%(+33.1)#68 | 62.5%(+33.7)#4,527 |
| 68. | Curlew | 96.2% | 63.1%(+33.1)#69 | 62.5%(+33.7)#4,566 |
| 69. | Canterwood | 96.1% | 63.1%(+33.0)#70 | 62.5%(+33.6)#4,580 |
| 70. | Felida | 96.0% | 63.1%(+32.9)#71 | 62.5%(+33.5)#4,605 |
| 71. | Carbonado | 96.0% | 63.1%(+32.9)#72 | 62.5%(+33.5)#4,635 |
| 72. | Moxee | 95.6% | 63.1%(+32.5)#73 | 62.5%(+33.1)#4,834 |
| 73. | Geneva | 95.6% | 63.1%(+32.5)#74 | 62.5%(+33.1)#4,840 |
| 74. | Index | 95.5% | 63.1%(+32.4)#75 | 62.5%(+33.0)#4,923 |
| 75. | Lake Morton Berrydale | 95.4% | 63.1%(+32.3)#76 | 62.5%(+32.9)#4,933 |
| 76. | Summitview | 95.4% | 63.1%(+32.3)#77 | 62.5%(+32.9)#4,943 |
| 77. | Ryderwood | 95.2% | 63.1%(+32.1)#78 | 62.5%(+32.7)#5,068 |
| 78. | Shadow Lake | 95.0% | 63.1%(+31.9)#79 | 62.5%(+32.5)#5,146 |
| 79. | Kayak Point | 94.9% | 63.1%(+31.8)#80 | 62.5%(+32.4)#5,191 |
| 80. | Lake Marcel Stillwater | 94.7% | 63.1%(+31.6)#81 | 62.5%(+32.2)#5,291 |
| 81. | Hobart | 94.6% | 63.1%(+31.5)#82 | 62.5%(+32.1)#5,325 |
| 82. | Cherry Grove | 94.6% | 63.1%(+31.5)#83 | 62.5%(+32.1)#5,348 |
| 83. | Venersborg | 94.3% | 63.1%(+31.2)#84 | 62.5%(+31.8)#5,459 |
| 84. | Hartline | 94.3% | 63.1%(+31.2)#85 | 62.5%(+31.8)#5,497 |
| 85. | Verlot | 93.8% | 63.1%(+30.7)#86 | 62.5%(+31.3)#5,769 |
| 86. | Artondale | 93.7% | 63.1%(+30.6)#87 | 62.5%(+31.2)#5,796 |
| 87. | Anderson Island | 93.7% | 63.1%(+30.6)#88 | 62.5%(+31.2)#5,806 |
| 88. | Yacolt | 93.7% | 63.1%(+30.6)#89 | 62.5%(+31.2)#5,808 |
| 89. | Hockinson | 93.4% | 63.1%(+30.3)#90 | 62.5%(+30.9)#5,961 |
| 90. | Meadowdale | 93.3% | 63.1%(+30.2)#91 | 62.5%(+30.8)#6,011 |
| 91. | Bay Center | 93.3% | 63.1%(+30.2)#92 | 62.5%(+30.8)#6,043 |
| 92. | Skykomish | 93.1% | 63.1%(+30.0)#93 | 62.5%(+30.6)#6,147 |
| 93. | Black Diamond | 92.9% | 63.1%(+29.8)#94 | 62.5%(+30.4)#6,198 |
| 94. | Sunnyslope | 92.9% | 63.1%(+29.8)#95 | 62.5%(+30.4)#6,201 |
| 95. | Malott | 92.9% | 63.1%(+29.8)#96 | 62.5%(+30.4)#6,216 |
| 96. | Sudden Valley | 92.8% | 63.1%(+29.7)#97 | 62.5%(+30.3)#6,269 |
| 97. | Brier | 92.8% | 63.1%(+29.7)#98 | 62.5%(+30.3)#6,270 |
| 98. | Endicott | 92.8% | 63.1%(+29.7)#99 | 62.5%(+30.3)#6,290 |
| 99. | Silver Firs | 92.7% | 63.1%(+29.6)#100 | 62.5%(+30.2)#6,302 |
| 100. | Nooksack | 92.7% | 63.1%(+29.6)#101 | 62.5%(+30.2)#6,316 |
Common Questions
What are the Top 10 Cities with the Highest Percentage of Households Residing in Detached Homes in Washington?
Top 10 Cities with the Highest Percentage of Households Residing in Detached Homes in Washington are:
#1
100.0%
#2
100.0%
#3
100.0%
#4
100.0%
#5
100.0%
#6
100.0%
#7
100.0%
#8
100.0%
#9
100.0%
#10
100.0%
What city has the Highest Percentage of Households Residing in Detached Homes in Washington?
Riverbend has the Highest Percentage of Households Residing in Detached Homes in Washington with 100.0%.
What is the Percentage of Households Residing in Detached Homes in the State of Washington?
Percentage of Households Residing in Detached Homes in Washington is 63.1%.
What is the Percentage of Households Residing in Detached Homes in the United States?
Percentage of Households Residing in Detached Homes in the United States is 62.5%.