Zip Codes with the Highest Percentage of Population Employed in Food Preparation & Serving in Gig Harbor, WA
RELATED REPORTS & OPTIONS
Food Preparation & Serving
Gig Harbor
Compare Zip Codes
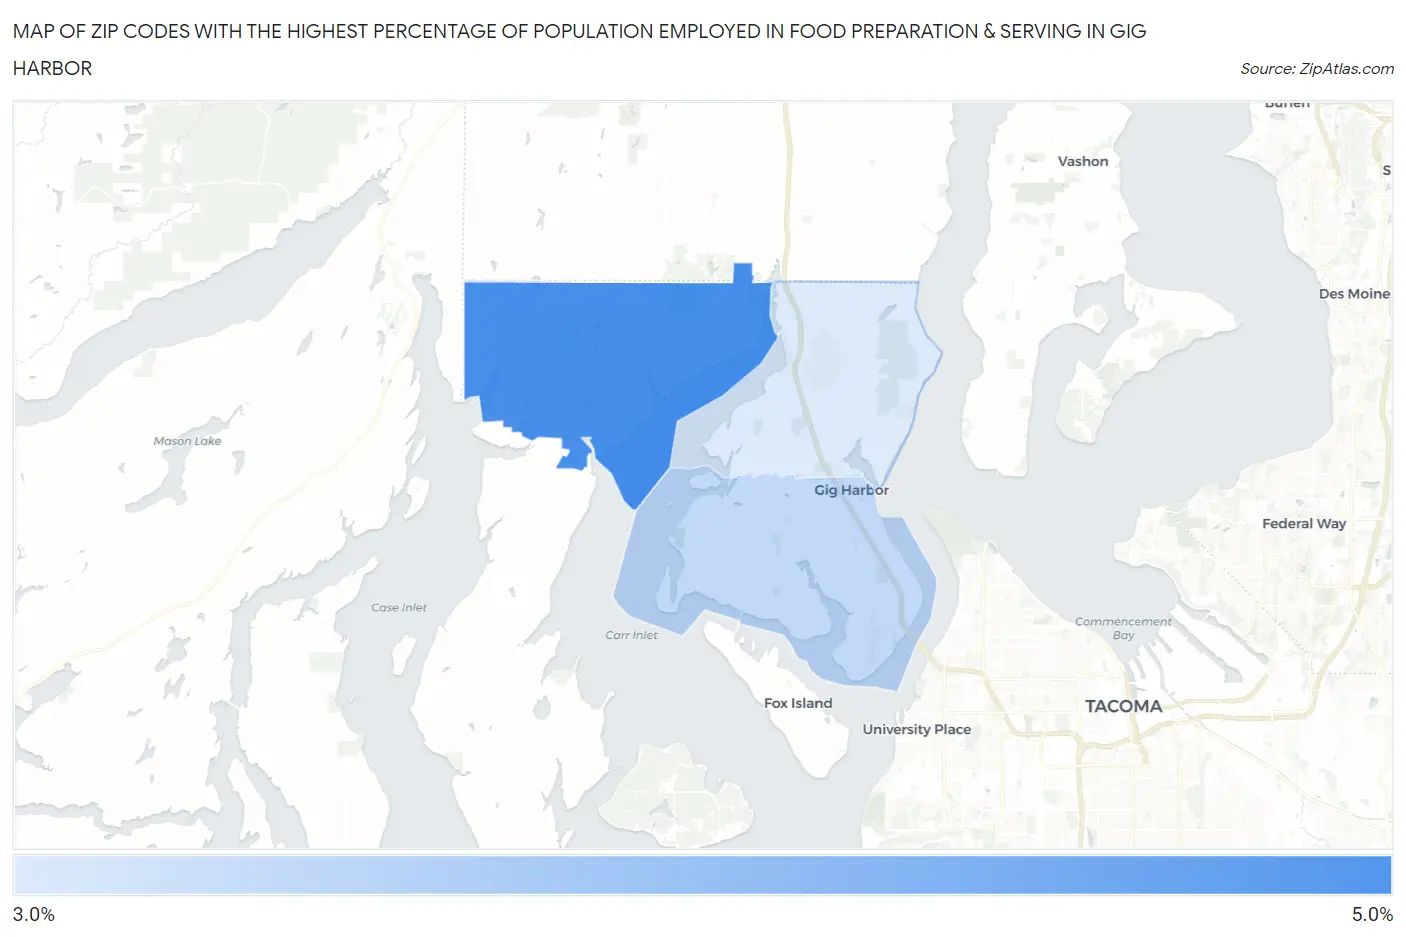
Map of Zip Codes with the Highest Percentage of Population Employed in Food Preparation & Serving in Gig Harbor
3.7%
5.0%
Zip Codes with the Highest Percentage of Population Employed in Food Preparation & Serving in Gig Harbor, WA
| Zip Code | % Employed | vs State | vs National | |
| 1. | 98329 | 5.0% | 5.1%(-0.150)#244 | 5.3%(-0.293)#12,990 |
| 2. | 98335 | 3.9% | 5.1%(-1.20)#325 | 5.3%(-1.35)#17,375 |
| 3. | 98332 | 3.7% | 5.1%(-1.45)#339 | 5.3%(-1.59)#18,382 |
1
Common Questions
What are the Top Zip Codes with the Highest Percentage of Population Employed in Food Preparation & Serving in Gig Harbor, WA?
Top Zip Codes with the Highest Percentage of Population Employed in Food Preparation & Serving in Gig Harbor, WA are:
What zip code has the Highest Percentage of Population Employed in Food Preparation & Serving in Gig Harbor, WA?
98329 has the Highest Percentage of Population Employed in Food Preparation & Serving in Gig Harbor, WA with 5.0%.
What is the Percentage of Population Employed in Food Preparation & Serving in Gig Harbor, WA?
Percentage of Population Employed in Food Preparation & Serving in Gig Harbor is 5.3%.
What is the Percentage of Population Employed in Food Preparation & Serving in Washington?
Percentage of Population Employed in Food Preparation & Serving in Washington is 5.1%.
What is the Percentage of Population Employed in Food Preparation & Serving in the United States?
Percentage of Population Employed in Food Preparation & Serving in the United States is 5.3%.