Cities with the Highest Percentage of Immigrants from Vietnam in Washington
RELATED REPORTS & OPTIONS
Vietnam
Washington
Compare Cities
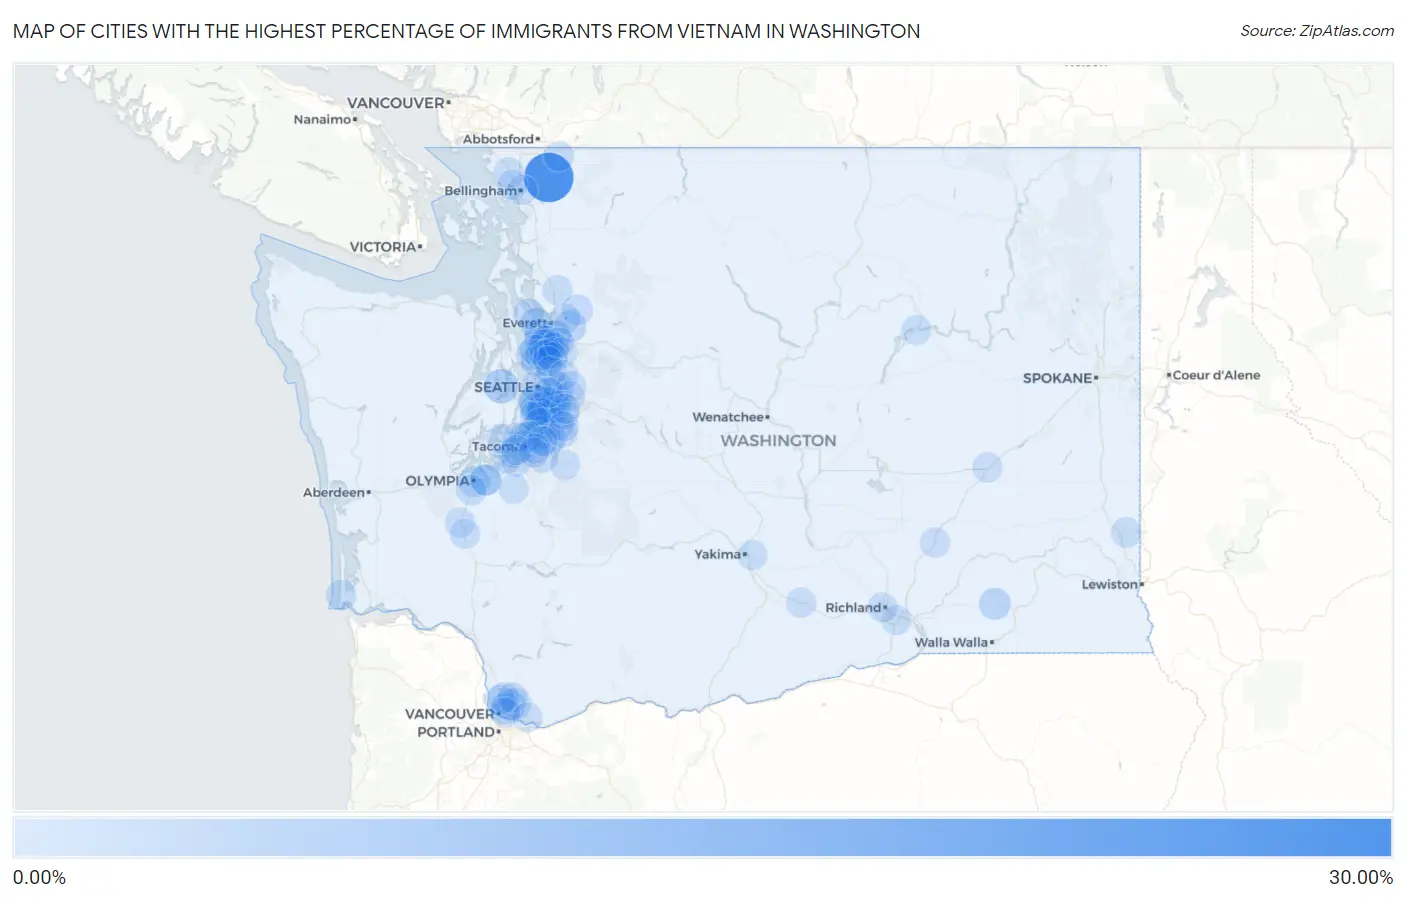
Map of Cities with the Highest Percentage of Immigrants from Vietnam in Washington
0.00%
30.00%
Cities with the Highest Percentage of Immigrants from Vietnam in Washington
| City | Vietnam | vs State | vs National | |
| 1. | Deming | 26.46% | 0.81%(+25.7)#-1 | 0.41%(+26.1)#0 |
| 2. | Bryn Mawr Skyway | 7.80% | 0.81%(+7.00)#37 | 0.41%(+7.40)#665 |
| 3. | White Center | 7.05% | 0.81%(+6.24)#38 | 0.41%(+6.64)#666 |
| 4. | Tracyton | 5.79% | 0.81%(+4.98)#49 | 0.41%(+5.38)#868 |
| 5. | Tukwila | 5.73% | 0.81%(+4.92)#50 | 0.41%(+5.32)#869 |
| 6. | Larch Way | 5.39% | 0.81%(+4.58)#51 | 0.41%(+4.98)#870 |
| 7. | Renton | 4.84% | 0.81%(+4.03)#52 | 0.41%(+4.43)#871 |
| 8. | Burien | 4.11% | 0.81%(+3.30)#99 | 0.41%(+3.70)#1,876 |
| 9. | Eastmont | 3.38% | 0.81%(+2.57)#100 | 0.41%(+2.97)#1,877 |
| 10. | Everett | 2.99% | 0.81%(+2.18)#101 | 0.41%(+2.58)#1,882 |
| 11. | Lakeland North | 2.84% | 0.81%(+2.03)#102 | 0.41%(+2.43)#1,883 |
| 12. | Kent | 2.77% | 0.81%(+1.96)#103 | 0.41%(+2.36)#1,884 |
| 13. | Prescott | 2.64% | 0.81%(+1.83)#104 | 0.41%(+2.23)#1,885 |
| 14. | Picnic Point | 2.56% | 0.81%(+1.76)#105 | 0.41%(+2.15)#1,886 |
| 15. | Clinton | 2.49% | 0.81%(+1.68)#106 | 0.41%(+2.08)#1,887 |
| 16. | Fairwood Cdp King County | 2.15% | 0.81%(+1.35)#107 | 0.41%(+1.75)#1,888 |
| 17. | Alderwood Manor | 2.15% | 0.81%(+1.34)#108 | 0.41%(+1.74)#1,889 |
| 18. | Martha Lake | 2.08% | 0.81%(+1.27)#109 | 0.41%(+1.67)#1,890 |
| 19. | Lynnwood | 1.97% | 0.81%(+1.16)#110 | 0.41%(+1.56)#1,891 |
| 20. | Seatac | 1.92% | 0.81%(+1.11)#111 | 0.41%(+1.51)#1,892 |
| 21. | Hunts Point | 1.86% | 0.81%(+1.05)#112 | 0.41%(+1.45)#1,893 |
| 22. | Federal Way | 1.80% | 0.81%(+0.999)#113 | 0.41%(+1.40)#1,894 |
| 23. | Des Moines | 1.79% | 0.81%(+0.981)#114 | 0.41%(+1.38)#1,895 |
| 24. | Olympia | 1.77% | 0.81%(+0.965)#116 | 0.41%(+1.36)#2,355 |
| 25. | Newcastle | 1.75% | 0.81%(+0.941)#117 | 0.41%(+1.34)#2,356 |
| 26. | Five Corners | 1.74% | 0.81%(+0.929)#118 | 0.41%(+1.33)#2,357 |
| 27. | Lacey | 1.67% | 0.81%(+0.868)#119 | 0.41%(+1.27)#2,358 |
| 28. | Normandy Park | 1.64% | 0.81%(+0.836)#120 | 0.41%(+1.23)#2,359 |
| 29. | Tanglewilde | 1.62% | 0.81%(+0.817)#121 | 0.41%(+1.22)#2,360 |
| 30. | Minnehaha | 1.55% | 0.81%(+0.748)#122 | 0.41%(+1.15)#2,361 |
| 31. | Mukilteo | 1.55% | 0.81%(+0.748)#123 | 0.41%(+1.15)#2,362 |
| 32. | Maple Heights Lake Desire | 1.54% | 0.81%(+0.736)#124 | 0.41%(+1.13)#2,363 |
| 33. | Woodway | 1.52% | 0.81%(+0.714)#125 | 0.41%(+1.11)#2,364 |
| 34. | Langley | 1.49% | 0.81%(+0.681)#126 | 0.41%(+1.08)#2,365 |
| 35. | North Lynnwood | 1.48% | 0.81%(+0.675)#127 | 0.41%(+1.07)#2,366 |
| 36. | Bellevue | 1.48% | 0.81%(+0.674)#128 | 0.41%(+1.07)#2,367 |
| 37. | Tacoma | 1.48% | 0.81%(+0.674)#129 | 0.41%(+1.07)#2,368 |
| 38. | Lake Stickney | 1.44% | 0.81%(+0.632)#130 | 0.41%(+1.03)#2,369 |
| 39. | Lake Bosworth | 1.32% | 0.81%(+0.516)#131 | 0.41%(+0.914)#2,370 |
| 40. | Orchards | 1.27% | 0.81%(+0.467)#132 | 0.41%(+0.866)#2,371 |
| 41. | Ruston | 1.26% | 0.81%(+0.453)#133 | 0.41%(+0.852)#2,372 |
| 42. | Algona | 1.26% | 0.81%(+0.450)#134 | 0.41%(+0.848)#2,373 |
| 43. | Lexington | 1.25% | 0.81%(+0.447)#135 | 0.41%(+0.845)#2,374 |
| 44. | Seattle | 1.24% | 0.81%(+0.432)#136 | 0.41%(+0.831)#2,375 |
| 45. | Mountlake Terrace | 1.19% | 0.81%(+0.388)#137 | 0.41%(+0.787)#2,376 |
| 46. | Shoreline | 1.19% | 0.81%(+0.380)#138 | 0.41%(+0.779)#2,377 |
| 47. | Browns Point | 1.19% | 0.81%(+0.379)#139 | 0.41%(+0.777)#2,378 |
| 48. | Lake Morton Berrydale | 1.04% | 0.81%(+0.236)#140 | 0.41%(+0.635)#2,379 |
| 49. | Edmonds | 1.02% | 0.81%(+0.217)#141 | 0.41%(+0.616)#2,380 |
| 50. | Auburn | 1.02% | 0.81%(+0.217)#142 | 0.41%(+0.615)#2,381 |
| 51. | Bothell East | 0.98% | 0.81%(+0.169)#143 | 0.41%(+0.567)#2,382 |
| 52. | Mill Creek East | 0.97% | 0.81%(+0.162)#144 | 0.41%(+0.561)#2,383 |
| 53. | Lake Stevens | 0.95% | 0.81%(+0.144)#145 | 0.41%(+0.543)#2,384 |
| 54. | Long Beach | 0.93% | 0.81%(+0.122)#146 | 0.41%(+0.521)#2,385 |
| 55. | Tumwater | 0.90% | 0.81%(+0.091)#147 | 0.41%(+0.490)#2,386 |
| 56. | Peaceful Valley | 0.88% | 0.81%(+0.078)#148 | 0.41%(+0.476)#2,387 |
| 57. | Ferndale | 0.87% | 0.81%(+0.059)#149 | 0.41%(+0.458)#2,388 |
| 58. | University Place | 0.84% | 0.81%(+0.029)#150 | 0.41%(+0.428)#2,389 |
| 59. | Maltby | 0.83% | 0.81%(+0.022)#151 | 0.41%(+0.421)#2,390 |
| 60. | Brier | 0.83% | 0.81%(+0.019)#152 | 0.41%(+0.418)#2,391 |
| 61. | Mount Vista | 0.79% | 0.81%(-0.018)#153 | 0.41%(+0.381)#2,392 |
| 62. | Salmon Creek | 0.79% | 0.81%(-0.019)#154 | 0.41%(+0.380)#2,929 |
| 63. | Bothell West | 0.78% | 0.81%(-0.022)#155 | 0.41%(+0.377)#2,930 |
| 64. | Lakewood | 0.78% | 0.81%(-0.022)#156 | 0.41%(+0.376)#2,931 |
| 65. | Bothell | 0.77% | 0.81%(-0.032)#157 | 0.41%(+0.367)#2,932 |
| 66. | Pullman | 0.77% | 0.81%(-0.034)#158 | 0.41%(+0.365)#2,933 |
| 67. | Puyallup | 0.71% | 0.81%(-0.095)#159 | 0.41%(+0.303)#2,934 |
| 68. | Kirkland | 0.70% | 0.81%(-0.107)#160 | 0.41%(+0.292)#2,935 |
| 69. | Dash Point | 0.65% | 0.81%(-0.156)#161 | 0.41%(+0.242)#2,936 |
| 70. | Ritzville | 0.63% | 0.81%(-0.172)#162 | 0.41%(+0.227)#2,937 |
| 71. | Silver Firs | 0.63% | 0.81%(-0.172)#163 | 0.41%(+0.227)#2,938 |
| 72. | Covington | 0.61% | 0.81%(-0.196)#164 | 0.41%(+0.203)#2,939 |
| 73. | Brush Prairie | 0.57% | 0.81%(-0.235)#165 | 0.41%(+0.164)#2,940 |
| 74. | Sammamish | 0.57% | 0.81%(-0.239)#166 | 0.41%(+0.160)#2,941 |
| 75. | South Prairie | 0.57% | 0.81%(-0.240)#167 | 0.41%(+0.159)#2,942 |
| 76. | Sunnyside | 0.56% | 0.81%(-0.249)#168 | 0.41%(+0.150)#2,943 |
| 77. | Vancouver | 0.55% | 0.81%(-0.254)#169 | 0.41%(+0.145)#2,944 |
| 78. | Grand Mound | 0.55% | 0.81%(-0.254)#170 | 0.41%(+0.144)#2,945 |
| 79. | Roy | 0.54% | 0.81%(-0.263)#171 | 0.41%(+0.136)#2,946 |
| 80. | Centralia | 0.53% | 0.81%(-0.274)#172 | 0.41%(+0.124)#2,947 |
| 81. | Steilacoom | 0.52% | 0.81%(-0.282)#173 | 0.41%(+0.116)#2,948 |
| 82. | Artondale | 0.52% | 0.81%(-0.287)#174 | 0.41%(+0.112)#2,949 |
| 83. | Arlington | 0.52% | 0.81%(-0.288)#175 | 0.41%(+0.111)#2,950 |
| 84. | Issaquah | 0.52% | 0.81%(-0.291)#176 | 0.41%(+0.108)#2,951 |
| 85. | Fife | 0.51% | 0.81%(-0.292)#177 | 0.41%(+0.107)#2,952 |
| 86. | East Renton Highlands | 0.50% | 0.81%(-0.310)#178 | 0.41%(+0.089)#2,953 |
| 87. | Grand Coulee | 0.48% | 0.81%(-0.323)#179 | 0.41%(+0.076)#2,954 |
| 88. | Fircrest | 0.48% | 0.81%(-0.327)#180 | 0.41%(+0.071)#2,955 |
| 89. | Lakeland South | 0.48% | 0.81%(-0.330)#181 | 0.41%(+0.068)#2,956 |
| 90. | Kennewick | 0.47% | 0.81%(-0.335)#182 | 0.41%(+0.064)#2,957 |
| 91. | Connell | 0.46% | 0.81%(-0.343)#183 | 0.41%(+0.056)#2,958 |
| 92. | Waller | 0.46% | 0.81%(-0.343)#184 | 0.41%(+0.055)#2,959 |
| 93. | Kenmore | 0.46% | 0.81%(-0.349)#185 | 0.41%(+0.050)#2,960 |
| 94. | Bellingham | 0.44% | 0.81%(-0.362)#186 | 0.41%(+0.037)#2,961 |
| 95. | Camas | 0.43% | 0.81%(-0.378)#187 | 0.41%(+0.021)#2,962 |
| 96. | Marietta Alderwood | 0.42% | 0.81%(-0.383)#188 | 0.41%(+0.016)#2,963 |
| 97. | Redmond | 0.40% | 0.81%(-0.406)#189 | 0.41%(-0.008)#2,964 |
| 98. | Mercer Island | 0.40% | 0.81%(-0.410)#190 | 0.41%(-0.011)#2,965 |
| 99. | Terrace Heights | 0.39% | 0.81%(-0.418)#191 | 0.41%(-0.019)#2,966 |
| 100. | Richland | 0.38% | 0.81%(-0.422)#192 | 0.41%(-0.023)#2,967 |
Common Questions
What are the Top 10 Cities with the Highest Percentage of Immigrants from Vietnam in Washington?
Top 10 Cities with the Highest Percentage of Immigrants from Vietnam in Washington are:
#1
26.46%
#2
7.80%
#3
7.05%
#4
5.79%
#5
5.73%
#6
5.39%
#7
4.84%
#8
4.11%
#9
3.38%
#10
2.99%
What city has the Highest Percentage of Immigrants from Vietnam in Washington?
Deming has the Highest Percentage of Immigrants from Vietnam in Washington with 26.46%.
What is the Percentage of Immigrants from Vietnam in the State of Washington?
Percentage of Immigrants from Vietnam in Washington is 0.81%.
What is the Percentage of Immigrants from Vietnam in the United States?
Percentage of Immigrants from Vietnam in the United States is 0.41%.