Cities with the Most Immigrants from Africa in Washington
RELATED REPORTS & OPTIONS
Africa
Washington
Compare Cities
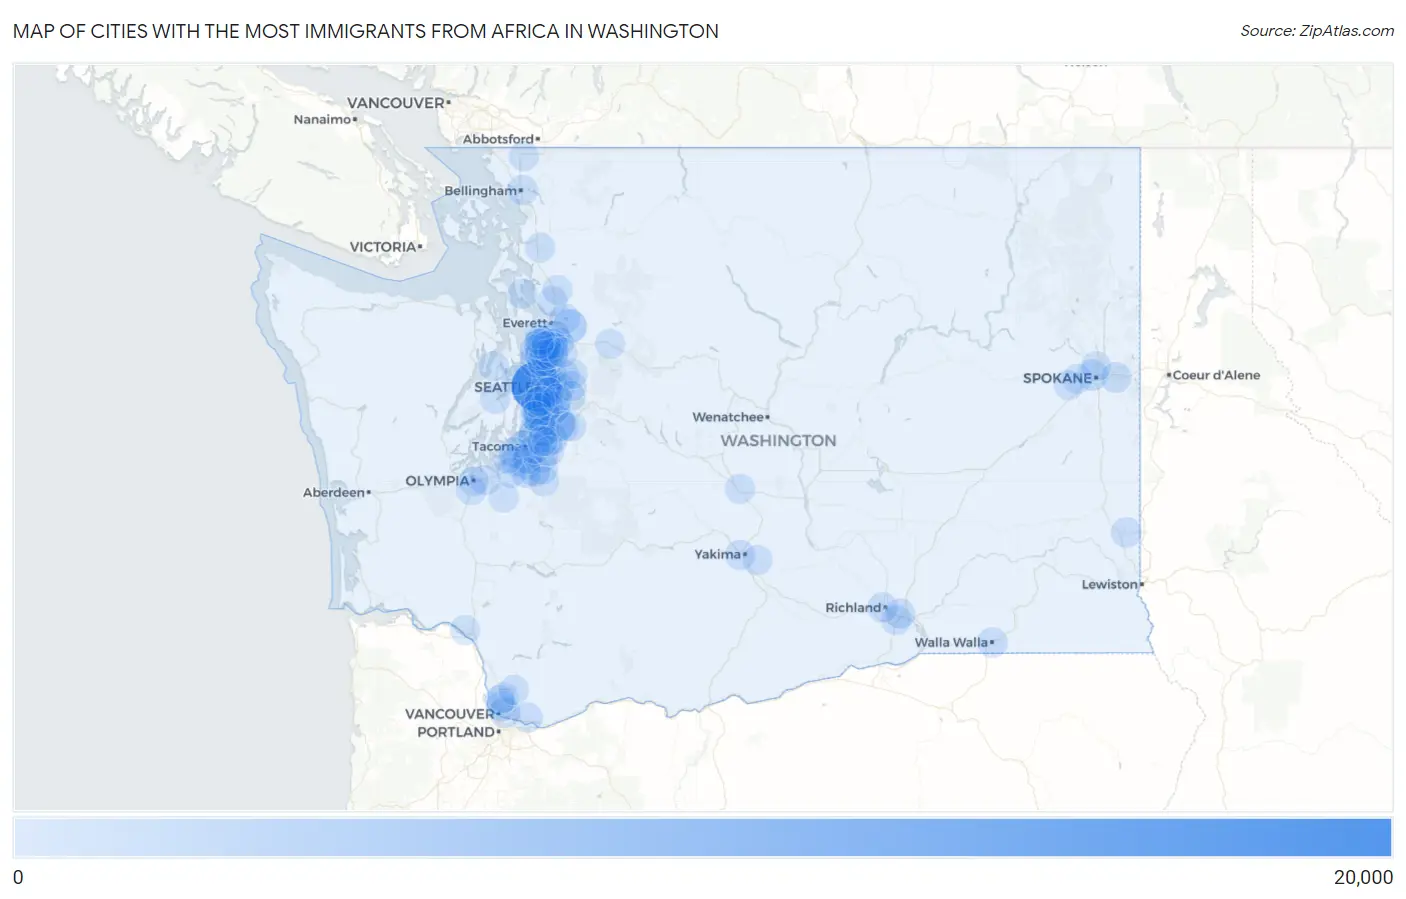
Map of Cities with the Most Immigrants from Africa in Washington
0
20,000
Cities with the Most Immigrants from Africa in Washington
| City | Africa | vs State | vs National | |
| 1. | Seattle | 15,597 | 73,519(21.21%)#1 | 2,580,172(0.60%)#15 |
| 2. | Federal Way | 4,292 | 73,519(5.84%)#2 | 2,580,172(0.17%)#71 |
| 3. | Seatac | 4,261 | 73,519(5.80%)#3 | 2,580,172(0.17%)#72 |
| 4. | Kent | 4,077 | 73,519(5.55%)#4 | 2,580,172(0.16%)#74 |
| 5. | Everett | 2,973 | 73,519(4.04%)#5 | 2,580,172(0.12%)#101 |
| 6. | Shoreline | 2,491 | 73,519(3.39%)#6 | 2,580,172(0.10%)#126 |
| 7. | Renton | 1,983 | 73,519(2.70%)#7 | 2,580,172(0.08%)#179 |
| 8. | Auburn | 1,865 | 73,519(2.54%)#8 | 2,580,172(0.07%)#191 |
| 9. | Lynnwood | 1,800 | 73,519(2.45%)#9 | 2,580,172(0.07%)#201 |
| 10. | Tacoma | 1,632 | 73,519(2.22%)#10 | 2,580,172(0.06%)#228 |
| 11. | Tukwila | 1,587 | 73,519(2.16%)#11 | 2,580,172(0.06%)#236 |
| 12. | Bellevue | 1,336 | 73,519(1.82%)#12 | 2,580,172(0.05%)#299 |
| 13. | Burien | 1,226 | 73,519(1.67%)#13 | 2,580,172(0.05%)#327 |
| 14. | Bryn Mawr Skyway | 889 | 73,519(1.21%)#14 | 2,580,172(0.03%)#452 |
| 15. | Des Moines | 883 | 73,519(1.20%)#15 | 2,580,172(0.03%)#456 |
| 16. | Spokane | 868 | 73,519(1.18%)#16 | 2,580,172(0.03%)#468 |
| 17. | Parkland | 856 | 73,519(1.16%)#17 | 2,580,172(0.03%)#475 |
| 18. | Redmond | 825 | 73,519(1.12%)#18 | 2,580,172(0.03%)#491 |
| 19. | Vancouver | 780 | 73,519(1.06%)#19 | 2,580,172(0.03%)#509 |
| 20. | North Lynnwood | 682 | 73,519(0.93%)#20 | 2,580,172(0.03%)#572 |
| 21. | Lake Stickney | 680 | 73,519(0.92%)#21 | 2,580,172(0.03%)#576 |
| 22. | Eastmont | 641 | 73,519(0.87%)#22 | 2,580,172(0.02%)#606 |
| 23. | Lakeland North | 620 | 73,519(0.84%)#23 | 2,580,172(0.02%)#628 |
| 24. | South Hill | 564 | 73,519(0.77%)#24 | 2,580,172(0.02%)#677 |
| 25. | Spokane Valley | 526 | 73,519(0.72%)#25 | 2,580,172(0.02%)#704 |
| 26. | Lakewood | 506 | 73,519(0.69%)#26 | 2,580,172(0.02%)#728 |
| 27. | Martha Lake | 506 | 73,519(0.69%)#27 | 2,580,172(0.02%)#730 |
| 28. | White Center | 487 | 73,519(0.66%)#28 | 2,580,172(0.02%)#752 |
| 29. | Alderwood Manor | 480 | 73,519(0.65%)#29 | 2,580,172(0.02%)#762 |
| 30. | Edmonds | 449 | 73,519(0.61%)#30 | 2,580,172(0.02%)#811 |
| 31. | Fairwood Cdp King County | 438 | 73,519(0.60%)#31 | 2,580,172(0.02%)#825 |
| 32. | Kirkland | 432 | 73,519(0.59%)#32 | 2,580,172(0.02%)#839 |
| 33. | Bothell | 419 | 73,519(0.57%)#33 | 2,580,172(0.02%)#856 |
| 34. | Issaquah | 399 | 73,519(0.54%)#34 | 2,580,172(0.02%)#892 |
| 35. | Frederickson | 397 | 73,519(0.54%)#35 | 2,580,172(0.02%)#898 |
| 36. | Puyallup | 395 | 73,519(0.54%)#36 | 2,580,172(0.02%)#901 |
| 37. | Kenmore | 392 | 73,519(0.53%)#37 | 2,580,172(0.02%)#907 |
| 38. | Mountlake Terrace | 387 | 73,519(0.53%)#38 | 2,580,172(0.01%)#917 |
| 39. | Marysville | 374 | 73,519(0.51%)#39 | 2,580,172(0.01%)#941 |
| 40. | Walla Walla | 370 | 73,519(0.50%)#40 | 2,580,172(0.01%)#950 |
| 41. | Kennewick | 368 | 73,519(0.50%)#41 | 2,580,172(0.01%)#953 |
| 42. | Sammamish | 353 | 73,519(0.48%)#42 | 2,580,172(0.01%)#991 |
| 43. | University Place | 346 | 73,519(0.47%)#43 | 2,580,172(0.01%)#1,007 |
| 44. | Midland | 342 | 73,519(0.47%)#44 | 2,580,172(0.01%)#1,015 |
| 45. | Covington | 315 | 73,519(0.43%)#45 | 2,580,172(0.01%)#1,081 |
| 46. | Pullman | 311 | 73,519(0.42%)#46 | 2,580,172(0.01%)#1,093 |
| 47. | Richland | 289 | 73,519(0.39%)#47 | 2,580,172(0.01%)#1,152 |
| 48. | Spanaway | 279 | 73,519(0.38%)#48 | 2,580,172(0.01%)#1,169 |
| 49. | Hazel Dell | 275 | 73,519(0.37%)#49 | 2,580,172(0.01%)#1,182 |
| 50. | Bellingham | 263 | 73,519(0.36%)#50 | 2,580,172(0.01%)#1,213 |
| 51. | Fife | 257 | 73,519(0.35%)#51 | 2,580,172(0.01%)#1,241 |
| 52. | Pasco | 250 | 73,519(0.34%)#52 | 2,580,172(0.01%)#1,267 |
| 53. | Silver Firs | 237 | 73,519(0.32%)#53 | 2,580,172(0.01%)#1,315 |
| 54. | Lake Stevens | 229 | 73,519(0.31%)#54 | 2,580,172(0.01%)#1,349 |
| 55. | Lacey | 225 | 73,519(0.31%)#55 | 2,580,172(0.01%)#1,362 |
| 56. | Lake Forest Park | 219 | 73,519(0.30%)#56 | 2,580,172(0.01%)#1,396 |
| 57. | Graham | 198 | 73,519(0.27%)#57 | 2,580,172(0.01%)#1,476 |
| 58. | Yakima | 194 | 73,519(0.26%)#58 | 2,580,172(0.01%)#1,496 |
| 59. | Camas | 186 | 73,519(0.25%)#59 | 2,580,172(0.01%)#1,545 |
| 60. | Tumwater | 178 | 73,519(0.24%)#60 | 2,580,172(0.01%)#1,585 |
| 61. | Fort Lewis | 162 | 73,519(0.22%)#61 | 2,580,172(0.01%)#1,683 |
| 62. | Bremerton | 158 | 73,519(0.21%)#62 | 2,580,172(0.01%)#1,709 |
| 63. | Mill Creek East | 142 | 73,519(0.19%)#63 | 2,580,172(0.01%)#1,821 |
| 64. | Mill Creek | 139 | 73,519(0.19%)#64 | 2,580,172(0.01%)#1,853 |
| 65. | Bothell West | 137 | 73,519(0.19%)#65 | 2,580,172(0.01%)#1,867 |
| 66. | Brier | 135 | 73,519(0.18%)#66 | 2,580,172(0.01%)#1,892 |
| 67. | Mukilteo | 130 | 73,519(0.18%)#67 | 2,580,172(0.01%)#1,925 |
| 68. | Picnic Point | 124 | 73,519(0.17%)#68 | 2,580,172(0.00%)#1,976 |
| 69. | Camano | 123 | 73,519(0.17%)#69 | 2,580,172(0.00%)#1,986 |
| 70. | Union Hill Novelty Hill | 119 | 73,519(0.16%)#70 | 2,580,172(0.00%)#2,019 |
| 71. | Bothell East | 119 | 73,519(0.16%)#71 | 2,580,172(0.00%)#2,022 |
| 72. | Algona | 109 | 73,519(0.15%)#72 | 2,580,172(0.00%)#2,137 |
| 73. | Bainbridge Island | 107 | 73,519(0.15%)#73 | 2,580,172(0.00%)#2,150 |
| 74. | Mount Vista | 107 | 73,519(0.15%)#74 | 2,580,172(0.00%)#2,152 |
| 75. | Airway Heights | 105 | 73,519(0.14%)#75 | 2,580,172(0.00%)#2,172 |
| 76. | Larch Way | 97 | 73,519(0.13%)#76 | 2,580,172(0.00%)#2,277 |
| 77. | Lynden | 95 | 73,519(0.13%)#77 | 2,580,172(0.00%)#2,299 |
| 78. | Mercer Island | 93 | 73,519(0.13%)#78 | 2,580,172(0.00%)#2,318 |
| 79. | Olympia | 90 | 73,519(0.12%)#79 | 2,580,172(0.00%)#2,353 |
| 80. | Boulevard Park | 89 | 73,519(0.12%)#80 | 2,580,172(0.00%)#2,375 |
| 81. | Arlington | 87 | 73,519(0.12%)#81 | 2,580,172(0.00%)#2,397 |
| 82. | Gold Bar | 86 | 73,519(0.12%)#82 | 2,580,172(0.00%)#2,416 |
| 83. | Fairchild Afb | 84 | 73,519(0.11%)#83 | 2,580,172(0.00%)#2,436 |
| 84. | Maltby | 83 | 73,519(0.11%)#84 | 2,580,172(0.00%)#2,446 |
| 85. | Maple Valley | 81 | 73,519(0.11%)#85 | 2,580,172(0.00%)#2,476 |
| 86. | Steilacoom | 79 | 73,519(0.11%)#86 | 2,580,172(0.00%)#2,515 |
| 87. | Normandy Park | 75 | 73,519(0.10%)#87 | 2,580,172(0.00%)#2,579 |
| 88. | Moxee | 74 | 73,519(0.10%)#88 | 2,580,172(0.00%)#2,602 |
| 89. | Sumner | 69 | 73,519(0.09%)#89 | 2,580,172(0.00%)#2,696 |
| 90. | Yelm | 69 | 73,519(0.09%)#90 | 2,580,172(0.00%)#2,697 |
| 91. | Mount Vernon | 65 | 73,519(0.09%)#91 | 2,580,172(0.00%)#2,774 |
| 92. | Newcastle | 61 | 73,519(0.08%)#92 | 2,580,172(0.00%)#2,869 |
| 93. | Town And Country | 61 | 73,519(0.08%)#93 | 2,580,172(0.00%)#2,875 |
| 94. | Bangor Base | 60 | 73,519(0.08%)#94 | 2,580,172(0.00%)#2,893 |
| 95. | Meadowdale | 56 | 73,519(0.08%)#95 | 2,580,172(0.00%)#2,987 |
| 96. | Ellensburg | 55 | 73,519(0.07%)#96 | 2,580,172(0.00%)#2,999 |
| 97. | Lakeland South | 55 | 73,519(0.07%)#97 | 2,580,172(0.00%)#3,004 |
| 98. | Longview | 54 | 73,519(0.07%)#98 | 2,580,172(0.00%)#3,018 |
| 99. | Salmon Creek | 45 | 73,519(0.06%)#99 | 2,580,172(0.00%)#3,266 |
| 100. | Battle Ground | 43 | 73,519(0.06%)#100 | 2,580,172(0.00%)#3,319 |
Common Questions
What are the Top 10 Cities with the Most Immigrants from Africa in Washington?
Top 10 Cities with the Most Immigrants from Africa in Washington are:
What city has the Most Immigrants from Africa in Washington?
Seattle has the Most Immigrants from Africa in Washington with 15,597.
What is the Total Immigrants from Africa in the State of Washington?
Total Immigrants from Africa in Washington is 73,519.
What is the Total Immigrants from Africa in the United States?
Total Immigrants from Africa in the United States is 2,580,172.