Zip Codes with the Highest Percentage of Population Employed in Food Preparation & Serving in Tacoma, WA
RELATED REPORTS & OPTIONS
Food Preparation & Serving
Tacoma
Compare Zip Codes
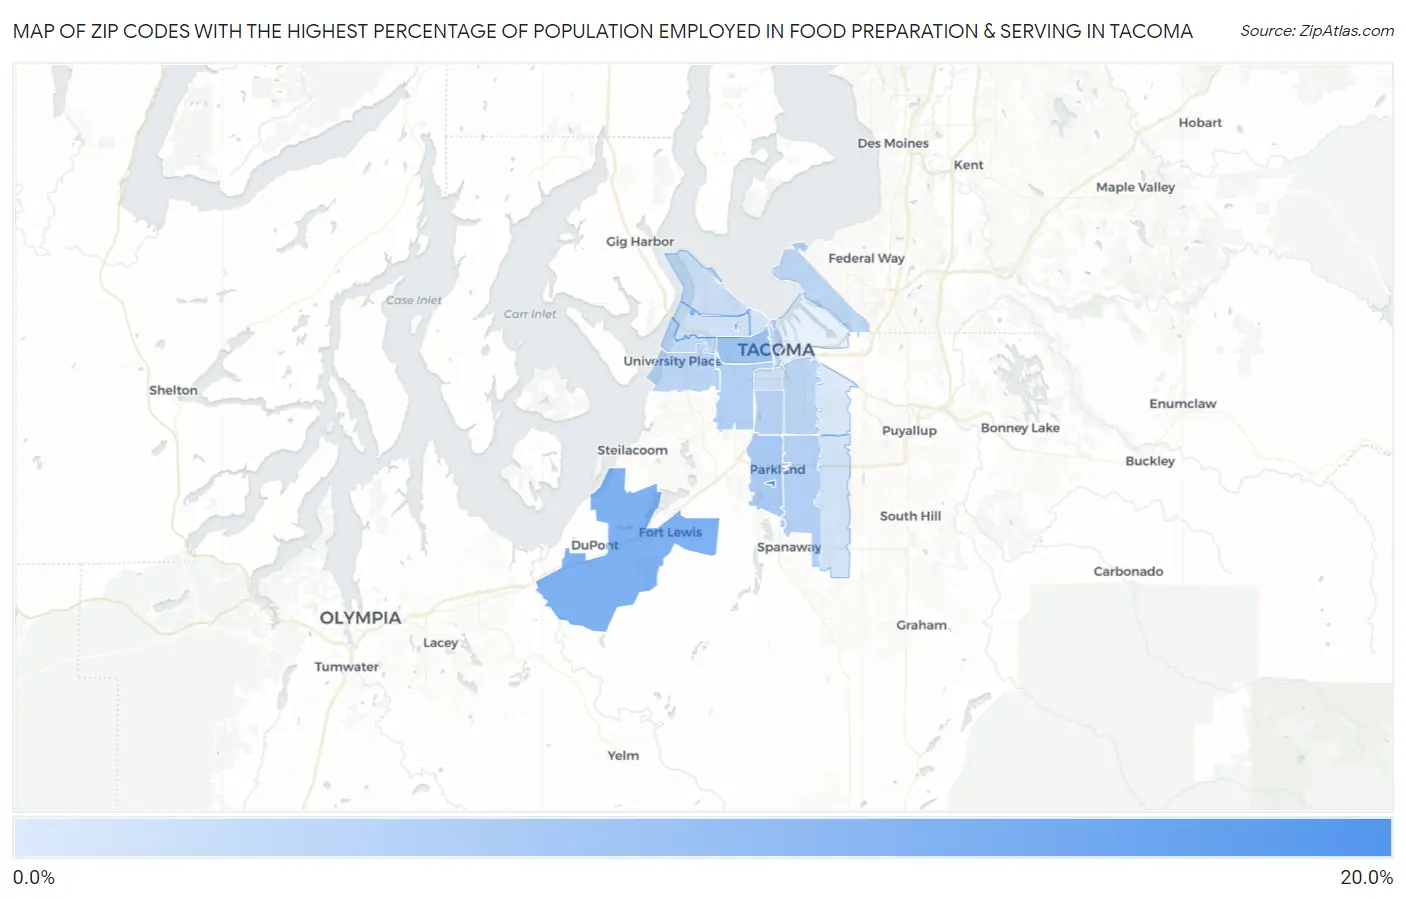
Map of Zip Codes with the Highest Percentage of Population Employed in Food Preparation & Serving in Tacoma
2.6%
16.4%
Zip Codes with the Highest Percentage of Population Employed in Food Preparation & Serving in Tacoma, WA
| Zip Code | % Employed | vs State | vs National | |
| 1. | 98447 | 16.4% | 5.1%(+11.3)#14 | 5.3%(+11.2)#803 |
| 2. | 98433 | 11.0% | 5.1%(+5.90)#38 | 5.3%(+5.75)#2,039 |
| 3. | 98416 | 9.9% | 5.1%(+4.77)#50 | 5.3%(+4.63)#2,693 |
| 4. | 98405 | 8.1% | 5.1%(+2.94)#81 | 5.3%(+2.80)#4,590 |
| 5. | 98444 | 7.0% | 5.1%(+1.86)#110 | 5.3%(+1.72)#6,541 |
| 6. | 98445 | 6.1% | 5.1%(+0.949)#160 | 5.3%(+0.806)#9,053 |
| 7. | 98409 | 6.1% | 5.1%(+0.944)#161 | 5.3%(+0.801)#9,069 |
| 8. | 98408 | 5.9% | 5.1%(+0.745)#168 | 5.3%(+0.602)#9,724 |
| 9. | 98402 | 5.5% | 5.1%(+0.310)#197 | 5.3%(+0.167)#11,214 |
| 10. | 98404 | 5.4% | 5.1%(+0.297)#199 | 5.3%(+0.154)#11,263 |
| 11. | 98466 | 5.3% | 5.1%(+0.190)#211 | 5.3%(+0.047)#11,637 |
| 12. | 98422 | 5.2% | 5.1%(+0.106)#218 | 5.3%(-0.037)#11,962 |
| 13. | 98465 | 4.7% | 5.1%(-0.482)#266 | 5.3%(-0.625)#14,323 |
| 14. | 98407 | 4.0% | 5.1%(-1.14)#318 | 5.3%(-1.29)#17,149 |
| 15. | 98418 | 3.8% | 5.1%(-1.32)#331 | 5.3%(-1.46)#17,842 |
| 16. | 98446 | 3.4% | 5.1%(-1.72)#364 | 5.3%(-1.86)#19,506 |
| 17. | 98406 | 3.4% | 5.1%(-1.76)#367 | 5.3%(-1.90)#19,680 |
| 18. | 98403 | 2.9% | 5.1%(-2.20)#401 | 5.3%(-2.34)#21,466 |
| 19. | 98443 | 2.6% | 5.1%(-2.56)#424 | 5.3%(-2.71)#22,861 |
1
Common Questions
What are the Top 10 Zip Codes with the Highest Percentage of Population Employed in Food Preparation & Serving in Tacoma, WA?
Top 10 Zip Codes with the Highest Percentage of Population Employed in Food Preparation & Serving in Tacoma, WA are:
What zip code has the Highest Percentage of Population Employed in Food Preparation & Serving in Tacoma, WA?
98447 has the Highest Percentage of Population Employed in Food Preparation & Serving in Tacoma, WA with 16.4%.
What is the Percentage of Population Employed in Food Preparation & Serving in Tacoma, WA?
Percentage of Population Employed in Food Preparation & Serving in Tacoma is 5.4%.
What is the Percentage of Population Employed in Food Preparation & Serving in Washington?
Percentage of Population Employed in Food Preparation & Serving in Washington is 5.1%.
What is the Percentage of Population Employed in Food Preparation & Serving in the United States?
Percentage of Population Employed in Food Preparation & Serving in the United States is 5.3%.