Cities with the Highest Percentage of South American Population in Washington
RELATED REPORTS & OPTIONS
South American
Washington
Compare Cities
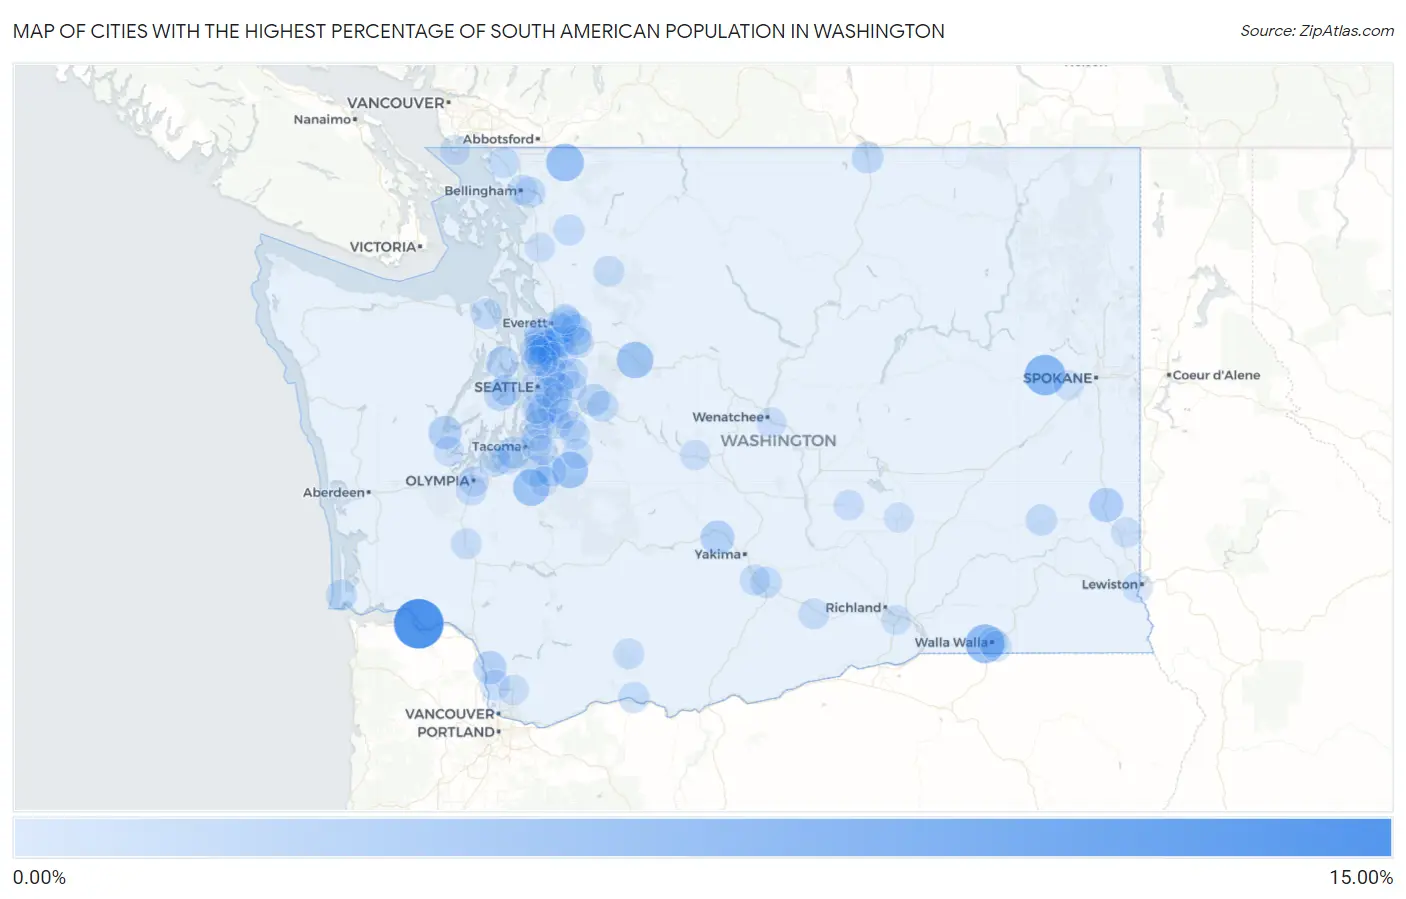
Map of Cities with the Highest Percentage of South American Population in Washington
0.00%
15.00%
Cities with the Highest Percentage of South American Population in Washington
| City | South American | vs State | vs National | |
| 1. | Puget Island | 14.19% | 0.51%(+13.7)#1 | 1.28%(+12.9)#111 |
| 2. | Reardan | 7.69% | 0.51%(+7.19)#2 | 1.28%(+6.41)#320 |
| 3. | Garrett | 6.46% | 0.51%(+5.95)#3 | 1.28%(+5.18)#420 |
| 4. | Maple Falls | 5.63% | 0.51%(+5.12)#4 | 1.28%(+4.34)#521 |
| 5. | South Creek | 4.90% | 0.51%(+4.40)#5 | 1.28%(+3.62)#622 |
| 6. | Baring | 4.85% | 0.51%(+4.35)#6 | 1.28%(+3.57)#631 |
| 7. | Wilkeson | 4.75% | 0.51%(+4.24)#7 | 1.28%(+3.47)#655 |
| 8. | Marine View | 4.17% | 0.51%(+3.66)#8 | 1.28%(+2.88)#806 |
| 9. | Colfax | 3.25% | 0.51%(+2.74)#9 | 1.28%(+1.97)#1,097 |
| 10. | Tieton | 3.10% | 0.51%(+2.60)#10 | 1.28%(+1.82)#1,164 |
| 11. | Skokomish | 2.80% | 0.51%(+2.29)#11 | 1.28%(+1.51)#1,332 |
| 12. | Woodland | 2.61% | 0.51%(+2.11)#12 | 1.28%(+1.33)#1,425 |
| 13. | Larch Way | 2.27% | 0.51%(+1.77)#13 | 1.28%(+0.990)#1,652 |
| 14. | Poulsbo | 2.11% | 0.51%(+1.61)#14 | 1.28%(+0.831)#1,789 |
| 15. | Navy Yard City | 1.93% | 0.51%(+1.42)#15 | 1.28%(+0.646)#1,964 |
| 16. | University Place | 1.87% | 0.51%(+1.37)#16 | 1.28%(+0.590)#2,011 |
| 17. | Snoqualmie | 1.87% | 0.51%(+1.36)#17 | 1.28%(+0.584)#2,018 |
| 18. | Mukilteo | 1.79% | 0.51%(+1.29)#18 | 1.28%(+0.510)#2,102 |
| 19. | Lynnwood | 1.73% | 0.51%(+1.23)#19 | 1.28%(+0.450)#2,165 |
| 20. | Oroville | 1.71% | 0.51%(+1.20)#20 | 1.28%(+0.428)#2,189 |
| 21. | Picnic Point | 1.67% | 0.51%(+1.16)#21 | 1.28%(+0.385)#2,240 |
| 22. | Mill Creek | 1.63% | 0.51%(+1.12)#22 | 1.28%(+0.342)#2,290 |
| 23. | Mountlake Terrace | 1.53% | 0.51%(+1.02)#23 | 1.28%(+0.244)#2,410 |
| 24. | Everett | 1.52% | 0.51%(+1.01)#24 | 1.28%(+0.233)#2,426 |
| 25. | Silver Firs | 1.48% | 0.51%(+0.973)#25 | 1.28%(+0.197)#2,485 |
| 26. | Three Lakes | 1.46% | 0.51%(+0.949)#26 | 1.28%(+0.173)#2,516 |
| 27. | Alderwood Manor | 1.44% | 0.51%(+0.938)#27 | 1.28%(+0.161)#2,530 |
| 28. | Lacrosse | 1.44% | 0.51%(+0.932)#28 | 1.28%(+0.156)#2,539 |
| 29. | Tehaleh | 1.44% | 0.51%(+0.930)#29 | 1.28%(+0.154)#2,548 |
| 30. | Maltby | 1.36% | 0.51%(+0.851)#30 | 1.28%(+0.074)#2,689 |
| 31. | Custer | 1.33% | 0.51%(+0.822)#31 | 1.28%(+0.046)#2,735 |
| 32. | Frederickson | 1.31% | 0.51%(+0.803)#32 | 1.28%(+0.026)#2,761 |
| 33. | Lyman | 1.30% | 0.51%(+0.789)#33 | 1.28%(+0.012)#2,787 |
| 34. | Buena | 1.29% | 0.51%(+0.782)#34 | 1.28%(+0.006)#2,801 |
| 35. | Geneva | 1.29% | 0.51%(+0.781)#35 | 1.28%(+0.005)#2,806 |
| 36. | Enetai | 1.28% | 0.51%(+0.777)#36 | 1.28%(+0.001)#2,811 |
| 37. | Steilacoom | 1.26% | 0.51%(+0.751)#37 | 1.28%(-0.026)#2,855 |
| 38. | Fobes Hill | 1.25% | 0.51%(+0.745)#38 | 1.28%(-0.032)#2,870 |
| 39. | Port Hadlock Irondale | 1.23% | 0.51%(+0.726)#39 | 1.28%(-0.050)#2,901 |
| 40. | North Bend | 1.21% | 0.51%(+0.699)#40 | 1.28%(-0.078)#2,971 |
| 41. | Long Beach | 1.20% | 0.51%(+0.695)#41 | 1.28%(-0.082)#2,984 |
| 42. | Bothell | 1.17% | 0.51%(+0.668)#42 | 1.28%(-0.108)#3,046 |
| 43. | White Salmon | 1.16% | 0.51%(+0.651)#43 | 1.28%(-0.125)#3,080 |
| 44. | Fife Heights | 1.14% | 0.51%(+0.638)#44 | 1.28%(-0.139)#3,113 |
| 45. | Wapato | 1.13% | 0.51%(+0.624)#45 | 1.28%(-0.153)#3,148 |
| 46. | Redmond | 1.11% | 0.51%(+0.600)#46 | 1.28%(-0.176)#3,195 |
| 47. | Swede Heaven | 1.10% | 0.51%(+0.592)#47 | 1.28%(-0.184)#3,214 |
| 48. | Cavalero | 1.10% | 0.51%(+0.591)#48 | 1.28%(-0.185)#3,217 |
| 49. | Roche Harbor | 1.06% | 0.51%(+0.556)#49 | 1.28%(-0.221)#3,311 |
| 50. | Anderson Island | 1.05% | 0.51%(+0.542)#50 | 1.28%(-0.234)#3,340 |
| 51. | Tumwater | 1.03% | 0.51%(+0.528)#51 | 1.28%(-0.249)#3,370 |
| 52. | Chehalis | 1.00% | 0.51%(+0.492)#52 | 1.28%(-0.285)#3,450 |
| 53. | Walla Walla East | 0.99% | 0.51%(+0.479)#53 | 1.28%(-0.297)#3,480 |
| 54. | Trout Lake | 0.97% | 0.51%(+0.467)#54 | 1.28%(-0.310)#3,519 |
| 55. | Union Hill Novelty Hill | 0.96% | 0.51%(+0.456)#55 | 1.28%(-0.321)#3,562 |
| 56. | Orting | 0.96% | 0.51%(+0.449)#56 | 1.28%(-0.328)#3,584 |
| 57. | Monroe | 0.93% | 0.51%(+0.420)#57 | 1.28%(-0.356)#3,663 |
| 58. | Grandview | 0.91% | 0.51%(+0.400)#58 | 1.28%(-0.377)#3,730 |
| 59. | Monroe North | 0.90% | 0.51%(+0.398)#59 | 1.28%(-0.379)#3,737 |
| 60. | Clyde Hill | 0.90% | 0.51%(+0.394)#60 | 1.28%(-0.382)#3,747 |
| 61. | Federal Way | 0.89% | 0.51%(+0.388)#61 | 1.28%(-0.389)#3,771 |
| 62. | Renton | 0.89% | 0.51%(+0.386)#62 | 1.28%(-0.390)#3,779 |
| 63. | Ridgefield | 0.89% | 0.51%(+0.381)#63 | 1.28%(-0.395)#3,791 |
| 64. | Tukwila | 0.88% | 0.51%(+0.374)#64 | 1.28%(-0.402)#3,811 |
| 65. | Seattle | 0.88% | 0.51%(+0.369)#65 | 1.28%(-0.408)#3,824 |
| 66. | Olympia | 0.84% | 0.51%(+0.329)#66 | 1.28%(-0.447)#3,926 |
| 67. | Sammamish | 0.83% | 0.51%(+0.322)#67 | 1.28%(-0.454)#3,952 |
| 68. | Royal City | 0.83% | 0.51%(+0.319)#68 | 1.28%(-0.458)#3,966 |
| 69. | Kirkland | 0.81% | 0.51%(+0.307)#69 | 1.28%(-0.469)#3,992 |
| 70. | Fairwood Cdp King County | 0.80% | 0.51%(+0.294)#70 | 1.28%(-0.483)#4,037 |
| 71. | Maple Valley | 0.80% | 0.51%(+0.293)#71 | 1.28%(-0.484)#4,043 |
| 72. | South Wenatchee | 0.79% | 0.51%(+0.283)#72 | 1.28%(-0.494)#4,092 |
| 73. | Lake Forest Park | 0.79% | 0.51%(+0.281)#73 | 1.28%(-0.496)#4,100 |
| 74. | West Clarkston Highland | 0.77% | 0.51%(+0.266)#74 | 1.28%(-0.510)#4,148 |
| 75. | Kent | 0.76% | 0.51%(+0.255)#75 | 1.28%(-0.521)#4,187 |
| 76. | Shelton | 0.75% | 0.51%(+0.247)#76 | 1.28%(-0.530)#4,216 |
| 77. | Bellingham | 0.75% | 0.51%(+0.243)#77 | 1.28%(-0.533)#4,229 |
| 78. | Enumclaw | 0.74% | 0.51%(+0.238)#78 | 1.28%(-0.539)#4,251 |
| 79. | Pullman | 0.74% | 0.51%(+0.235)#79 | 1.28%(-0.542)#4,264 |
| 80. | Des Moines | 0.73% | 0.51%(+0.225)#80 | 1.28%(-0.552)#4,290 |
| 81. | Edmonds | 0.73% | 0.51%(+0.224)#81 | 1.28%(-0.553)#4,298 |
| 82. | Cle Elum | 0.71% | 0.51%(+0.202)#82 | 1.28%(-0.574)#4,382 |
| 83. | Seatac | 0.69% | 0.51%(+0.185)#83 | 1.28%(-0.591)#4,452 |
| 84. | Bellevue | 0.69% | 0.51%(+0.184)#84 | 1.28%(-0.593)#4,458 |
| 85. | Edgewood | 0.69% | 0.51%(+0.179)#85 | 1.28%(-0.597)#4,474 |
| 86. | Walla Walla | 0.69% | 0.51%(+0.179)#86 | 1.28%(-0.598)#4,477 |
| 87. | Burien | 0.69% | 0.51%(+0.179)#87 | 1.28%(-0.598)#4,479 |
| 88. | Newcastle | 0.68% | 0.51%(+0.174)#88 | 1.28%(-0.603)#4,503 |
| 89. | Point Roberts | 0.64% | 0.51%(+0.134)#89 | 1.28%(-0.643)#4,665 |
| 90. | Fairchild Afb | 0.63% | 0.51%(+0.121)#90 | 1.28%(-0.655)#4,713 |
| 91. | Mercer Island | 0.62% | 0.51%(+0.114)#91 | 1.28%(-0.663)#4,741 |
| 92. | Battle Ground | 0.61% | 0.51%(+0.101)#92 | 1.28%(-0.675)#4,789 |
| 93. | Lake Stevens | 0.59% | 0.51%(+0.086)#93 | 1.28%(-0.691)#4,847 |
| 94. | Graham | 0.59% | 0.51%(+0.086)#94 | 1.28%(-0.691)#4,848 |
| 95. | Maple Heights Lake Desire | 0.58% | 0.51%(+0.075)#95 | 1.28%(-0.701)#4,899 |
| 96. | Shoreline | 0.57% | 0.51%(+0.068)#96 | 1.28%(-0.709)#4,928 |
| 97. | Othello | 0.57% | 0.51%(+0.064)#97 | 1.28%(-0.712)#4,947 |
| 98. | Mount Vernon | 0.57% | 0.51%(+0.063)#98 | 1.28%(-0.714)#4,961 |
| 99. | Kennewick | 0.57% | 0.51%(+0.062)#99 | 1.28%(-0.714)#4,964 |
| 100. | Black Diamond | 0.56% | 0.51%(+0.058)#100 | 1.28%(-0.719)#4,988 |
Common Questions
What are the Top 10 Cities with the Highest Percentage of South American Population in Washington?
Top 10 Cities with the Highest Percentage of South American Population in Washington are:
#1
14.19%
#2
7.69%
#3
6.46%
#4
5.63%
#5
4.90%
#6
4.85%
#7
4.75%
#8
3.25%
#9
3.10%
#10
2.80%
What city has the Highest Percentage of South American Population in Washington?
Puget Island has the Highest Percentage of South American Population in Washington with 14.19%.
What is the Percentage of South American Population in the State of Washington?
Percentage of South American Population in Washington is 0.51%.
What is the Percentage of South American Population in the United States?
Percentage of South American Population in the United States is 1.28%.