Cities with the Highest Poverty Level Among Seniors Over the Age of 65 in Washington
RELATED REPORTS & OPTIONS
Highest Poverty | Seniors 65+
Washington
Compare Cities
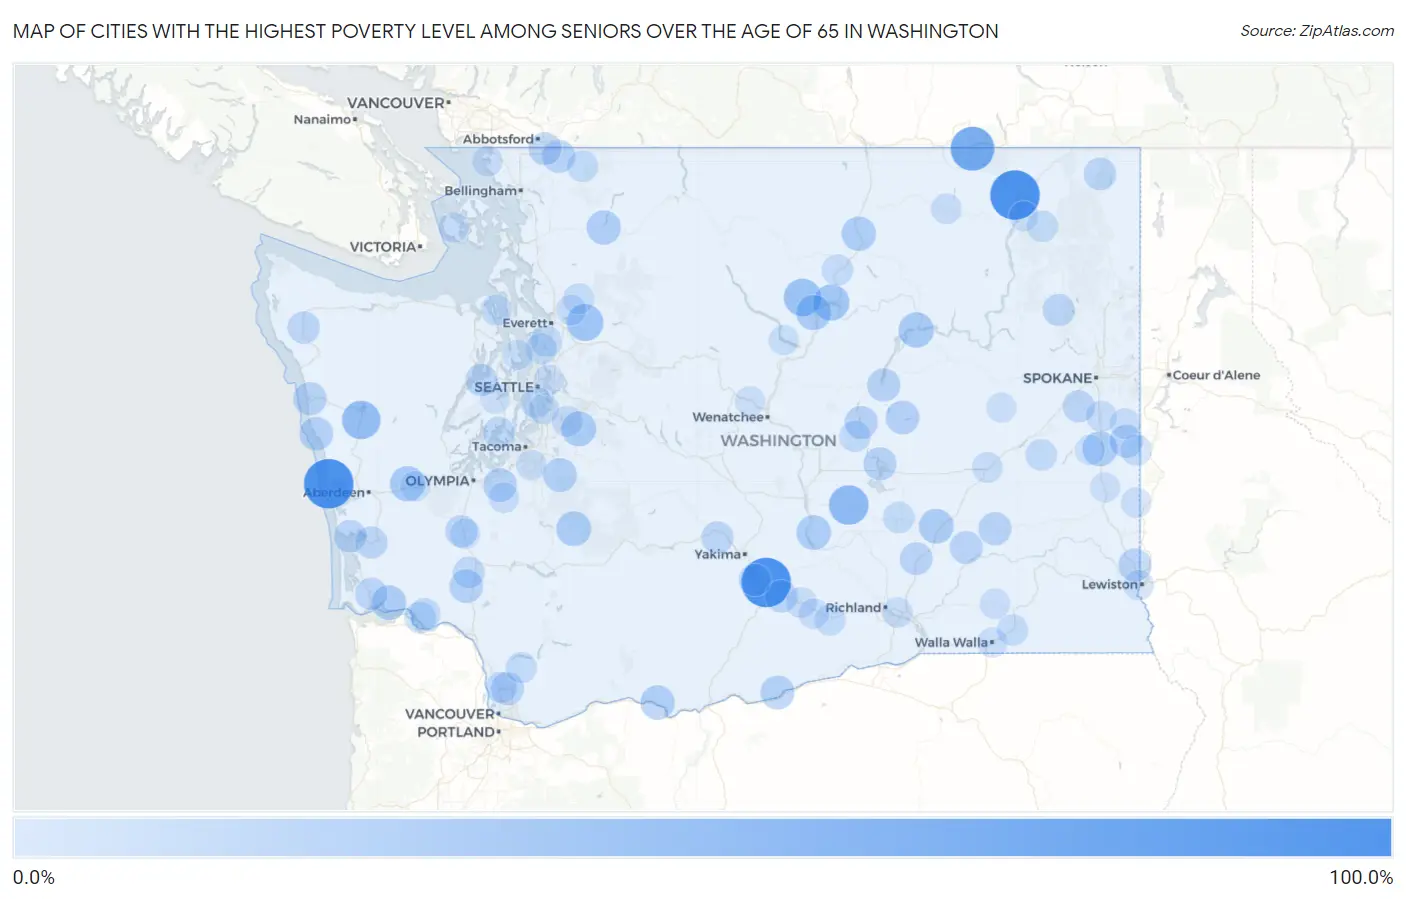
Map of Cities with the Highest Poverty Level Among Seniors Over the Age of 65 in Washington
0.0%
100.0%
Cities with the Highest Poverty Level Among Seniors Over the Age of 65 in Washington
| City | Senior Poverty | vs State | vs National | |
| 1. | Buena | 100.0% | 8.1%(+91.9)#1 | 10.0%(+90.0)#22 |
| 2. | Oyehut | 100.0% | 8.1%(+91.9)#2 | 10.0%(+90.0)#160 |
| 3. | Boyds | 100.0% | 8.1%(+91.9)#3 | 10.0%(+90.0)#183 |
| 4. | Danville | 73.7% | 8.1%(+65.6)#4 | 10.0%(+63.7)#331 |
| 5. | Royal City | 54.5% | 8.1%(+46.5)#5 | 10.0%(+44.6)#622 |
| 6. | Neilton | 49.2% | 8.1%(+41.1)#6 | 10.0%(+39.3)#820 |
| 7. | Methow | 45.5% | 8.1%(+37.4)#7 | 10.0%(+35.5)#962 |
| 8. | Lake Roesiger | 42.2% | 8.1%(+34.1)#8 | 10.0%(+32.2)#1,113 |
| 9. | Brewster | 39.4% | 8.1%(+31.4)#9 | 10.0%(+29.5)#1,284 |
| 10. | Satsop | 35.6% | 8.1%(+27.5)#10 | 10.0%(+25.6)#1,594 |
| 11. | Pateros | 35.4% | 8.1%(+27.3)#11 | 10.0%(+25.5)#1,605 |
| 12. | Grand Coulee | 35.3% | 8.1%(+27.3)#12 | 10.0%(+25.4)#1,613 |
| 13. | Ravensdale | 34.2% | 8.1%(+26.1)#13 | 10.0%(+24.3)#1,701 |
| 14. | Rosalia | 34.1% | 8.1%(+26.1)#14 | 10.0%(+24.2)#1,706 |
| 15. | Ashford | 33.6% | 8.1%(+25.5)#15 | 10.0%(+23.6)#1,740 |
| 16. | Hatton | 33.3% | 8.1%(+25.3)#16 | 10.0%(+23.4)#1,760 |
| 17. | Rosburg | 32.9% | 8.1%(+24.8)#17 | 10.0%(+23.0)#1,852 |
| 18. | Mattawa | 32.9% | 8.1%(+24.8)#18 | 10.0%(+22.9)#1,855 |
| 19. | Riverside | 32.0% | 8.1%(+23.9)#19 | 10.0%(+22.0)#1,934 |
| 20. | Lyle | 31.6% | 8.1%(+23.5)#20 | 10.0%(+21.6)#2,004 |
| 21. | Concrete | 30.9% | 8.1%(+22.8)#21 | 10.0%(+20.9)#2,088 |
| 22. | Roosevelt | 29.4% | 8.1%(+21.3)#22 | 10.0%(+19.5)#2,297 |
| 23. | Crocker | 29.0% | 8.1%(+20.9)#23 | 10.0%(+19.1)#2,352 |
| 24. | Wilson Creek | 28.8% | 8.1%(+20.7)#24 | 10.0%(+18.9)#2,390 |
| 25. | Taholah | 28.6% | 8.1%(+20.5)#25 | 10.0%(+18.6)#2,422 |
| 26. | Vader | 28.2% | 8.1%(+20.1)#26 | 10.0%(+18.3)#2,501 |
| 27. | Nisqually Indian Community | 27.5% | 8.1%(+19.4)#27 | 10.0%(+17.5)#2,642 |
| 28. | Peaceful Valley | 27.3% | 8.1%(+19.2)#28 | 10.0%(+17.3)#2,667 |
| 29. | Queets | 27.3% | 8.1%(+19.2)#29 | 10.0%(+17.3)#2,685 |
| 30. | Cascade Valley | 26.6% | 8.1%(+18.6)#30 | 10.0%(+16.7)#2,795 |
| 31. | Coulee City | 26.6% | 8.1%(+18.5)#31 | 10.0%(+16.6)#2,806 |
| 32. | Washtucna | 26.5% | 8.1%(+18.4)#32 | 10.0%(+16.5)#2,829 |
| 33. | Uniontown | 26.3% | 8.1%(+18.2)#33 | 10.0%(+16.4)#2,856 |
| 34. | Latah | 26.3% | 8.1%(+18.2)#34 | 10.0%(+16.4)#2,861 |
| 35. | Soap Lake | 26.3% | 8.1%(+18.2)#35 | 10.0%(+16.3)#2,866 |
| 36. | Dollars Corner | 25.8% | 8.1%(+17.7)#36 | 10.0%(+15.9)#2,958 |
| 37. | Sumas | 25.4% | 8.1%(+17.3)#37 | 10.0%(+15.4)#3,082 |
| 38. | Mesa | 25.0% | 8.1%(+16.9)#38 | 10.0%(+15.0)#3,149 |
| 39. | Kahlotus | 25.0% | 8.1%(+16.9)#39 | 10.0%(+15.0)#3,192 |
| 40. | Metaline | 24.3% | 8.1%(+16.2)#40 | 10.0%(+14.4)#3,359 |
| 41. | Granger | 24.3% | 8.1%(+16.2)#41 | 10.0%(+14.4)#3,365 |
| 42. | Tokeland | 23.7% | 8.1%(+15.6)#42 | 10.0%(+13.7)#3,526 |
| 43. | Wapato | 23.1% | 8.1%(+15.1)#43 | 10.0%(+13.2)#3,682 |
| 44. | Forks | 22.9% | 8.1%(+14.9)#44 | 10.0%(+13.0)#3,746 |
| 45. | Tieton | 22.8% | 8.1%(+14.7)#45 | 10.0%(+12.9)#3,787 |
| 46. | Cheney | 22.4% | 8.1%(+14.3)#46 | 10.0%(+12.4)#3,896 |
| 47. | Naselle | 22.4% | 8.1%(+14.3)#47 | 10.0%(+12.4)#3,901 |
| 48. | Fords Prairie | 22.3% | 8.1%(+14.2)#48 | 10.0%(+12.4)#3,912 |
| 49. | Seabeck | 22.2% | 8.1%(+14.1)#49 | 10.0%(+12.2)#3,980 |
| 50. | South Bend | 22.1% | 8.1%(+14.1)#50 | 10.0%(+12.2)#3,985 |
| 51. | Springdale | 21.7% | 8.1%(+13.7)#51 | 10.0%(+11.8)#4,091 |
| 52. | Winlock | 20.8% | 8.1%(+12.7)#52 | 10.0%(+10.8)#4,420 |
| 53. | Raft Island | 20.7% | 8.1%(+12.6)#53 | 10.0%(+10.7)#4,471 |
| 54. | Lamont | 20.0% | 8.1%(+11.9)#54 | 10.0%(+10.0)#4,754 |
| 55. | Duluth | 19.6% | 8.1%(+11.6)#55 | 10.0%(+9.70)#4,927 |
| 56. | Lake Stickney | 19.4% | 8.1%(+11.4)#56 | 10.0%(+9.49)#5,019 |
| 57. | Othello | 19.4% | 8.1%(+11.3)#57 | 10.0%(+9.45)#5,040 |
| 58. | Lower Elochoman | 19.4% | 8.1%(+11.3)#58 | 10.0%(+9.40)#5,056 |
| 59. | Upper Elochoman | 18.9% | 8.1%(+10.8)#59 | 10.0%(+8.97)#5,250 |
| 60. | Ephrata | 18.9% | 8.1%(+10.8)#60 | 10.0%(+8.96)#5,251 |
| 61. | Colville | 18.8% | 8.1%(+10.7)#61 | 10.0%(+8.84)#5,286 |
| 62. | Malott | 18.8% | 8.1%(+10.7)#62 | 10.0%(+8.83)#5,290 |
| 63. | Lynnwood | 18.7% | 8.1%(+10.7)#63 | 10.0%(+8.78)#5,321 |
| 64. | Glacier | 18.4% | 8.1%(+10.3)#64 | 10.0%(+8.47)#5,462 |
| 65. | White Center | 18.3% | 8.1%(+10.3)#65 | 10.0%(+8.39)#5,496 |
| 66. | Dixie | 18.2% | 8.1%(+10.1)#66 | 10.0%(+8.23)#5,580 |
| 67. | Marrowstone | 17.9% | 8.1%(+9.86)#67 | 10.0%(+7.98)#5,696 |
| 68. | Amboy | 17.8% | 8.1%(+9.74)#68 | 10.0%(+7.87)#5,752 |
| 69. | Prosser | 17.7% | 8.1%(+9.64)#69 | 10.0%(+7.77)#5,805 |
| 70. | Tekoa | 17.6% | 8.1%(+9.48)#70 | 10.0%(+7.61)#5,903 |
| 71. | Spangle | 17.3% | 8.1%(+9.26)#71 | 10.0%(+7.38)#6,034 |
| 72. | Fairfield | 17.3% | 8.1%(+9.23)#72 | 10.0%(+7.36)#6,041 |
| 73. | Canyon Creek | 17.2% | 8.1%(+9.12)#73 | 10.0%(+7.24)#6,112 |
| 74. | Shadow Lake | 17.0% | 8.1%(+8.89)#74 | 10.0%(+7.01)#6,245 |
| 75. | Yelm | 16.6% | 8.1%(+8.54)#75 | 10.0%(+6.67)#6,473 |
| 76. | Ritzville | 16.6% | 8.1%(+8.54)#76 | 10.0%(+6.66)#6,477 |
| 77. | Sunnyside | 16.3% | 8.1%(+8.17)#77 | 10.0%(+6.30)#6,679 |
| 78. | Republic | 16.0% | 8.1%(+7.94)#78 | 10.0%(+6.06)#6,828 |
| 79. | Tukwila | 16.0% | 8.1%(+7.88)#79 | 10.0%(+6.01)#6,871 |
| 80. | Hunts Point | 15.8% | 8.1%(+7.76)#80 | 10.0%(+5.88)#6,942 |
| 81. | West Pasco | 15.6% | 8.1%(+7.53)#81 | 10.0%(+5.66)#7,087 |
| 82. | Grandview | 15.5% | 8.1%(+7.45)#82 | 10.0%(+5.57)#7,132 |
| 83. | Prescott | 15.5% | 8.1%(+7.44)#83 | 10.0%(+5.57)#7,144 |
| 84. | Lochsloy | 15.5% | 8.1%(+7.41)#84 | 10.0%(+5.53)#7,162 |
| 85. | Palouse | 15.2% | 8.1%(+7.11)#85 | 10.0%(+5.24)#7,359 |
| 86. | Centralia | 14.9% | 8.1%(+6.78)#86 | 10.0%(+4.91)#7,606 |
| 87. | Birch Bay | 14.9% | 8.1%(+6.78)#87 | 10.0%(+4.91)#7,607 |
| 88. | Clover Creek | 14.8% | 8.1%(+6.72)#88 | 10.0%(+4.85)#7,649 |
| 89. | Manson | 14.6% | 8.1%(+6.51)#89 | 10.0%(+4.64)#7,782 |
| 90. | Clarkston | 14.6% | 8.1%(+6.48)#90 | 10.0%(+4.60)#7,804 |
| 91. | Friday Harbor | 14.5% | 8.1%(+6.44)#91 | 10.0%(+4.57)#7,833 |
| 92. | Kingston | 14.5% | 8.1%(+6.44)#92 | 10.0%(+4.56)#7,843 |
| 93. | Harrington | 14.4% | 8.1%(+6.34)#93 | 10.0%(+4.46)#7,900 |
| 94. | Elma | 14.2% | 8.1%(+6.12)#94 | 10.0%(+4.25)#8,104 |
| 95. | Walla Walla | 14.1% | 8.1%(+6.02)#95 | 10.0%(+4.15)#8,184 |
| 96. | Cashmere | 14.1% | 8.1%(+6.02)#96 | 10.0%(+4.14)#8,186 |
| 97. | Bremerton | 14.0% | 8.1%(+5.90)#97 | 10.0%(+4.03)#8,273 |
| 98. | Kettle Falls | 13.9% | 8.1%(+5.86)#98 | 10.0%(+3.99)#8,303 |
| 99. | Steptoe | 13.9% | 8.1%(+5.81)#99 | 10.0%(+3.94)#8,361 |
| 100. | Malden | 13.8% | 8.1%(+5.72)#100 | 10.0%(+3.84)#8,446 |
Common Questions
What are the Top 10 Cities with the Highest Poverty Level Among Seniors Over the Age of 65 in Washington?
Top 10 Cities with the Highest Poverty Level Among Seniors Over the Age of 65 in Washington are:
#1
100.0%
#2
100.0%
#3
100.0%
#4
73.7%
#5
54.5%
#6
49.2%
#7
45.5%
#8
42.2%
#9
39.4%
#10
35.6%
What city has the Highest Poverty Level Among Seniors Over the Age of 65 in Washington?
Buena has the Highest Poverty Level Among Seniors Over the Age of 65 in Washington with 100.0%.
What is the Poverty Level Among Seniors Over the Age of 65 in the State of Washington?
Poverty Level Among Seniors Over the Age of 65 in Washington is 8.1%.
What is the Poverty Level Among Seniors Over the Age of 65 in the United States?
Poverty Level Among Seniors Over the Age of 65 in the United States is 10.0%.