Tanglewilde, WA Map & Demographics
Tanglewilde Map
Tanglewilde Overview
$32,993
PER CAPITA INCOME
$94,024
AVG FAMILY INCOME
$92,123
AVG HOUSEHOLD INCOME
35.8%
WAGE / INCOME GAP [ % ]
64.2¢/ $1
WAGE / INCOME GAP [ $ ]
0.31
INEQUALITY / GINI INDEX
6,407
TOTAL POPULATION
2,891
MALE POPULATION
3,516
FEMALE POPULATION
82.22
MALES / 100 FEMALES
121.62
FEMALES / 100 MALES
38.5
MEDIAN AGE
2.9
AVG FAMILY SIZE
2.6
AVG HOUSEHOLD SIZE
3,086
LABOR FORCE [ PEOPLE ]
61.9%
PERCENT IN LABOR FORCE
9.9%
UNEMPLOYMENT RATE
Income in Tanglewilde
Income Overview in Tanglewilde
Per Capita Income in Tanglewilde is $32,993, while median incomes of families and households are $94,024 and $92,123 respectively.
| Characteristic | Number | Measure |
| Per Capita Income | 6,407 | $32,993 |
| Median Family Income | 1,884 | $94,024 |
| Mean Family Income | 1,884 | $96,924 |
| Median Household Income | 2,396 | $92,123 |
| Mean Household Income | 2,396 | $92,746 |
| Income Deficit | 1,884 | $0 |
| Wage / Income Gap (%) | 6,407 | 35.85% |
| Wage / Income Gap ($) | 6,407 | 64.15¢ per $1 |
| Gini / Inequality Index | 6,407 | 0.31 |
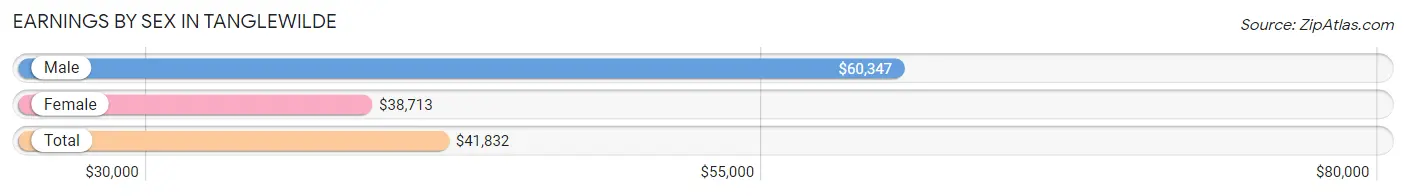
Earnings by Sex in Tanglewilde
Average Earnings in Tanglewilde are $41,832, $60,347 for men and $38,713 for women, a difference of 35.8%.
| Sex | Number | Average Earnings |
| Male | 1,681 (53.2%) | $60,347 |
| Female | 1,476 (46.8%) | $38,713 |
| Total | 3,157 (100.0%) | $41,832 |
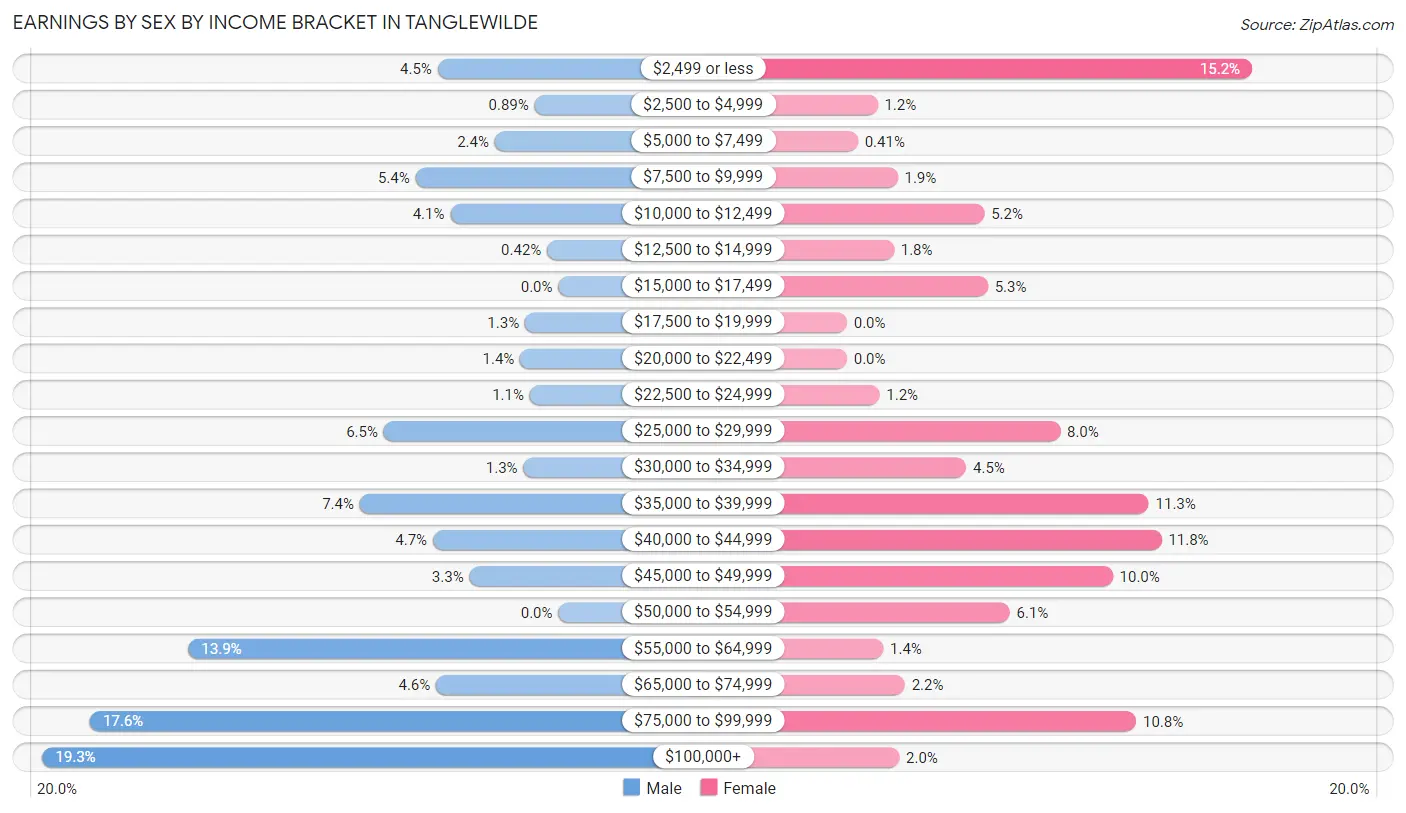
Earnings by Sex by Income Bracket in Tanglewilde
The most common earnings brackets in Tanglewilde are $100,000+ for men (325 | 19.3%) and $2,499 or less for women (224 | 15.2%).
| Income | Male | Female |
| $2,499 or less | 76 (4.5%) | 224 (15.2%) |
| $2,500 to $4,999 | 15 (0.9%) | 17 (1.1%) |
| $5,000 to $7,499 | 40 (2.4%) | 6 (0.4%) |
| $7,500 to $9,999 | 90 (5.3%) | 28 (1.9%) |
| $10,000 to $12,499 | 68 (4.1%) | 76 (5.1%) |
| $12,500 to $14,999 | 7 (0.4%) | 26 (1.8%) |
| $15,000 to $17,499 | 0 (0.0%) | 78 (5.3%) |
| $17,500 to $19,999 | 21 (1.3%) | 0 (0.0%) |
| $20,000 to $22,499 | 24 (1.4%) | 0 (0.0%) |
| $22,500 to $24,999 | 18 (1.1%) | 18 (1.2%) |
| $25,000 to $29,999 | 110 (6.5%) | 118 (8.0%) |
| $30,000 to $34,999 | 22 (1.3%) | 66 (4.5%) |
| $35,000 to $39,999 | 125 (7.4%) | 167 (11.3%) |
| $40,000 to $44,999 | 79 (4.7%) | 174 (11.8%) |
| $45,000 to $49,999 | 56 (3.3%) | 147 (10.0%) |
| $50,000 to $54,999 | 0 (0.0%) | 90 (6.1%) |
| $55,000 to $64,999 | 233 (13.9%) | 20 (1.4%) |
| $65,000 to $74,999 | 77 (4.6%) | 32 (2.2%) |
| $75,000 to $99,999 | 295 (17.5%) | 160 (10.8%) |
| $100,000+ | 325 (19.3%) | 29 (2.0%) |
| Total | 1,681 (100.0%) | 1,476 (100.0%) |
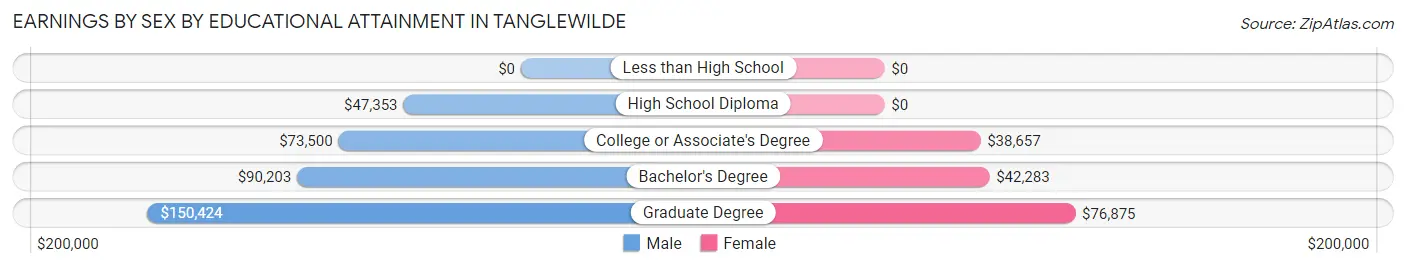
Earnings by Sex by Educational Attainment in Tanglewilde
Average earnings in Tanglewilde are $62,500 for men and $39,880 for women, a difference of 36.2%. Men with an educational attainment of graduate degree enjoy the highest average annual earnings of $150,424, while those with high school diploma education earn the least with $47,353. Women with an educational attainment of graduate degree earn the most with the average annual earnings of $76,875, while those with college or associate's degree education have the smallest earnings of $38,657.
| Educational Attainment | Male Income | Female Income |
| Less than High School | - | - |
| High School Diploma | $47,353 | $0 |
| College or Associate's Degree | $73,500 | $38,657 |
| Bachelor's Degree | $90,203 | $42,283 |
| Graduate Degree | $150,424 | $76,875 |
| Total | $62,500 | $39,880 |
Family Income in Tanglewilde
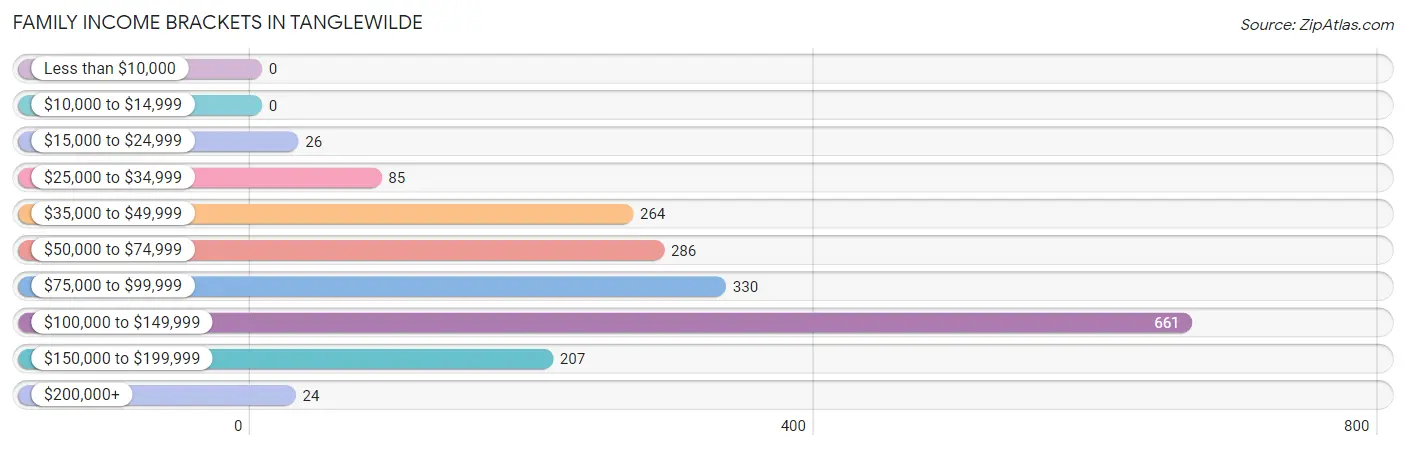
Family Income Brackets in Tanglewilde
According to the Tanglewilde family income data, there are 661 families falling into the $100,000 to $149,999 income range, which is the most common income bracket and makes up 35.1% of all families.
| Income Bracket | # Families | % Families |
| Less than $10,000 | 0 | 0.0% |
| $10,000 to $14,999 | 0 | 0.0% |
| $15,000 to $24,999 | 26 | 1.4% |
| $25,000 to $34,999 | 85 | 4.5% |
| $35,000 to $49,999 | 264 | 14.0% |
| $50,000 to $74,999 | 286 | 15.2% |
| $75,000 to $99,999 | 330 | 17.5% |
| $100,000 to $149,999 | 661 | 35.1% |
| $150,000 to $199,999 | 207 | 11.0% |
| $200,000+ | 24 | 1.3% |
Family Income by Famaliy Size in Tanglewilde
5-person families (213 | 11.3%) account for the highest median family income in Tanglewilde with $136,958 per family, while 2-person families (654 | 34.7%) have the highest median income of $53,334 per family member.

| Income Bracket | # Families | Median Income |
| 2-Person Families | 654 (34.7%) | $106,667 |
| 3-Person Families | 647 (34.3%) | $67,250 |
| 4-Person Families | 357 (19.0%) | $93,826 |
| 5-Person Families | 213 (11.3%) | $136,958 |
| 6-Person Families | 13 (0.7%) | $0 |
| 7+ Person Families | 0 (0.0%) | $0 |
| Total | 1,884 (100.0%) | $94,024 |
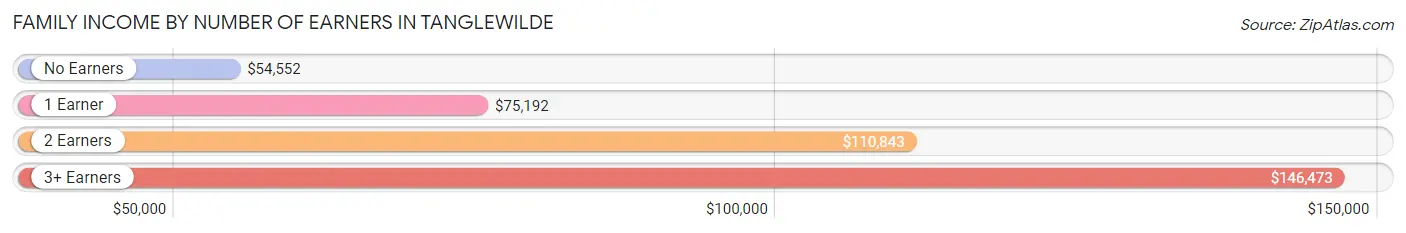
Family Income by Number of Earners in Tanglewilde
The median family income in Tanglewilde is $94,024, with families comprising 3+ earners (175) having the highest median family income of $146,473, while families with no earners (381) have the lowest median family income of $54,552, accounting for 9.3% and 20.2% of families, respectively.
| Number of Earners | # Families | Median Income |
| No Earners | 381 (20.2%) | $54,552 |
| 1 Earner | 562 (29.8%) | $75,192 |
| 2 Earners | 766 (40.7%) | $110,843 |
| 3+ Earners | 175 (9.3%) | $146,473 |
| Total | 1,884 (100.0%) | $94,024 |
Household Income in Tanglewilde
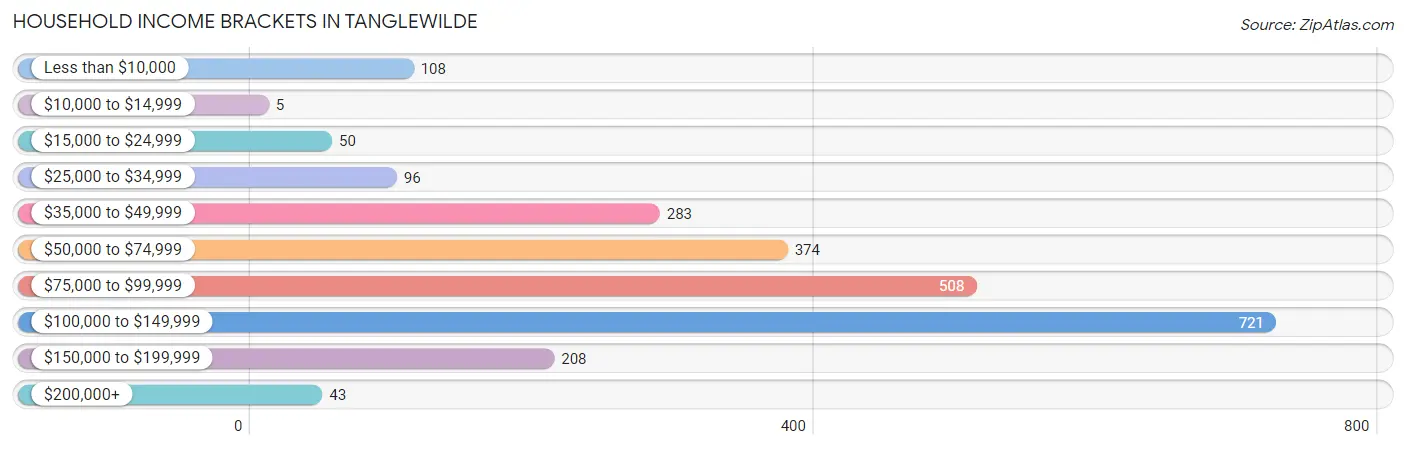
Household Income Brackets in Tanglewilde
With 721 households falling in the category, the $100,000 to $149,999 income range is the most frequent in Tanglewilde, accounting for 30.1% of all households. In contrast, only 5 households (0.2%) fall into the $10,000 to $14,999 income bracket, making it the least populous group.
| Income Bracket | # Households | % Households |
| Less than $10,000 | 108 | 4.5% |
| $10,000 to $14,999 | 5 | 0.2% |
| $15,000 to $24,999 | 50 | 2.1% |
| $25,000 to $34,999 | 96 | 4.0% |
| $35,000 to $49,999 | 283 | 11.8% |
| $50,000 to $74,999 | 374 | 15.6% |
| $75,000 to $99,999 | 508 | 21.2% |
| $100,000 to $149,999 | 721 | 30.1% |
| $150,000 to $199,999 | 208 | 8.7% |
| $200,000+ | 43 | 1.8% |
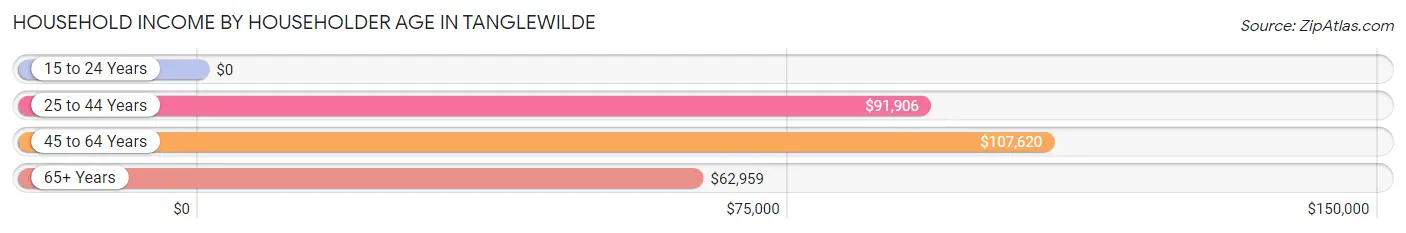
Household Income by Householder Age in Tanglewilde
The median household income in Tanglewilde is $92,123, with the highest median household income of $107,620 found in the 45 to 64 years age bracket for the primary householder. A total of 1,017 households (42.4%) fall into this category. Meanwhile, the 15 to 24 years age bracket for the primary householder has the lowest median household income of $0, with 172 households (7.2%) in this group.
| Income Bracket | # Households | Median Income |
| 15 to 24 Years | 172 (7.2%) | $0 |
| 25 to 44 Years | 719 (30.0%) | $91,906 |
| 45 to 64 Years | 1,017 (42.4%) | $107,620 |
| 65+ Years | 488 (20.4%) | $62,959 |
| Total | 2,396 (100.0%) | $92,123 |
Poverty in Tanglewilde
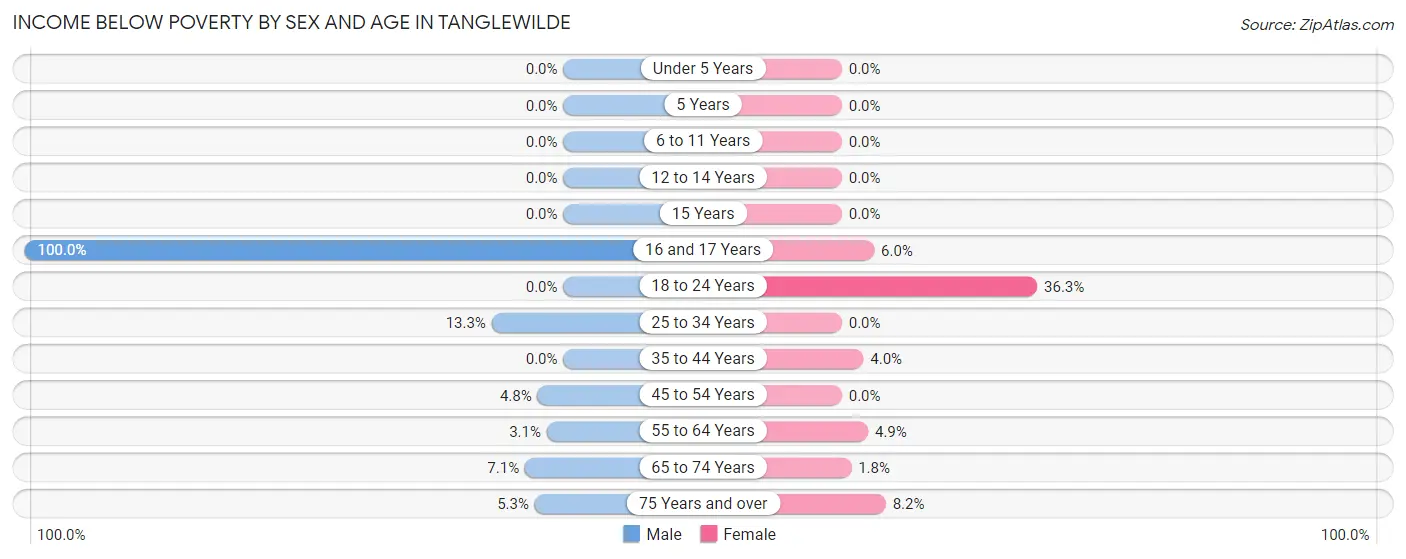
Income Below Poverty by Sex and Age in Tanglewilde
With 4.2% poverty level for males and 6.4% for females among the residents of Tanglewilde, 16 and 17 year old males and 18 to 24 year old females are the most vulnerable to poverty, with 12 males (100.0%) and 141 females (36.2%) in their respective age groups living below the poverty level.
| Age Bracket | Male | Female |
| Under 5 Years | 0 (0.0%) | 0 (0.0%) |
| 5 Years | 0 (0.0%) | 0 (0.0%) |
| 6 to 11 Years | 0 (0.0%) | 0 (0.0%) |
| 12 to 14 Years | 0 (0.0%) | 0 (0.0%) |
| 15 Years | 0 (0.0%) | 0 (0.0%) |
| 16 and 17 Years | 12 (100.0%) | 6 (6.0%) |
| 18 to 24 Years | 0 (0.0%) | 141 (36.2%) |
| 25 to 34 Years | 48 (13.3%) | 0 (0.0%) |
| 35 to 44 Years | 0 (0.0%) | 15 (4.0%) |
| 45 to 54 Years | 18 (4.8%) | 0 (0.0%) |
| 55 to 64 Years | 16 (3.1%) | 35 (4.9%) |
| 65 to 74 Years | 20 (7.1%) | 4 (1.8%) |
| 75 Years and over | 7 (5.3%) | 23 (8.2%) |
| Total | 121 (4.2%) | 224 (6.4%) |
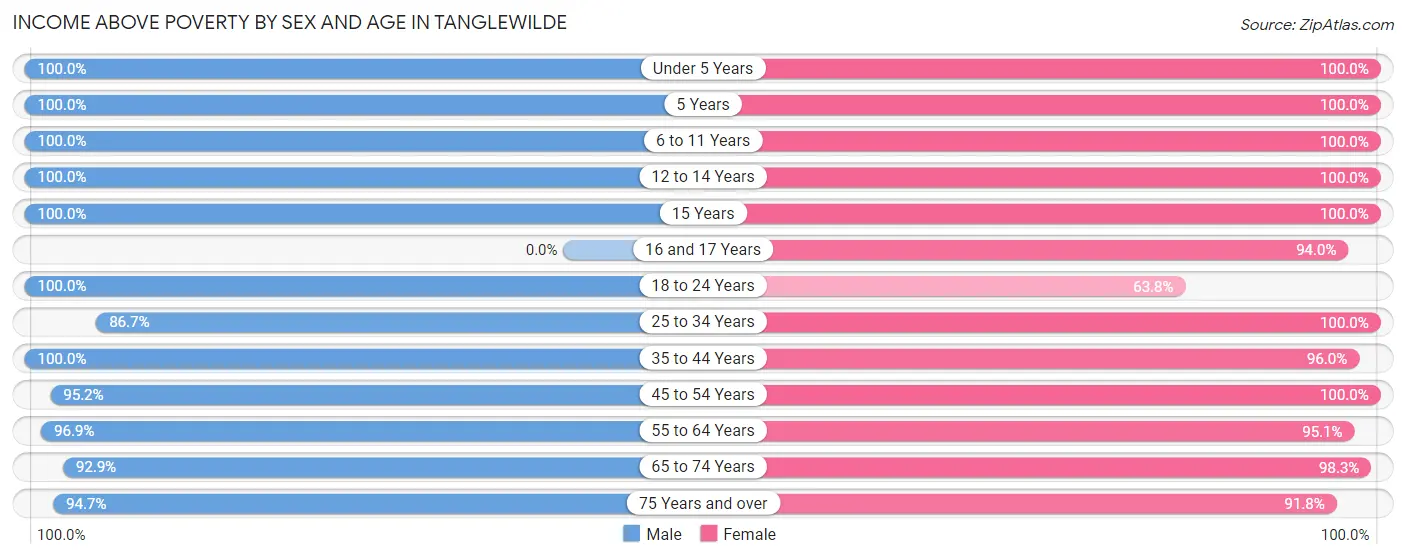
Income Above Poverty by Sex and Age in Tanglewilde
According to the poverty statistics in Tanglewilde, males aged under 5 years and females aged under 5 years are the age groups that are most secure financially, with 100.0% of males and 100.0% of females in these age groups living above the poverty line.
| Age Bracket | Male | Female |
| Under 5 Years | 144 (100.0%) | 424 (100.0%) |
| 5 Years | 106 (100.0%) | 96 (100.0%) |
| 6 to 11 Years | 234 (100.0%) | 213 (100.0%) |
| 12 to 14 Years | 77 (100.0%) | 28 (100.0%) |
| 15 Years | 17 (100.0%) | 75 (100.0%) |
| 16 and 17 Years | 0 (0.0%) | 94 (94.0%) |
| 18 to 24 Years | 284 (100.0%) | 248 (63.7%) |
| 25 to 34 Years | 313 (86.7%) | 383 (100.0%) |
| 35 to 44 Years | 340 (100.0%) | 360 (96.0%) |
| 45 to 54 Years | 358 (95.2%) | 193 (100.0%) |
| 55 to 64 Years | 505 (96.9%) | 683 (95.1%) |
| 65 to 74 Years | 261 (92.9%) | 224 (98.3%) |
| 75 Years and over | 125 (94.7%) | 259 (91.8%) |
| Total | 2,764 (95.8%) | 3,280 (93.6%) |
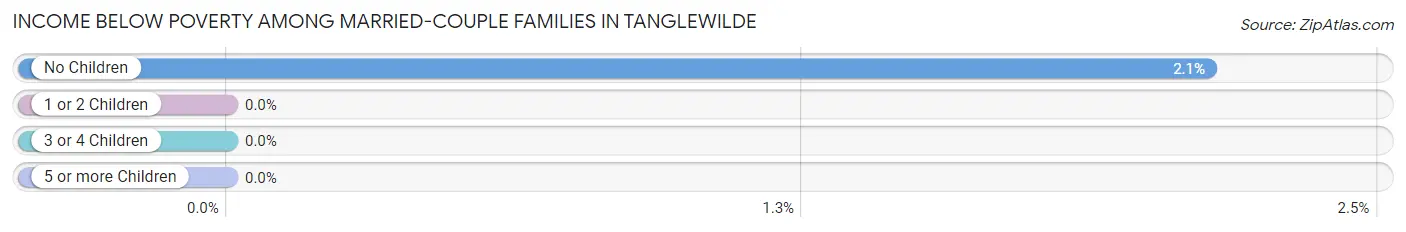
Income Below Poverty Among Married-Couple Families in Tanglewilde
The poverty statistics for married-couple families in Tanglewilde show that 1.3% or 20 of the total 1,579 families live below the poverty line. Families with no children have the highest poverty rate of 2.1%, comprising of 20 families. On the other hand, families with 1 or 2 children have the lowest poverty rate of 0.0%, which includes 0 families.
| Children | Above Poverty | Below Poverty |
| No Children | 919 (97.9%) | 20 (2.1%) |
| 1 or 2 Children | 580 (100.0%) | 0 (0.0%) |
| 3 or 4 Children | 60 (100.0%) | 0 (0.0%) |
| 5 or more Children | 0 (0.0%) | 0 (0.0%) |
| Total | 1,559 (98.7%) | 20 (1.3%) |
Income Below Poverty Among Single-Parent Households in Tanglewilde
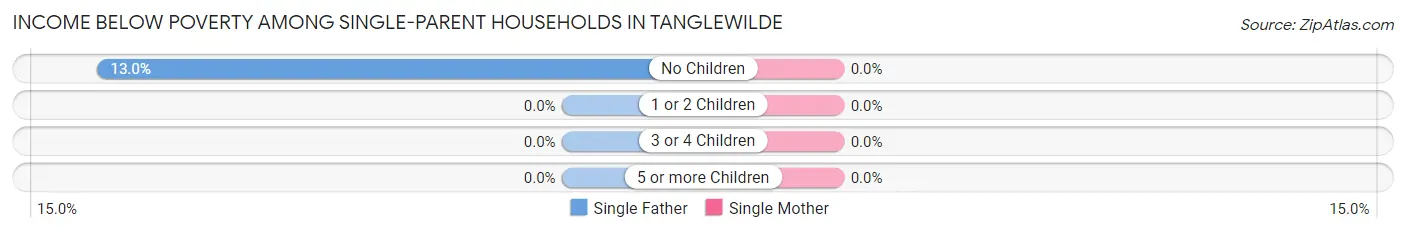
| Children | Single Father | Single Mother |
| No Children | 7 (13.0%) | 0 (0.0%) |
| 1 or 2 Children | 0 (0.0%) | 0 (0.0%) |
| 3 or 4 Children | 0 (0.0%) | 0 (0.0%) |
| 5 or more Children | 0 (0.0%) | 0 (0.0%) |
| Total | 7 (13.0%) | 0 (0.0%) |
Income Below Poverty Among Married-Couple vs Single-Parent Households in Tanglewilde
The poverty data for Tanglewilde shows that 20 of the married-couple family households (1.3%) and 7 of the single-parent households (2.3%) are living below the poverty level. Within the married-couple family households, those with no children have the highest poverty rate, with 20 households (2.1%) falling below the poverty line. Among the single-parent households, those with no children have the highest poverty rate, with 7 household (7.5%) living below poverty.
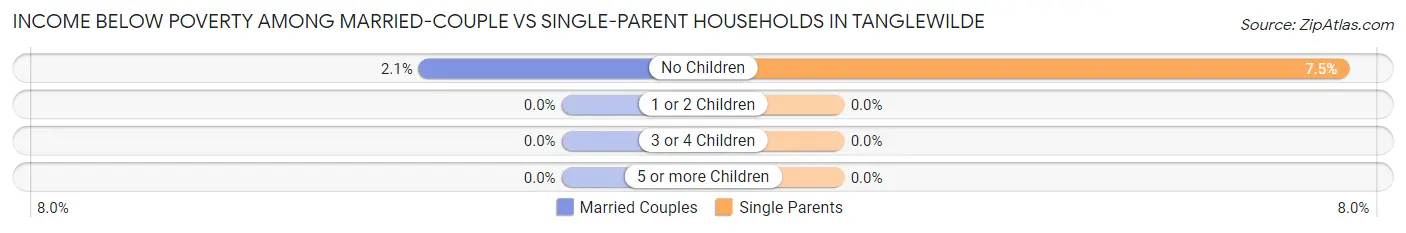
| Children | Married-Couple Families | Single-Parent Households |
| No Children | 20 (2.1%) | 7 (7.5%) |
| 1 or 2 Children | 0 (0.0%) | 0 (0.0%) |
| 3 or 4 Children | 0 (0.0%) | 0 (0.0%) |
| 5 or more Children | 0 (0.0%) | 0 (0.0%) |
| Total | 20 (1.3%) | 7 (2.3%) |
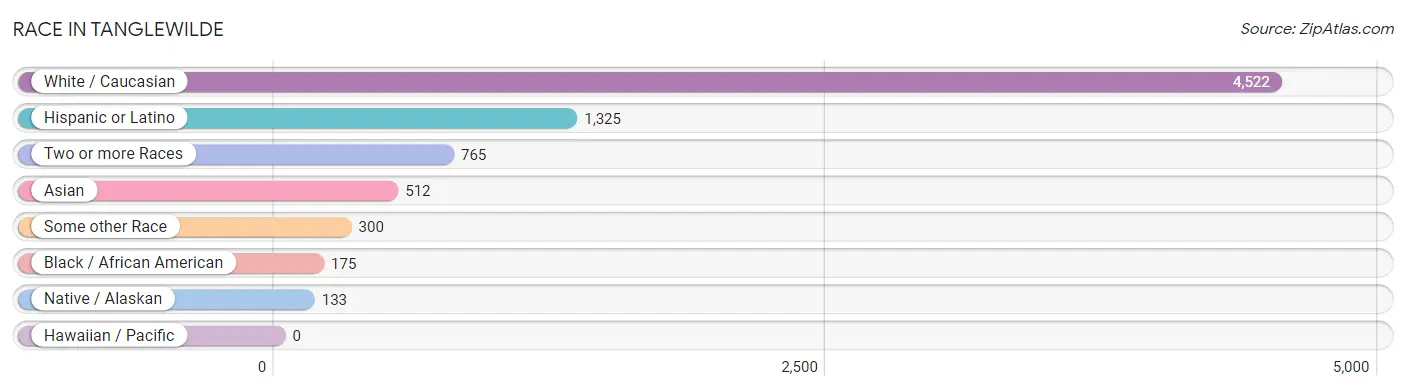
Race in Tanglewilde
The most populous races in Tanglewilde are White / Caucasian (4,522 | 70.6%), Hispanic or Latino (1,325 | 20.7%), and Two or more Races (765 | 11.9%).
| Race | # Population | % Population |
| Asian | 512 | 8.0% |
| Black / African American | 175 | 2.7% |
| Hawaiian / Pacific | 0 | 0.0% |
| Hispanic or Latino | 1,325 | 20.7% |
| Native / Alaskan | 133 | 2.1% |
| White / Caucasian | 4,522 | 70.6% |
| Two or more Races | 765 | 11.9% |
| Some other Race | 300 | 4.7% |
| Total | 6,407 | 100.0% |
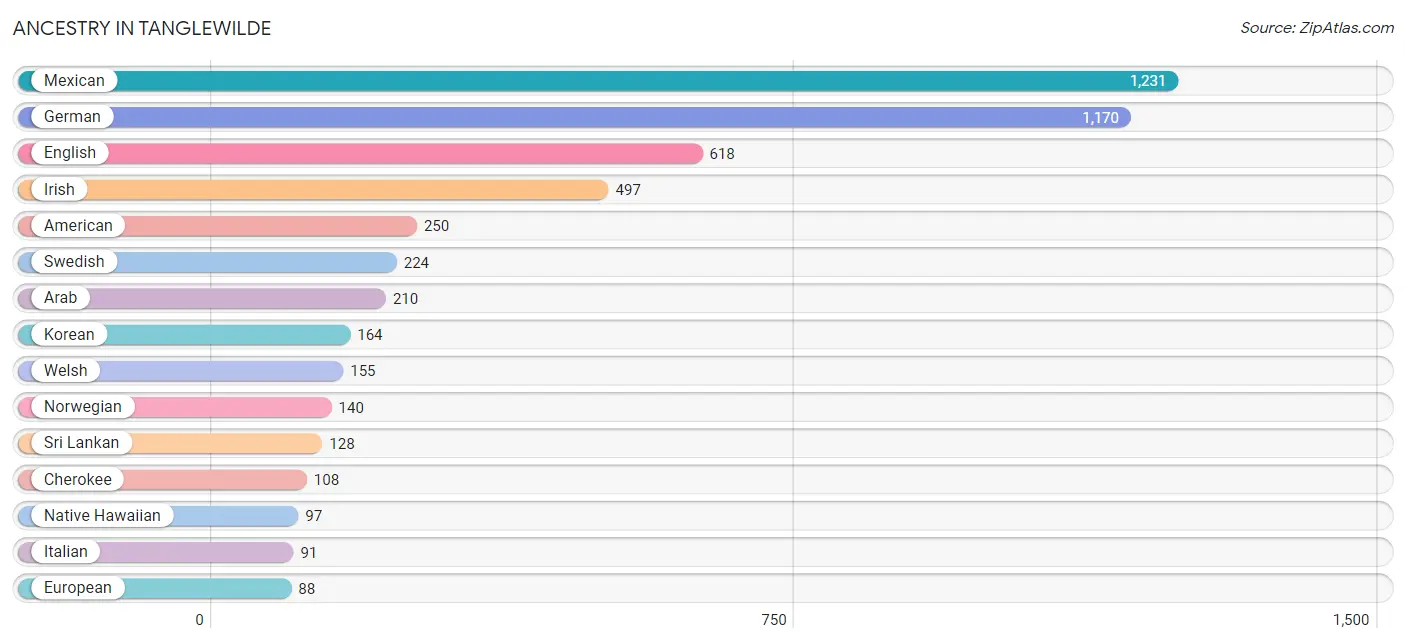
Ancestry in Tanglewilde
The most populous ancestries reported in Tanglewilde are Mexican (1,231 | 19.2%), German (1,170 | 18.3%), English (618 | 9.7%), Irish (497 | 7.8%), and American (250 | 3.9%), together accounting for 58.8% of all Tanglewilde residents.
| Ancestry | # Population | % Population |
| African | 41 | 0.6% |
| American | 250 | 3.9% |
| Arab | 210 | 3.3% |
| Bhutanese | 80 | 1.3% |
| Blackfeet | 41 | 0.6% |
| British | 38 | 0.6% |
| Burmese | 20 | 0.3% |
| Canadian | 11 | 0.2% |
| Cherokee | 108 | 1.7% |
| Czech | 48 | 0.7% |
| Dutch | 64 | 1.0% |
| Eastern European | 36 | 0.6% |
| Ecuadorian | 9 | 0.1% |
| English | 618 | 9.7% |
| European | 88 | 1.4% |
| Finnish | 8 | 0.1% |
| French | 70 | 1.1% |
| French Canadian | 88 | 1.4% |
| German | 1,170 | 18.3% |
| Hungarian | 49 | 0.8% |
| Indian (Asian) | 68 | 1.1% |
| Irish | 497 | 7.8% |
| Italian | 91 | 1.4% |
| Japanese | 71 | 1.1% |
| Korean | 164 | 2.6% |
| Mexican | 1,231 | 19.2% |
| Native Hawaiian | 97 | 1.5% |
| Norwegian | 140 | 2.2% |
| Polish | 61 | 0.9% |
| Portuguese | 34 | 0.5% |
| Puerto Rican | 50 | 0.8% |
| Puget Sound Salish | 31 | 0.5% |
| Romanian | 2 | 0.0% |
| Scotch-Irish | 3 | 0.1% |
| Scottish | 60 | 0.9% |
| South American | 9 | 0.1% |
| Sri Lankan | 128 | 2.0% |
| Subsaharan African | 41 | 0.6% |
| Swedish | 224 | 3.5% |
| Tlingit-Haida | 11 | 0.2% |
| Welsh | 155 | 2.4% | View All 41 Rows |
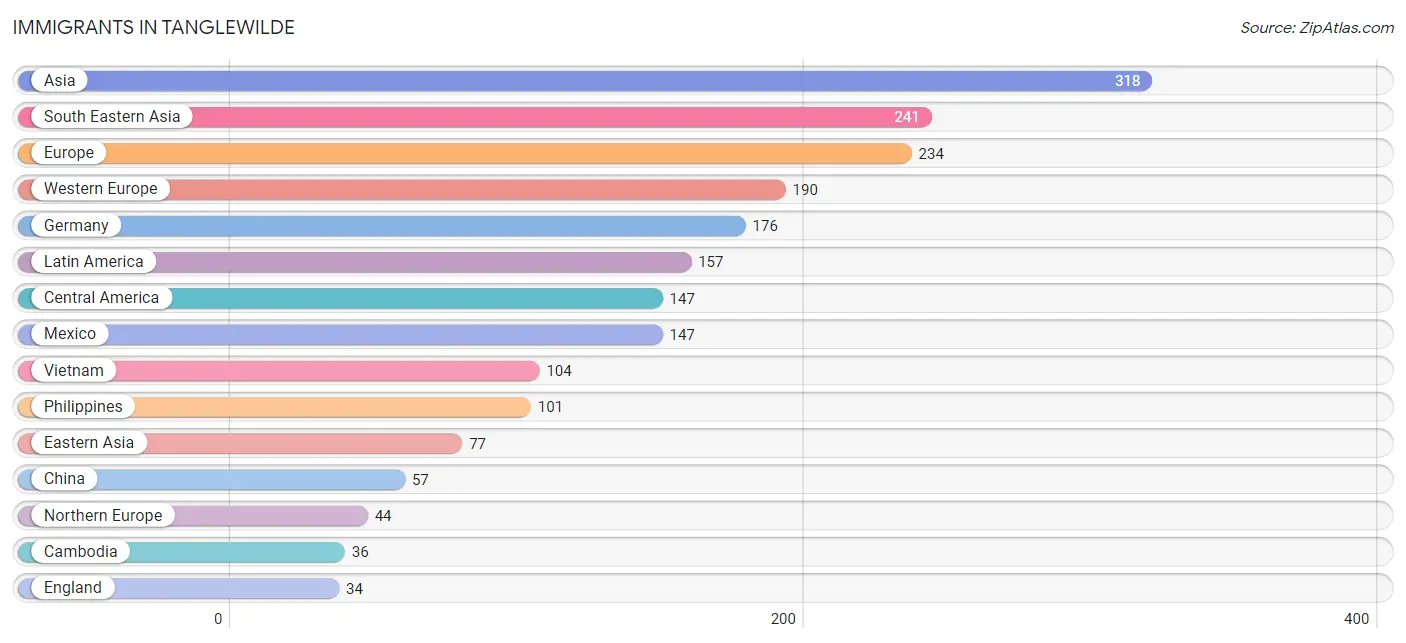
Immigrants in Tanglewilde
The most numerous immigrant groups reported in Tanglewilde came from Asia (318 | 5.0%), South Eastern Asia (241 | 3.8%), Europe (234 | 3.6%), Western Europe (190 | 3.0%), and Germany (176 | 2.8%), together accounting for 18.1% of all Tanglewilde residents.
| Immigration Origin | # Population | % Population |
| Asia | 318 | 5.0% |
| Cambodia | 36 | 0.6% |
| Canada | 13 | 0.2% |
| Caribbean | 10 | 0.2% |
| Central America | 147 | 2.3% |
| China | 57 | 0.9% |
| Dominica | 10 | 0.2% |
| Eastern Asia | 77 | 1.2% |
| England | 34 | 0.5% |
| Europe | 234 | 3.6% |
| France | 14 | 0.2% |
| Germany | 176 | 2.8% |
| Korea | 20 | 0.3% |
| Latin America | 157 | 2.5% |
| Mexico | 147 | 2.3% |
| Northern Europe | 44 | 0.7% |
| Philippines | 101 | 1.6% |
| South Eastern Asia | 241 | 3.8% |
| Taiwan | 3 | 0.1% |
| Vietnam | 104 | 1.6% |
| Western Europe | 190 | 3.0% | View All 21 Rows |
Sex and Age in Tanglewilde
Sex and Age in Tanglewilde
The most populous age groups in Tanglewilde are 5 to 9 Years (312 | 10.8%) for men and 60 to 64 Years (528 | 15.0%) for women.
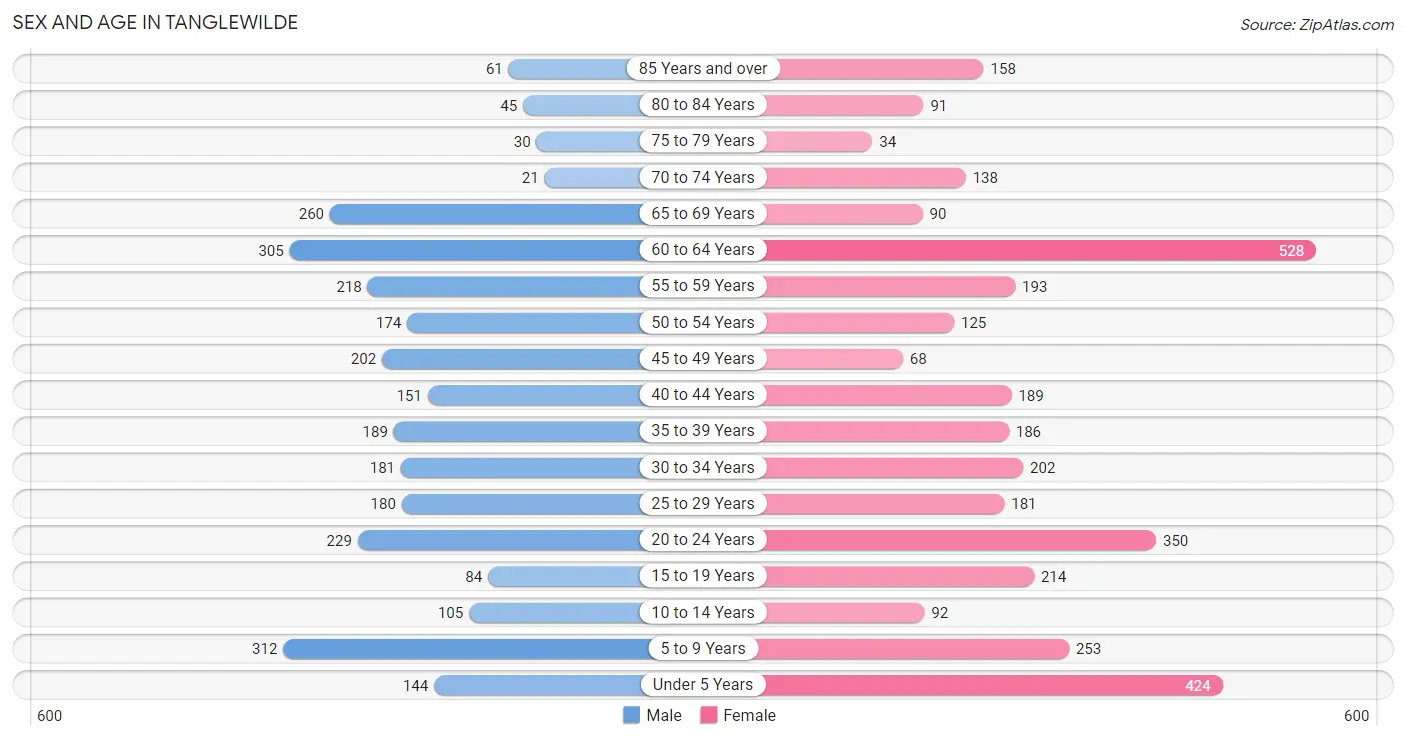
| Age Bracket | Male | Female |
| Under 5 Years | 144 (5.0%) | 424 (12.1%) |
| 5 to 9 Years | 312 (10.8%) | 253 (7.2%) |
| 10 to 14 Years | 105 (3.6%) | 92 (2.6%) |
| 15 to 19 Years | 84 (2.9%) | 214 (6.1%) |
| 20 to 24 Years | 229 (7.9%) | 350 (10.0%) |
| 25 to 29 Years | 180 (6.2%) | 181 (5.1%) |
| 30 to 34 Years | 181 (6.3%) | 202 (5.8%) |
| 35 to 39 Years | 189 (6.5%) | 186 (5.3%) |
| 40 to 44 Years | 151 (5.2%) | 189 (5.4%) |
| 45 to 49 Years | 202 (7.0%) | 68 (1.9%) |
| 50 to 54 Years | 174 (6.0%) | 125 (3.6%) |
| 55 to 59 Years | 218 (7.5%) | 193 (5.5%) |
| 60 to 64 Years | 305 (10.5%) | 528 (15.0%) |
| 65 to 69 Years | 260 (9.0%) | 90 (2.6%) |
| 70 to 74 Years | 21 (0.7%) | 138 (3.9%) |
| 75 to 79 Years | 30 (1.0%) | 34 (1.0%) |
| 80 to 84 Years | 45 (1.6%) | 91 (2.6%) |
| 85 Years and over | 61 (2.1%) | 158 (4.5%) |
| Total | 2,891 (100.0%) | 3,516 (100.0%) |
Families and Households in Tanglewilde
Median Family Size in Tanglewilde
The median family size in Tanglewilde is 2.89 persons per family, with single female/mother families (251 | 13.3%) accounting for the largest median family size of 3.71 persons per family. On the other hand, single male/father families (54 | 2.9%) represent the smallest median family size with 2.07 persons per family.
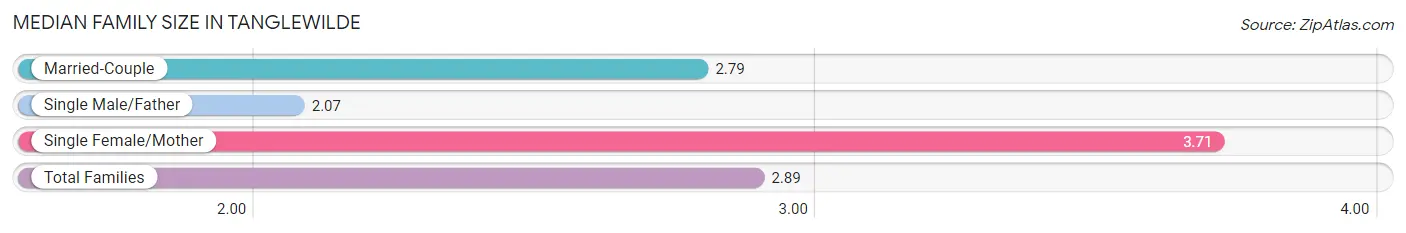
| Family Type | # Families | Family Size |
| Married-Couple | 1,579 (83.8%) | 2.79 |
| Single Male/Father | 54 (2.9%) | 2.07 |
| Single Female/Mother | 251 (13.3%) | 3.71 |
| Total Families | 1,884 (100.0%) | 2.89 |
Median Household Size in Tanglewilde
The median household size in Tanglewilde is 2.64 persons per household, with single female/mother households (251 | 10.5%) accounting for the largest median household size of 4.05 persons per household. non-family households (512 | 21.4%) represent the smallest median household size with 1.38 persons per household.
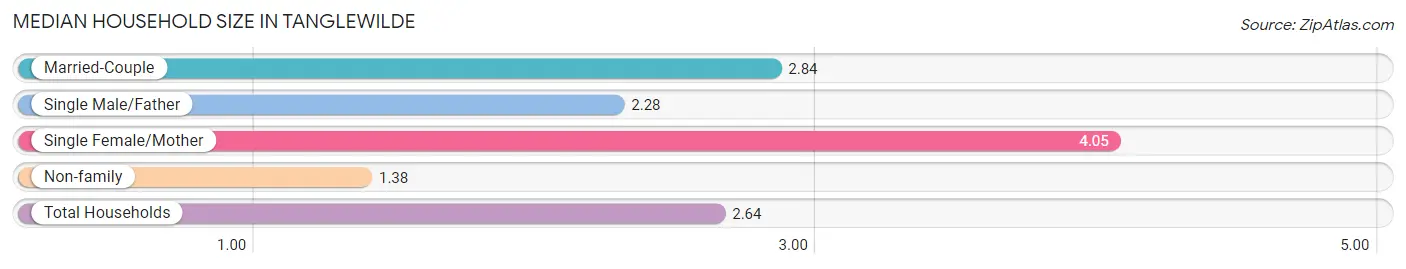
| Household Type | # Households | Household Size |
| Married-Couple | 1,579 (65.9%) | 2.84 |
| Single Male/Father | 54 (2.2%) | 2.28 |
| Single Female/Mother | 251 (10.5%) | 4.05 |
| Non-family | 512 (21.4%) | 1.38 |
| Total Households | 2,396 (100.0%) | 2.64 |
Household Size by Marriage Status in Tanglewilde
Out of a total of 2,396 households in Tanglewilde, 1,884 (78.6%) are family households, while 512 (21.4%) are nonfamily households. The most numerous type of family households are 2-person households, comprising 640, and the most common type of nonfamily households are 1-person households, comprising 343.
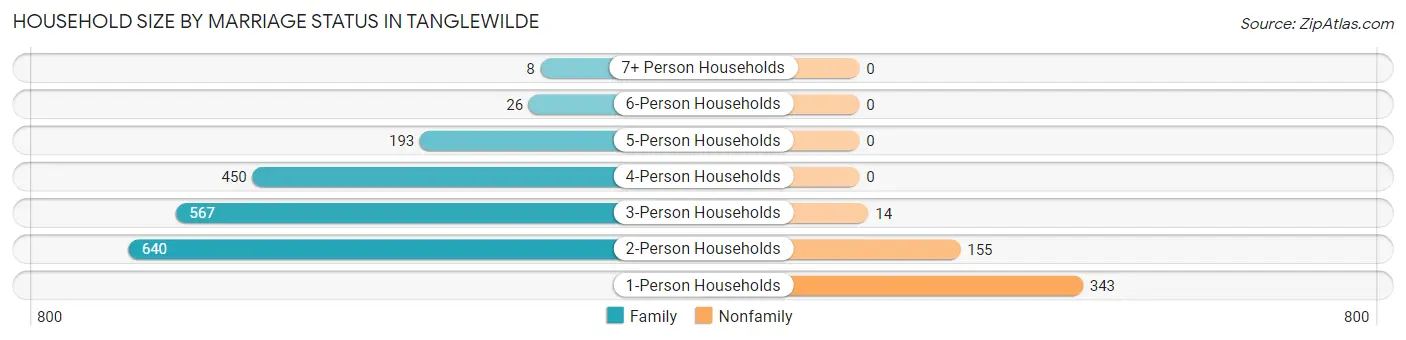
| Household Size | Family Households | Nonfamily Households |
| 1-Person Households | - | 343 (14.3%) |
| 2-Person Households | 640 (26.7%) | 155 (6.5%) |
| 3-Person Households | 567 (23.7%) | 14 (0.6%) |
| 4-Person Households | 450 (18.8%) | 0 (0.0%) |
| 5-Person Households | 193 (8.1%) | 0 (0.0%) |
| 6-Person Households | 26 (1.1%) | 0 (0.0%) |
| 7+ Person Households | 8 (0.3%) | 0 (0.0%) |
| Total | 1,884 (78.6%) | 512 (21.4%) |
Female Fertility in Tanglewilde
Fertility by Age in Tanglewilde
Average fertility rate in Tanglewilde is 56.0 births per 1,000 women. Women in the age bracket of 20 to 34 years have the highest fertility rate with 106.0 births per 1,000 women. Women in the age bracket of 20 to 34 years acount for 100.0% of all women with births.
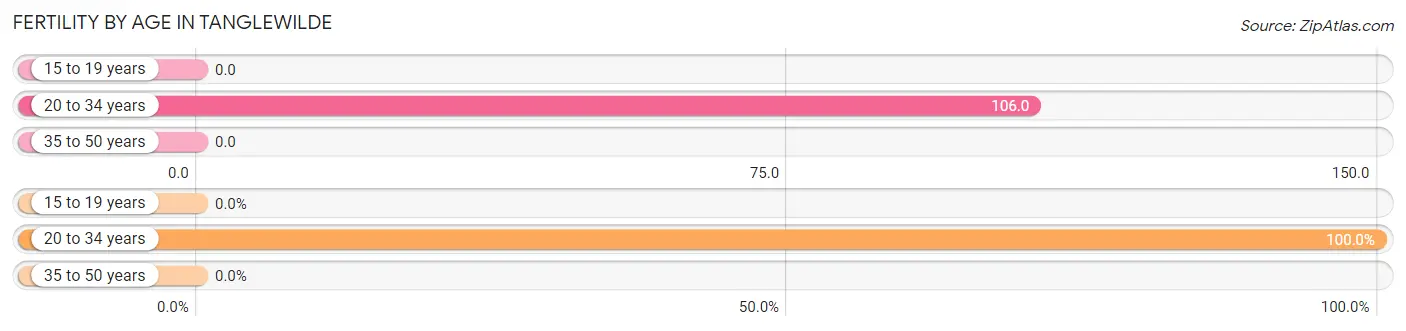
| Age Bracket | Women with Births | Births / 1,000 Women |
| 15 to 19 years | 0 (0.0%) | 0.0 |
| 20 to 34 years | 78 (100.0%) | 106.0 |
| 35 to 50 years | 0 (0.0%) | 0.0 |
| Total | 78 (100.0%) | 56.0 |
Fertility by Age by Marriage Status in Tanglewilde
20.5% of women with births (78) in Tanglewilde are married. The highest percentage of unmarried women with births falls into 20 to 34 years age bracket with 79.5% of them unmarried at the time of birth, while the lowest percentage of unmarried women with births belong to 20 to 34 years age bracket with 79.5% of them unmarried.
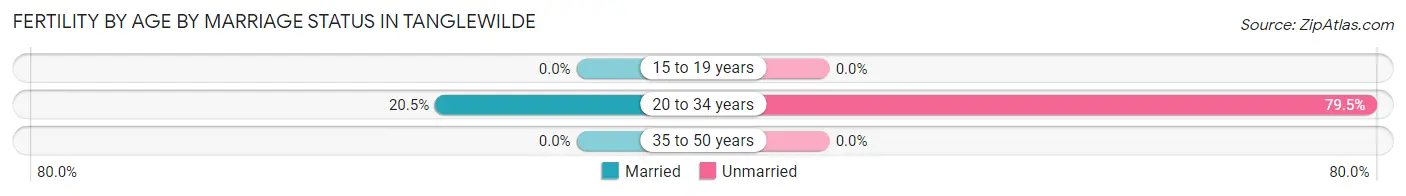
| Age Bracket | Married | Unmarried |
| 15 to 19 years | 0 (0.0%) | 0 (0.0%) |
| 20 to 34 years | 16 (20.5%) | 62 (79.5%) |
| 35 to 50 years | 0 (0.0%) | 0 (0.0%) |
| Total | 16 (20.5%) | 62 (79.5%) |
Fertility by Education in Tanglewilde
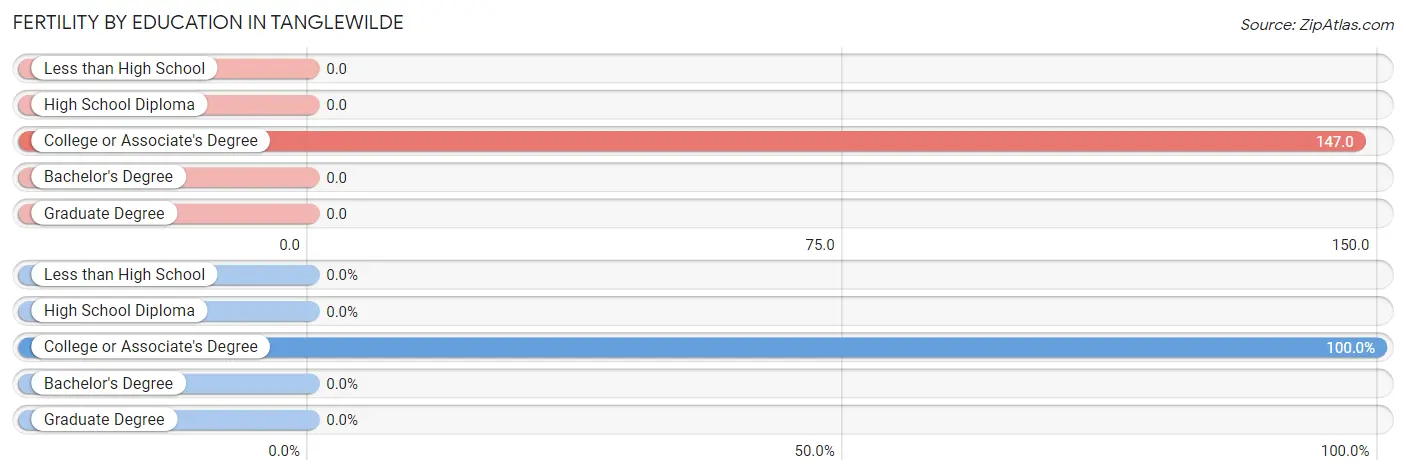
| Educational Attainment | Women with Births | Births / 1,000 Women |
| Less than High School | 0 (0.0%) | 0.0 |
| High School Diploma | 0 (0.0%) | 0.0 |
| College or Associate's Degree | 78 (100.0%) | 147.0 |
| Bachelor's Degree | 0 (0.0%) | 0.0 |
| Graduate Degree | 0 (0.0%) | 0.0 |
| Total | 78 (100.0%) | 56.0 |
Fertility by Education by Marriage Status in Tanglewilde
79.5% of women with births in Tanglewilde are unmarried. Women with the educational attainment of college or associate's degree are most likely to be married with 20.5% of them married at childbirth, while women with the educational attainment of college or associate's degree are least likely to be married with 79.5% of them unmarried at childbirth.
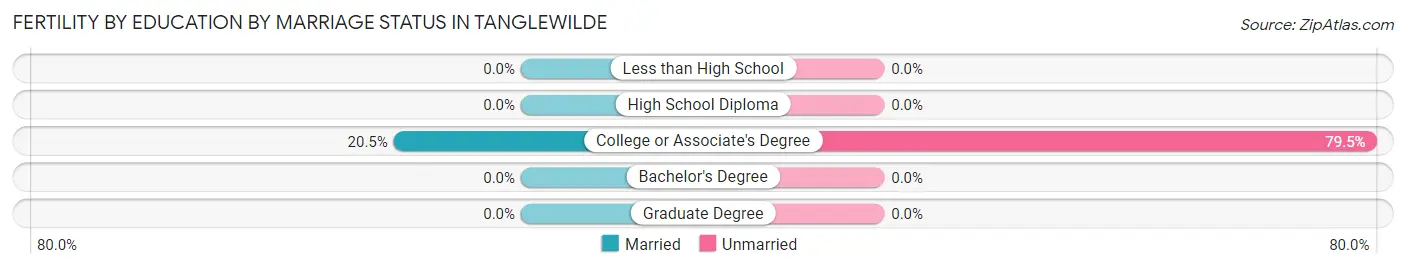
| Educational Attainment | Married | Unmarried |
| Less than High School | 0 (0.0%) | 0 (0.0%) |
| High School Diploma | 0 (0.0%) | 0 (0.0%) |
| College or Associate's Degree | 16 (20.5%) | 62 (79.5%) |
| Bachelor's Degree | 0 (0.0%) | 0 (0.0%) |
| Graduate Degree | 0 (0.0%) | 0 (0.0%) |
| Total | 16 (20.5%) | 62 (79.5%) |
Employment Characteristics in Tanglewilde
Employment by Class of Employer in Tanglewilde
Among the 2,775 employed individuals in Tanglewilde, private company employees (1,824 | 65.7%), state government employees (337 | 12.1%), and local government employees (216 | 7.8%) make up the most common classes of employment.
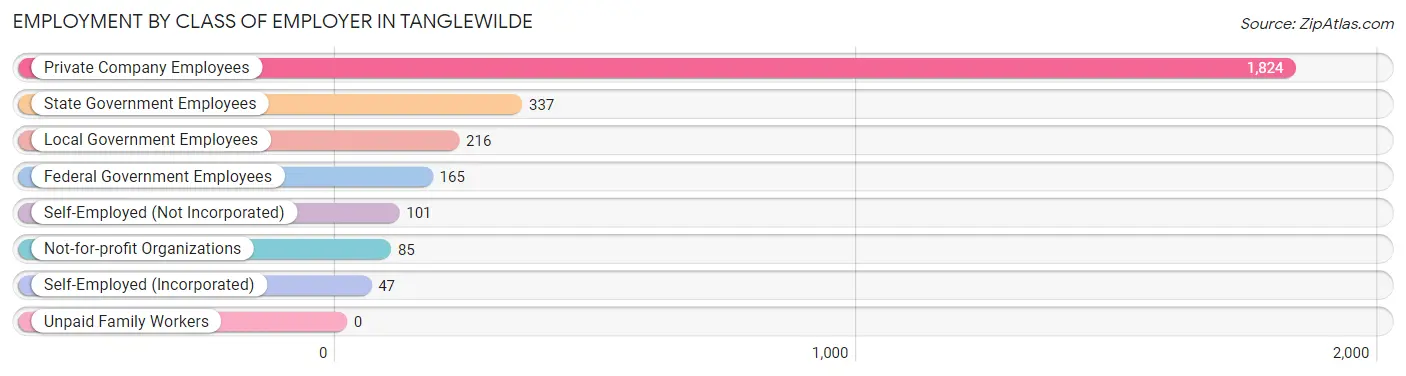
| Employer Class | # Employees | % Employees |
| Private Company Employees | 1,824 | 65.7% |
| Self-Employed (Incorporated) | 47 | 1.7% |
| Self-Employed (Not Incorporated) | 101 | 3.6% |
| Not-for-profit Organizations | 85 | 3.1% |
| Local Government Employees | 216 | 7.8% |
| State Government Employees | 337 | 12.1% |
| Federal Government Employees | 165 | 5.9% |
| Unpaid Family Workers | 0 | 0.0% |
| Total | 2,775 | 100.0% |
Employment Status by Age in Tanglewilde
According to the labor force statistics for Tanglewilde, out of the total population over 16 years of age (4,985), 61.9% or 3,086 individuals are in the labor force, with 9.9% or 306 of them unemployed. The age group with the highest labor force participation rate is 35 to 44 years, with 93.3% or 667 individuals in the labor force. Within the labor force, the 16 to 19 years age range has the highest percentage of unemployed individuals, with 29.7% or 35 of them being unemployed.
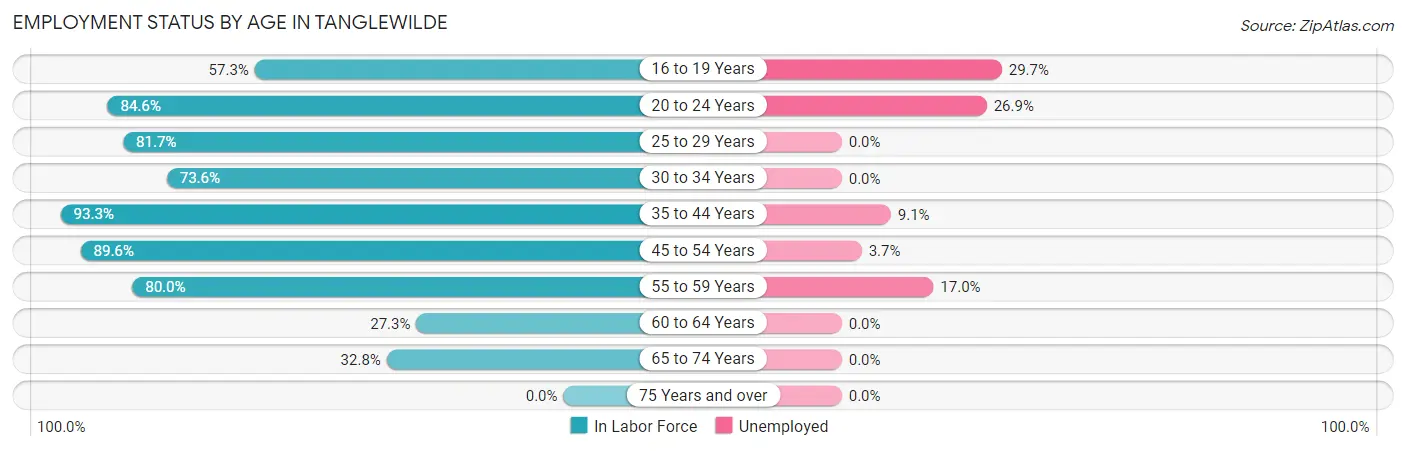
| Age Bracket | In Labor Force | Unemployed |
| 16 to 19 Years | 118 (57.3%) | 35 (29.7%) |
| 20 to 24 Years | 490 (84.6%) | 132 (26.9%) |
| 25 to 29 Years | 295 (81.7%) | 0 (0.0%) |
| 30 to 34 Years | 282 (73.6%) | 0 (0.0%) |
| 35 to 44 Years | 667 (93.3%) | 61 (9.1%) |
| 45 to 54 Years | 510 (89.6%) | 19 (3.7%) |
| 55 to 59 Years | 329 (80.0%) | 56 (17.0%) |
| 60 to 64 Years | 227 (27.3%) | 0 (0.0%) |
| 65 to 74 Years | 167 (32.8%) | 0 (0.0%) |
| 75 Years and over | 0 (0.0%) | 0 (0.0%) |
| Total | 3,086 (61.9%) | 306 (9.9%) |
Employment Status by Educational Attainment in Tanglewilde
According to labor force statistics for Tanglewilde, 70.6% of individuals (2,310) out of the total population between 25 and 64 years of age (3,272) are in the labor force, with 6.0% or 139 of them being unemployed. The group with the highest labor force participation rate are those with the educational attainment of college / associate degree, with 82.8% or 985 individuals in the labor force. Within the labor force, individuals with college / associate degree education have the highest percentage of unemployment, with 9.1% or 90 of them being unemployed.
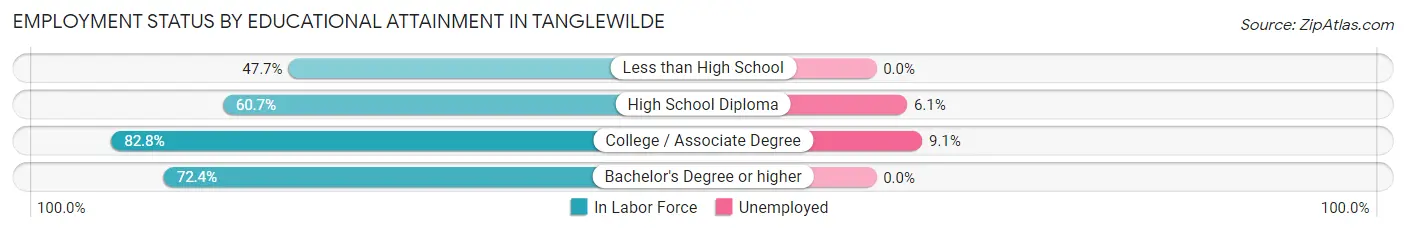
| Educational Attainment | In Labor Force | Unemployed |
| Less than High School | 62 (47.7%) | 0 (0.0%) |
| High School Diploma | 782 (60.7%) | 79 (6.1%) |
| College / Associate Degree | 985 (82.8%) | 108 (9.1%) |
| Bachelor's Degree or higher | 480 (72.4%) | 0 (0.0%) |
| Total | 2,310 (70.6%) | 196 (6.0%) |
Employment Occupations by Sex in Tanglewilde
Management, Business, Science and Arts Occupations
The most common Management, Business, Science and Arts occupations in Tanglewilde are Health Diagnosing & Treating (312 | 11.4%), Community & Social Service (304 | 11.1%), Business & Financial (203 | 7.4%), Education, Arts & Media (133 | 4.8%), and Computers, Engineering & Science (113 | 4.1%).
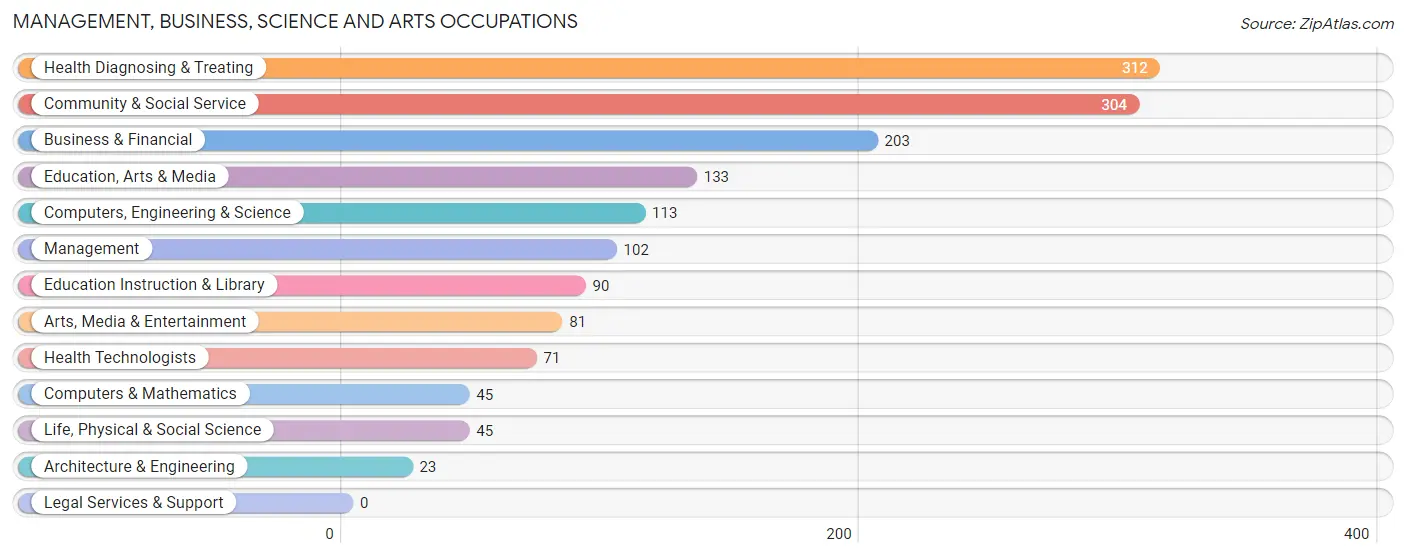
Management, Business, Science and Arts Occupations by Sex
Within the Management, Business, Science and Arts occupations in Tanglewilde, the most male-oriented occupations are Architecture & Engineering (100.0%), Arts, Media & Entertainment (100.0%), and Computers & Mathematics (64.4%), while the most female-oriented occupations are Health Technologists (100.0%), Education Instruction & Library (76.7%), and Health Diagnosing & Treating (73.7%).
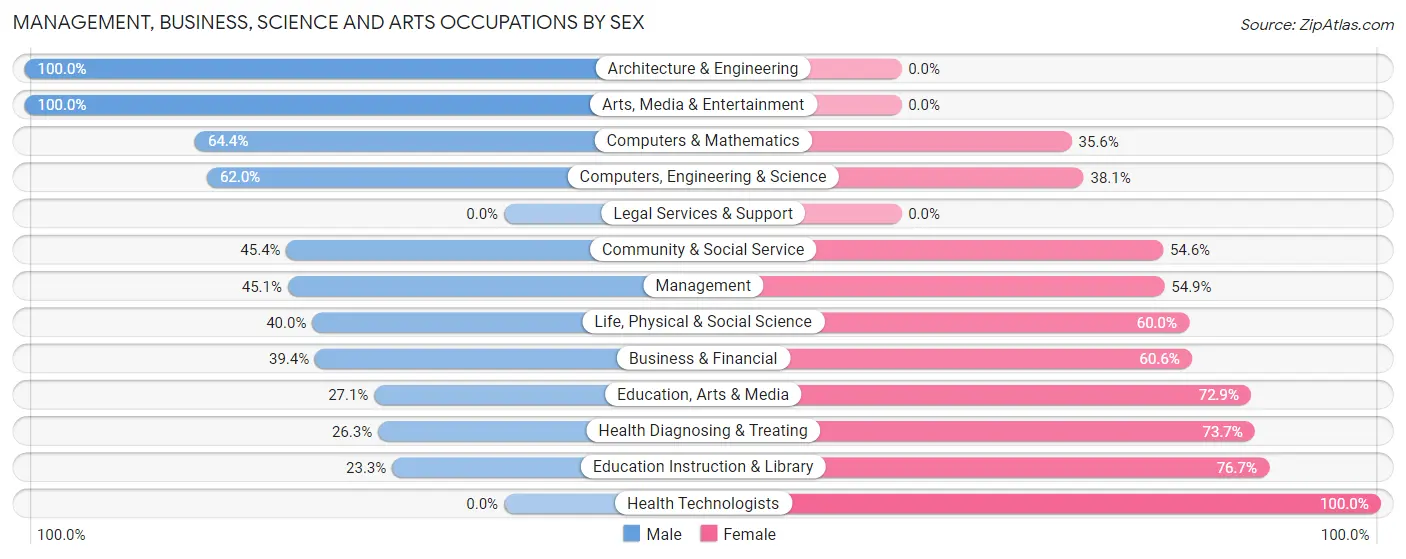
| Occupation | Male | Female |
| Management | 46 (45.1%) | 56 (54.9%) |
| Business & Financial | 80 (39.4%) | 123 (60.6%) |
| Computers, Engineering & Science | 70 (62.0%) | 43 (38.1%) |
| Computers & Mathematics | 29 (64.4%) | 16 (35.6%) |
| Architecture & Engineering | 23 (100.0%) | 0 (0.0%) |
| Life, Physical & Social Science | 18 (40.0%) | 27 (60.0%) |
| Community & Social Service | 138 (45.4%) | 166 (54.6%) |
| Education, Arts & Media | 36 (27.1%) | 97 (72.9%) |
| Legal Services & Support | 0 (0.0%) | 0 (0.0%) |
| Education Instruction & Library | 21 (23.3%) | 69 (76.7%) |
| Arts, Media & Entertainment | 81 (100.0%) | 0 (0.0%) |
| Health Diagnosing & Treating | 82 (26.3%) | 230 (73.7%) |
| Health Technologists | 0 (0.0%) | 71 (100.0%) |
| Total (Category) | 416 (40.2%) | 618 (59.8%) |
| Total (Overall) | 1,484 (54.0%) | 1,263 (46.0%) |
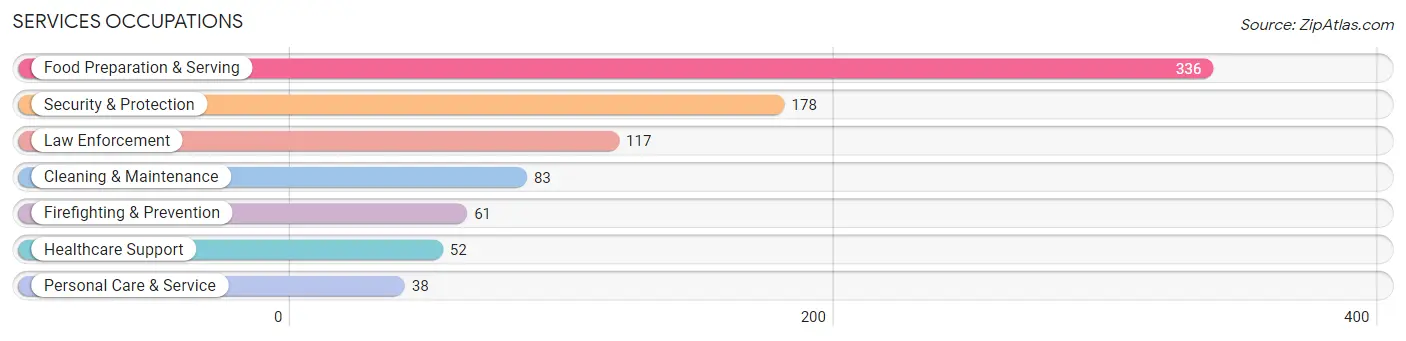
Services Occupations
The most common Services occupations in Tanglewilde are Food Preparation & Serving (336 | 12.2%), Security & Protection (178 | 6.5%), Law Enforcement (117 | 4.3%), Cleaning & Maintenance (83 | 3.0%), and Firefighting & Prevention (61 | 2.2%).
Services Occupations by Sex
Within the Services occupations in Tanglewilde, the most male-oriented occupations are Security & Protection (100.0%), Firefighting & Prevention (100.0%), and Law Enforcement (100.0%), while the most female-oriented occupations are Personal Care & Service (100.0%), Healthcare Support (82.7%), and Food Preparation & Serving (69.9%).
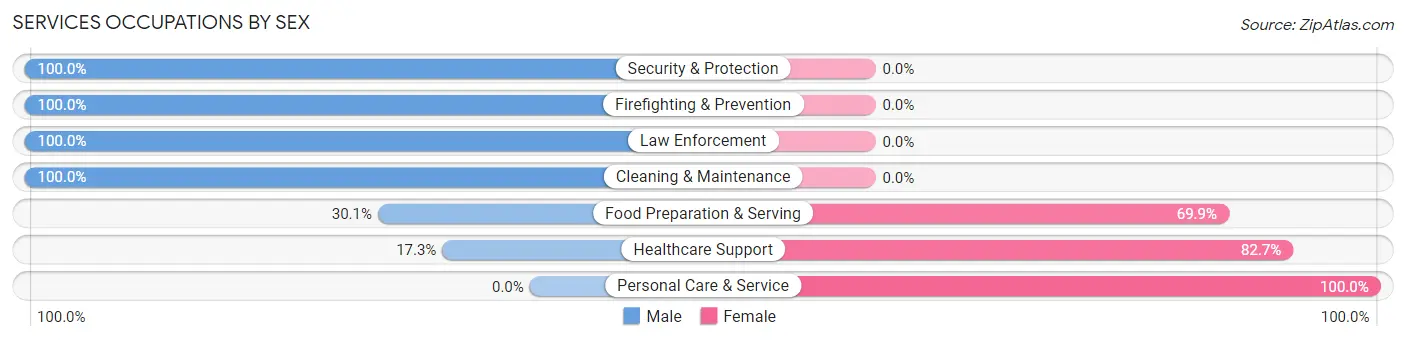
| Occupation | Male | Female |
| Healthcare Support | 9 (17.3%) | 43 (82.7%) |
| Security & Protection | 178 (100.0%) | 0 (0.0%) |
| Firefighting & Prevention | 61 (100.0%) | 0 (0.0%) |
| Law Enforcement | 117 (100.0%) | 0 (0.0%) |
| Food Preparation & Serving | 101 (30.1%) | 235 (69.9%) |
| Cleaning & Maintenance | 83 (100.0%) | 0 (0.0%) |
| Personal Care & Service | 0 (0.0%) | 38 (100.0%) |
| Total (Category) | 371 (54.0%) | 316 (46.0%) |
| Total (Overall) | 1,484 (54.0%) | 1,263 (46.0%) |
Sales and Office Occupations
The most common Sales and Office occupations in Tanglewilde are Office & Administration (260 | 9.5%), and Sales & Related (169 | 6.1%).

Sales and Office Occupations by Sex
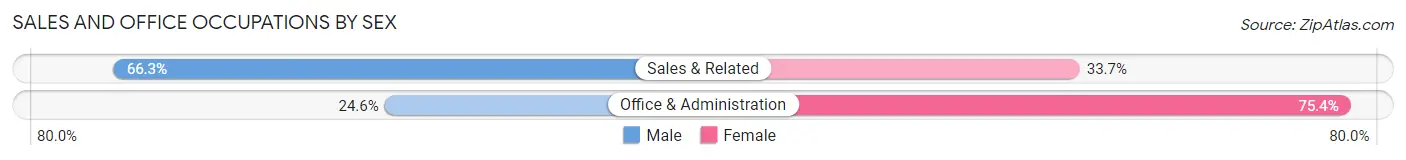
| Occupation | Male | Female |
| Sales & Related | 112 (66.3%) | 57 (33.7%) |
| Office & Administration | 64 (24.6%) | 196 (75.4%) |
| Total (Category) | 176 (41.0%) | 253 (59.0%) |
| Total (Overall) | 1,484 (54.0%) | 1,263 (46.0%) |
Natural Resources, Construction and Maintenance Occupations
The most common Natural Resources, Construction and Maintenance occupations in Tanglewilde are Construction & Extraction (176 | 6.4%), Installation, Maintenance & Repair (96 | 3.5%), and Farming, Fishing & Forestry (17 | 0.6%).
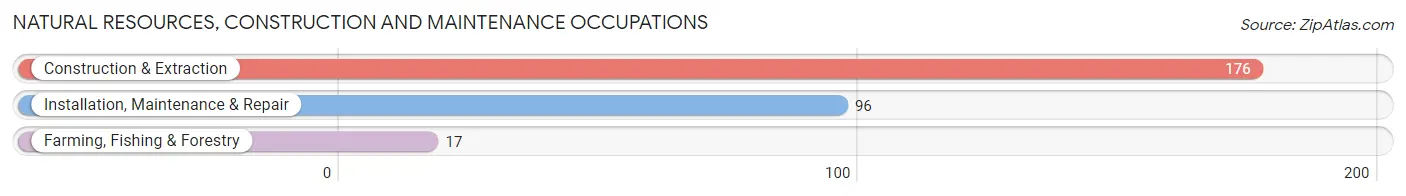
Natural Resources, Construction and Maintenance Occupations by Sex
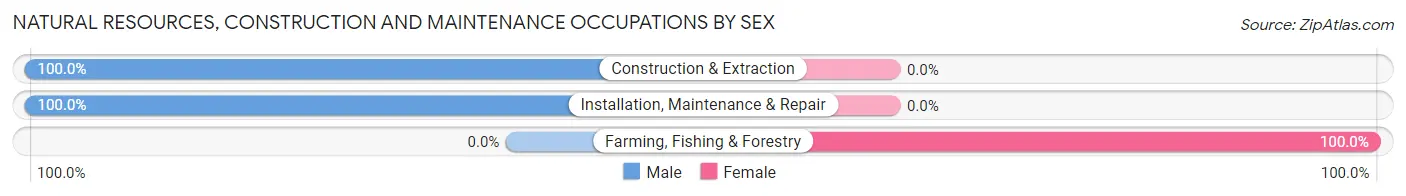
| Occupation | Male | Female |
| Farming, Fishing & Forestry | 0 (0.0%) | 17 (100.0%) |
| Construction & Extraction | 176 (100.0%) | 0 (0.0%) |
| Installation, Maintenance & Repair | 96 (100.0%) | 0 (0.0%) |
| Total (Category) | 272 (94.1%) | 17 (5.9%) |
| Total (Overall) | 1,484 (54.0%) | 1,263 (46.0%) |
Production, Transportation and Moving Occupations
The most common Production, Transportation and Moving occupations in Tanglewilde are Material Moving (113 | 4.1%), Production (106 | 3.9%), and Transportation (89 | 3.2%).
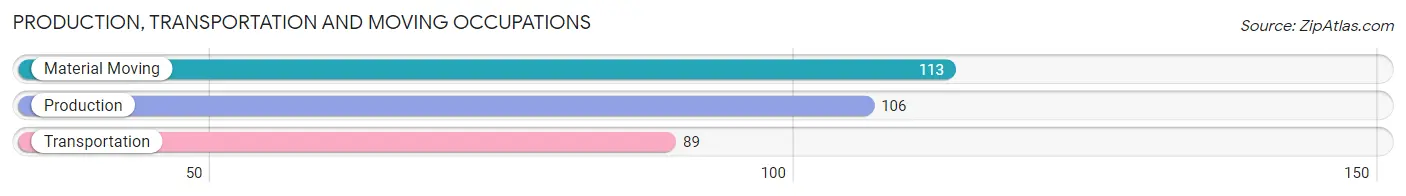
Production, Transportation and Moving Occupations by Sex
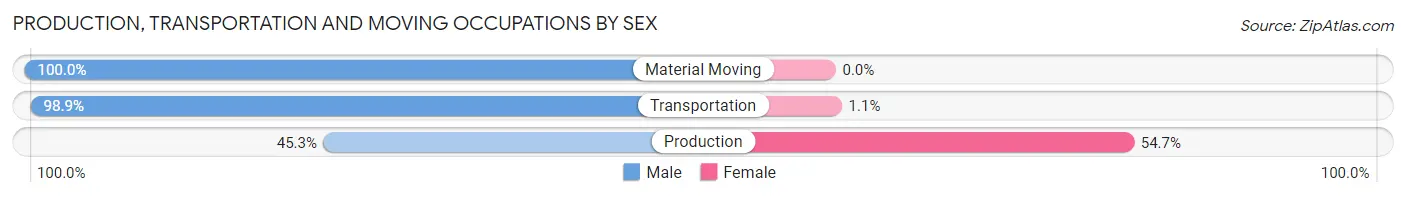
| Occupation | Male | Female |
| Production | 48 (45.3%) | 58 (54.7%) |
| Transportation | 88 (98.9%) | 1 (1.1%) |
| Material Moving | 113 (100.0%) | 0 (0.0%) |
| Total (Category) | 249 (80.8%) | 59 (19.2%) |
| Total (Overall) | 1,484 (54.0%) | 1,263 (46.0%) |
Employment Industries by Sex in Tanglewilde
Employment Industries in Tanglewilde
The major employment industries in Tanglewilde include Retail Trade (322 | 11.7%), Public Administration (318 | 11.6%), Accommodation & Food Services (302 | 11.0%), Professional & Scientific (299 | 10.9%), and Educational Services (258 | 9.4%).
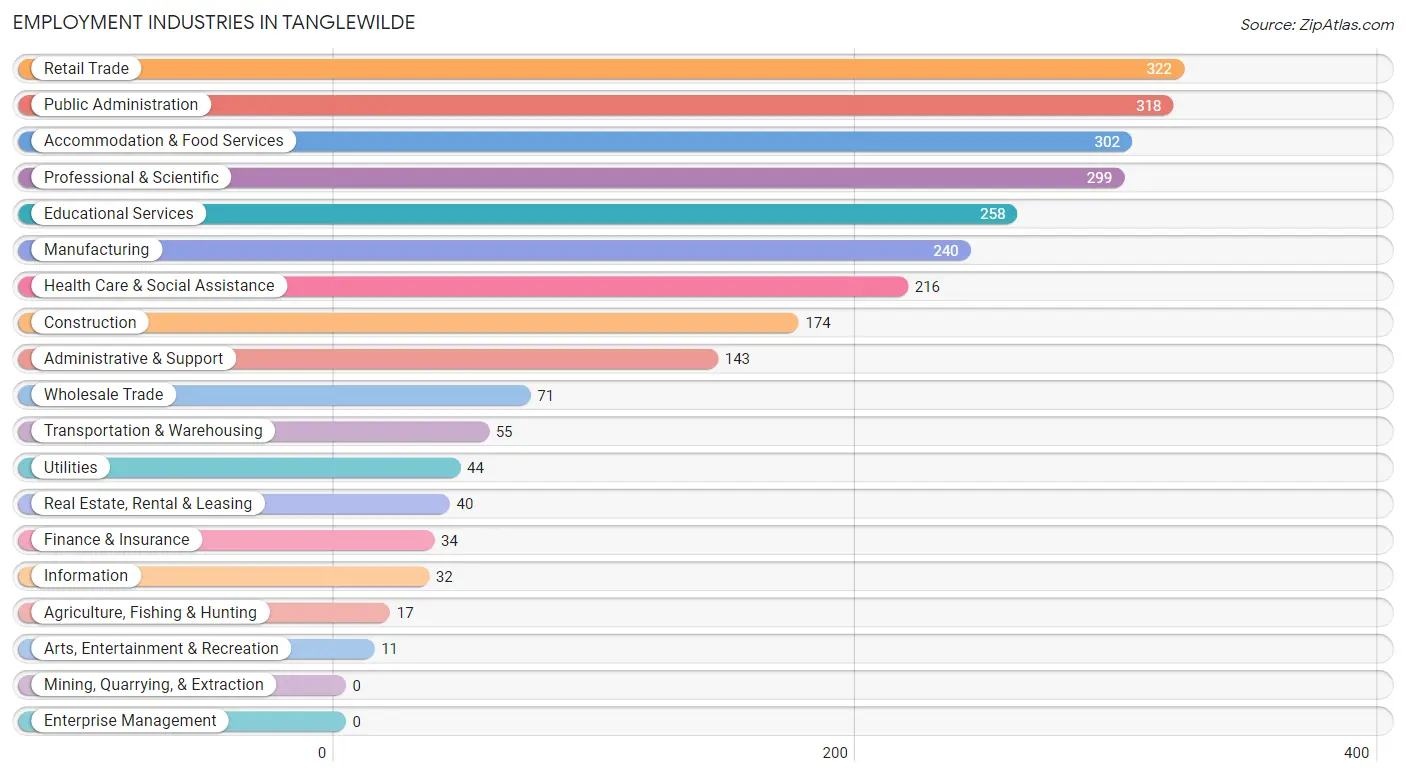
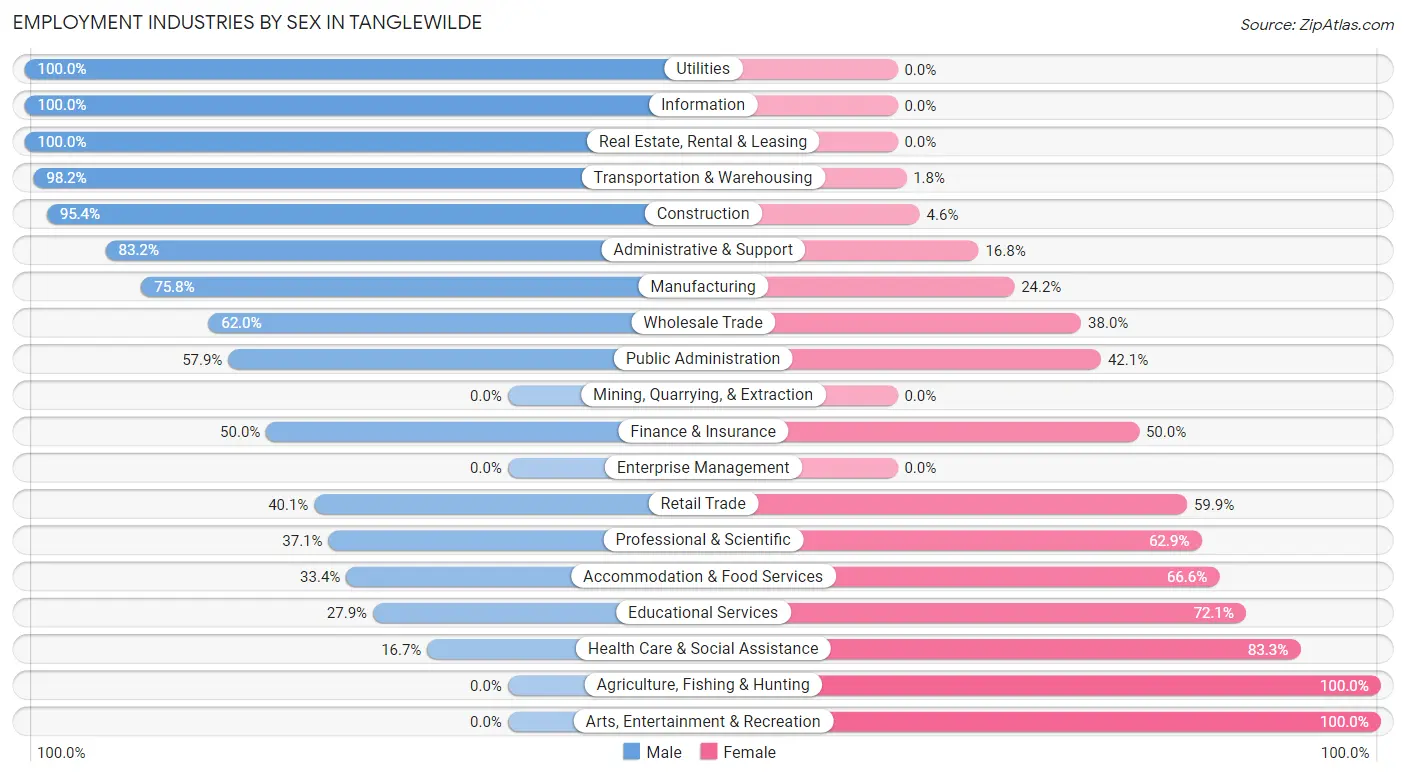
Employment Industries by Sex in Tanglewilde
The Tanglewilde industries that see more men than women are Utilities (100.0%), Information (100.0%), and Real Estate, Rental & Leasing (100.0%), whereas the industries that tend to have a higher number of women are Agriculture, Fishing & Hunting (100.0%), Arts, Entertainment & Recreation (100.0%), and Health Care & Social Assistance (83.3%).
| Industry | Male | Female |
| Agriculture, Fishing & Hunting | 0 (0.0%) | 17 (100.0%) |
| Mining, Quarrying, & Extraction | 0 (0.0%) | 0 (0.0%) |
| Construction | 166 (95.4%) | 8 (4.6%) |
| Manufacturing | 182 (75.8%) | 58 (24.2%) |
| Wholesale Trade | 44 (62.0%) | 27 (38.0%) |
| Retail Trade | 129 (40.1%) | 193 (59.9%) |
| Transportation & Warehousing | 54 (98.2%) | 1 (1.8%) |
| Utilities | 44 (100.0%) | 0 (0.0%) |
| Information | 32 (100.0%) | 0 (0.0%) |
| Finance & Insurance | 17 (50.0%) | 17 (50.0%) |
| Real Estate, Rental & Leasing | 40 (100.0%) | 0 (0.0%) |
| Professional & Scientific | 111 (37.1%) | 188 (62.9%) |
| Enterprise Management | 0 (0.0%) | 0 (0.0%) |
| Administrative & Support | 119 (83.2%) | 24 (16.8%) |
| Educational Services | 72 (27.9%) | 186 (72.1%) |
| Health Care & Social Assistance | 36 (16.7%) | 180 (83.3%) |
| Arts, Entertainment & Recreation | 0 (0.0%) | 11 (100.0%) |
| Accommodation & Food Services | 101 (33.4%) | 201 (66.6%) |
| Public Administration | 184 (57.9%) | 134 (42.1%) |
| Total | 1,484 (54.0%) | 1,263 (46.0%) |
Education in Tanglewilde
School Enrollment in Tanglewilde
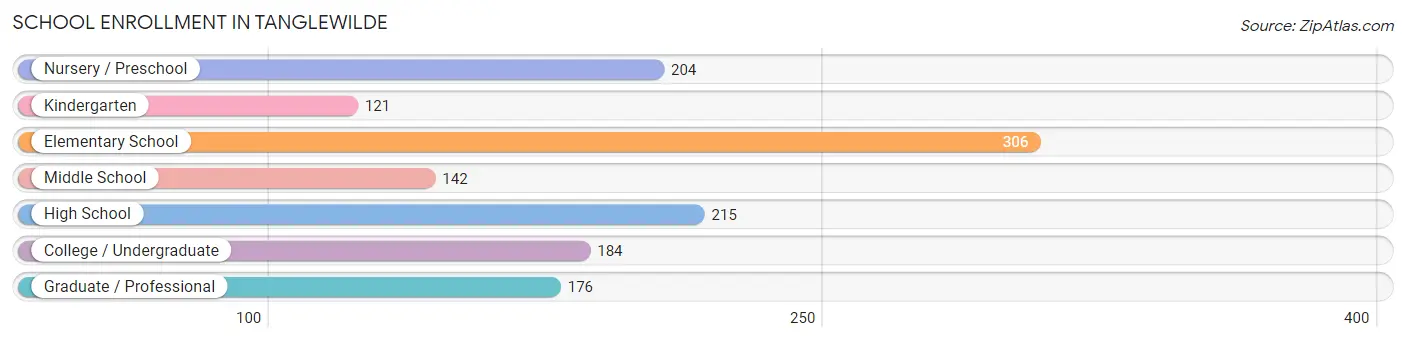
The most common levels of schooling among the 1,348 students in Tanglewilde are elementary school (306 | 22.7%), high school (215 | 16.0%), and nursery / preschool (204 | 15.1%).
| School Level | # Students | % Students |
| Nursery / Preschool | 204 | 15.1% |
| Kindergarten | 121 | 9.0% |
| Elementary School | 306 | 22.7% |
| Middle School | 142 | 10.5% |
| High School | 215 | 16.0% |
| College / Undergraduate | 184 | 13.7% |
| Graduate / Professional | 176 | 13.1% |
| Total | 1,348 | 100.0% |
School Enrollment by Age by Funding Source in Tanglewilde
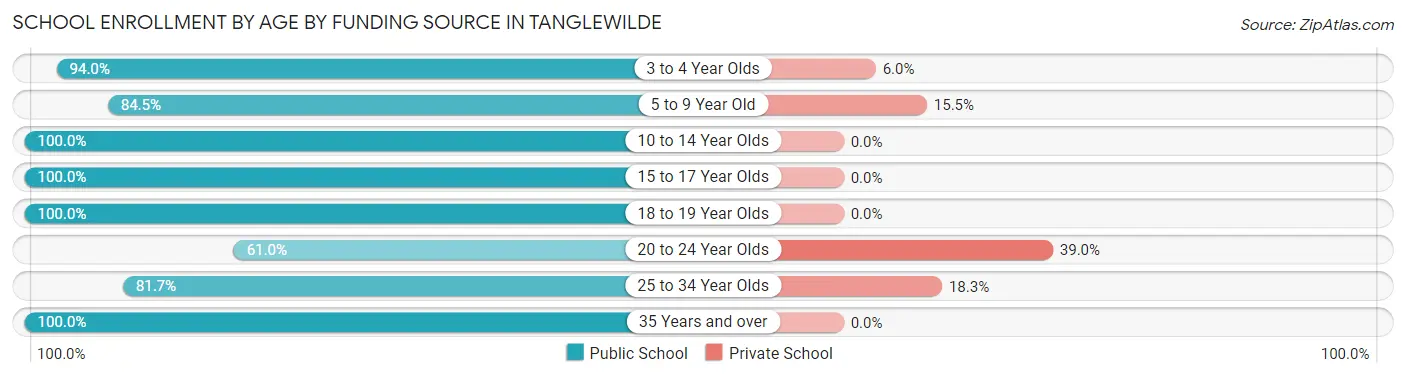
Out of a total of 1,348 students who are enrolled in schools in Tanglewilde, 131 (9.7%) attend a private institution, while the remaining 1,217 (90.3%) are enrolled in public schools. The age group of 20 to 24 year olds has the highest likelihood of being enrolled in private schools, with 30 (39.0% in the age bracket) enrolled. Conversely, the age group of 10 to 14 year olds has the lowest likelihood of being enrolled in a private school, with 181 (100.0% in the age bracket) attending a public institution.
| Age Bracket | Public School | Private School |
| 3 to 4 Year Olds | 63 (94.0%) | 4 (6.0%) |
| 5 to 9 Year Old | 458 (84.5%) | 84 (15.5%) |
| 10 to 14 Year Olds | 181 (100.0%) | 0 (0.0%) |
| 15 to 17 Year Olds | 198 (100.0%) | 0 (0.0%) |
| 18 to 19 Year Olds | 12 (100.0%) | 0 (0.0%) |
| 20 to 24 Year Olds | 47 (61.0%) | 30 (39.0%) |
| 25 to 34 Year Olds | 58 (81.7%) | 13 (18.3%) |
| 35 Years and over | 200 (100.0%) | 0 (0.0%) |
| Total | 1,217 (90.3%) | 131 (9.7%) |
Educational Attainment by Field of Study in Tanglewilde
Business (208 | 21.2%), arts & humanities (171 | 17.4%), science & technology (94 | 9.6%), education (77 | 7.8%), and engineering (75 | 7.6%) are the most common fields of study among 982 individuals in Tanglewilde who have obtained a bachelor's degree or higher.
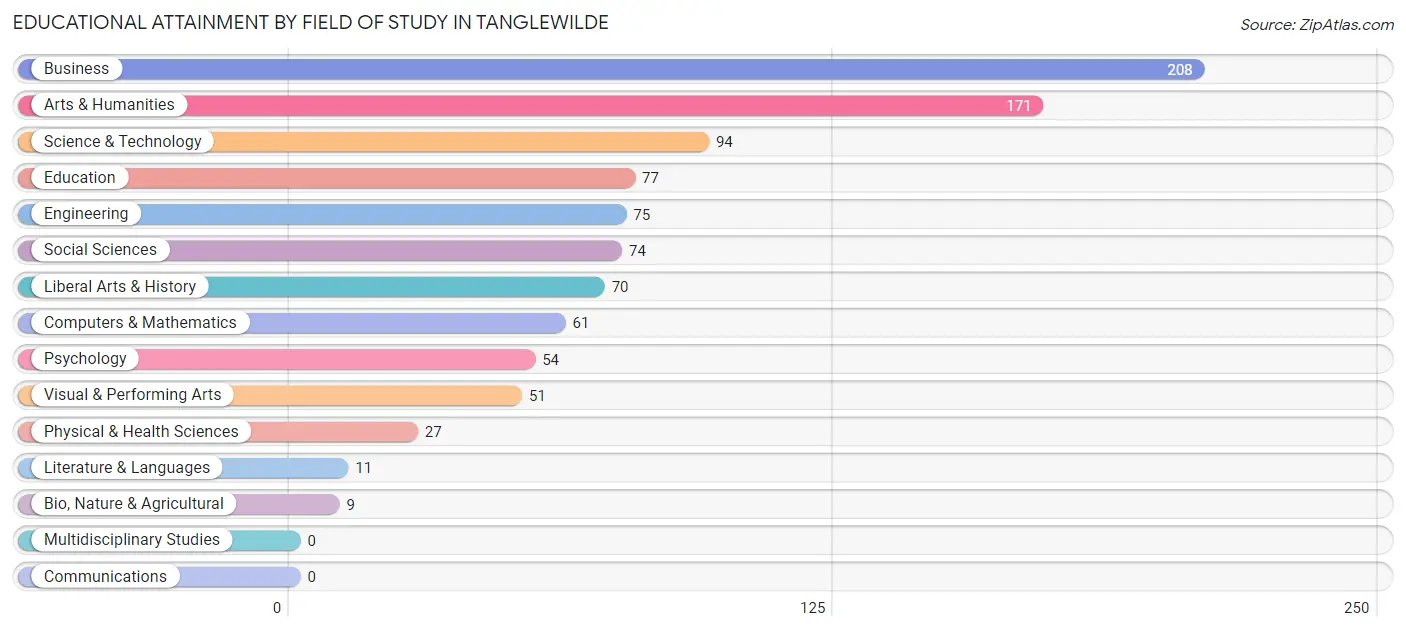
| Field of Study | # Graduates | % Graduates |
| Computers & Mathematics | 61 | 6.2% |
| Bio, Nature & Agricultural | 9 | 0.9% |
| Physical & Health Sciences | 27 | 2.8% |
| Psychology | 54 | 5.5% |
| Social Sciences | 74 | 7.5% |
| Engineering | 75 | 7.6% |
| Multidisciplinary Studies | 0 | 0.0% |
| Science & Technology | 94 | 9.6% |
| Business | 208 | 21.2% |
| Education | 77 | 7.8% |
| Literature & Languages | 11 | 1.1% |
| Liberal Arts & History | 70 | 7.1% |
| Visual & Performing Arts | 51 | 5.2% |
| Communications | 0 | 0.0% |
| Arts & Humanities | 171 | 17.4% |
| Total | 982 | 100.0% |
Transportation & Commute in Tanglewilde
Vehicle Availability by Sex in Tanglewilde
The most prevalent vehicle ownership categories in Tanglewilde are males with 2 vehicles (533, accounting for 35.1%) and females with 2 vehicles (431, making up 42.4%).
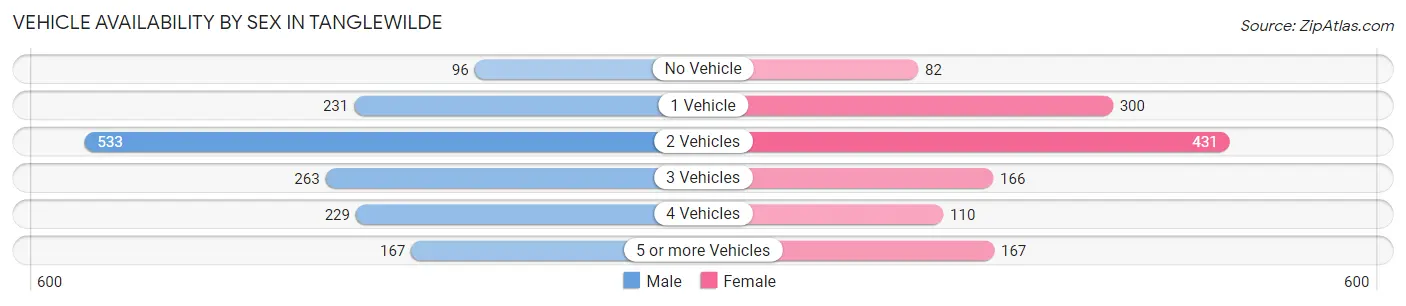
| Vehicles Available | Male | Female |
| No Vehicle | 96 (6.3%) | 82 (6.5%) |
| 1 Vehicle | 231 (15.2%) | 300 (23.9%) |
| 2 Vehicles | 533 (35.1%) | 431 (34.3%) |
| 3 Vehicles | 263 (17.3%) | 166 (13.2%) |
| 4 Vehicles | 229 (15.1%) | 110 (8.8%) |
| 5 or more Vehicles | 167 (11.0%) | 167 (13.3%) |
| Total | 1,519 (100.0%) | 1,256 (100.0%) |
Commute Time in Tanglewilde
The most frequently occuring commute durations in Tanglewilde are 30 to 34 minutes (654 commuters, 26.3%), 15 to 19 minutes (503 commuters, 20.2%), and less than 5 minutes (262 commuters, 10.5%).
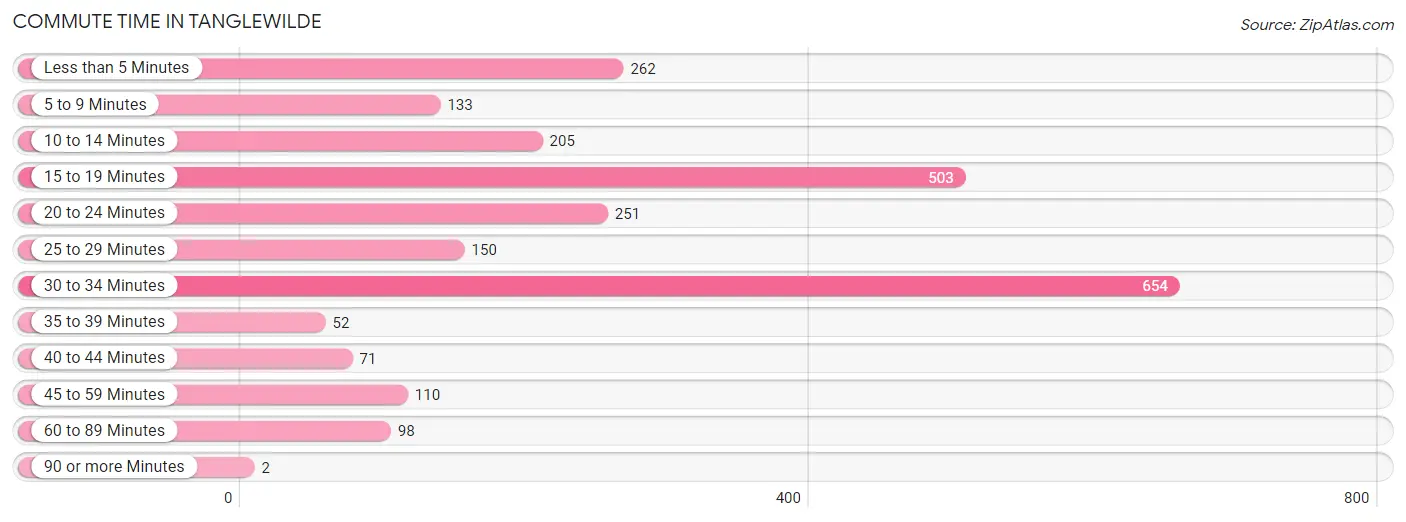
| Commute Time | # Commuters | % Commuters |
| Less than 5 Minutes | 262 | 10.5% |
| 5 to 9 Minutes | 133 | 5.3% |
| 10 to 14 Minutes | 205 | 8.2% |
| 15 to 19 Minutes | 503 | 20.2% |
| 20 to 24 Minutes | 251 | 10.1% |
| 25 to 29 Minutes | 150 | 6.0% |
| 30 to 34 Minutes | 654 | 26.3% |
| 35 to 39 Minutes | 52 | 2.1% |
| 40 to 44 Minutes | 71 | 2.9% |
| 45 to 59 Minutes | 110 | 4.4% |
| 60 to 89 Minutes | 98 | 3.9% |
| 90 or more Minutes | 2 | 0.1% |
Commute Time by Sex in Tanglewilde
The most common commute times in Tanglewilde are 30 to 34 minutes (473 commuters, 34.0%) for males and 15 to 19 minutes (277 commuters, 25.2%) for females.
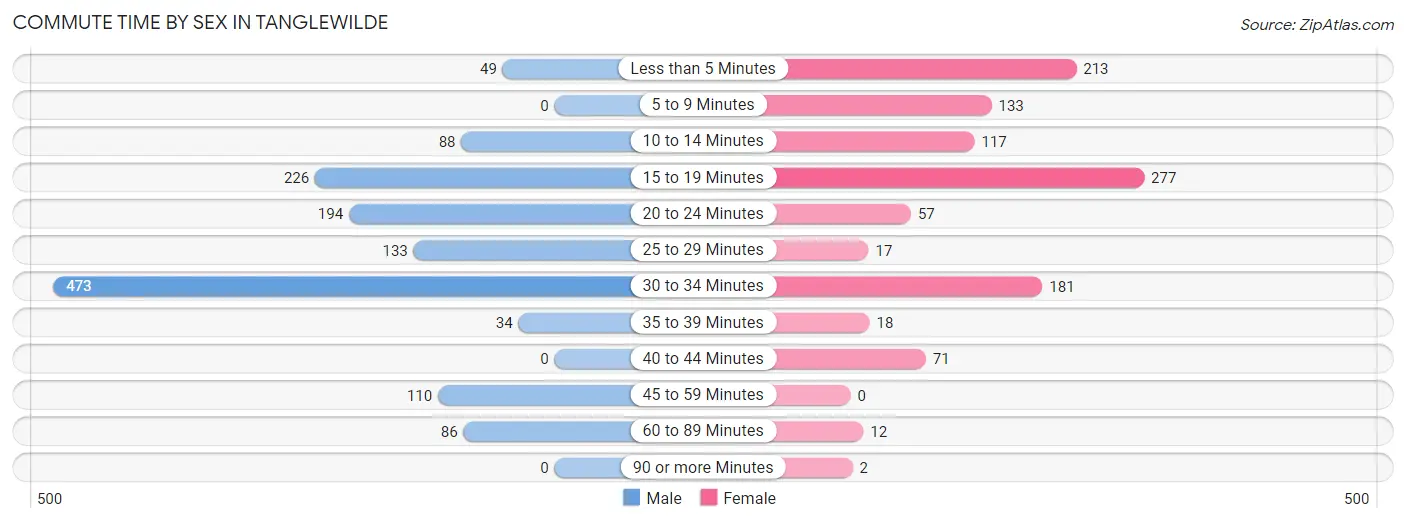
| Commute Time | Male | Female |
| Less than 5 Minutes | 49 (3.5%) | 213 (19.4%) |
| 5 to 9 Minutes | 0 (0.0%) | 133 (12.1%) |
| 10 to 14 Minutes | 88 (6.3%) | 117 (10.7%) |
| 15 to 19 Minutes | 226 (16.2%) | 277 (25.2%) |
| 20 to 24 Minutes | 194 (13.9%) | 57 (5.2%) |
| 25 to 29 Minutes | 133 (9.6%) | 17 (1.5%) |
| 30 to 34 Minutes | 473 (34.0%) | 181 (16.5%) |
| 35 to 39 Minutes | 34 (2.4%) | 18 (1.6%) |
| 40 to 44 Minutes | 0 (0.0%) | 71 (6.5%) |
| 45 to 59 Minutes | 110 (7.9%) | 0 (0.0%) |
| 60 to 89 Minutes | 86 (6.2%) | 12 (1.1%) |
| 90 or more Minutes | 0 (0.0%) | 2 (0.2%) |
Time of Departure to Work by Sex in Tanglewilde
The most frequent times of departure to work in Tanglewilde are 6:00 AM to 6:29 AM (226, 16.2%) for males and 7:30 AM to 7:59 AM (306, 27.9%) for females.
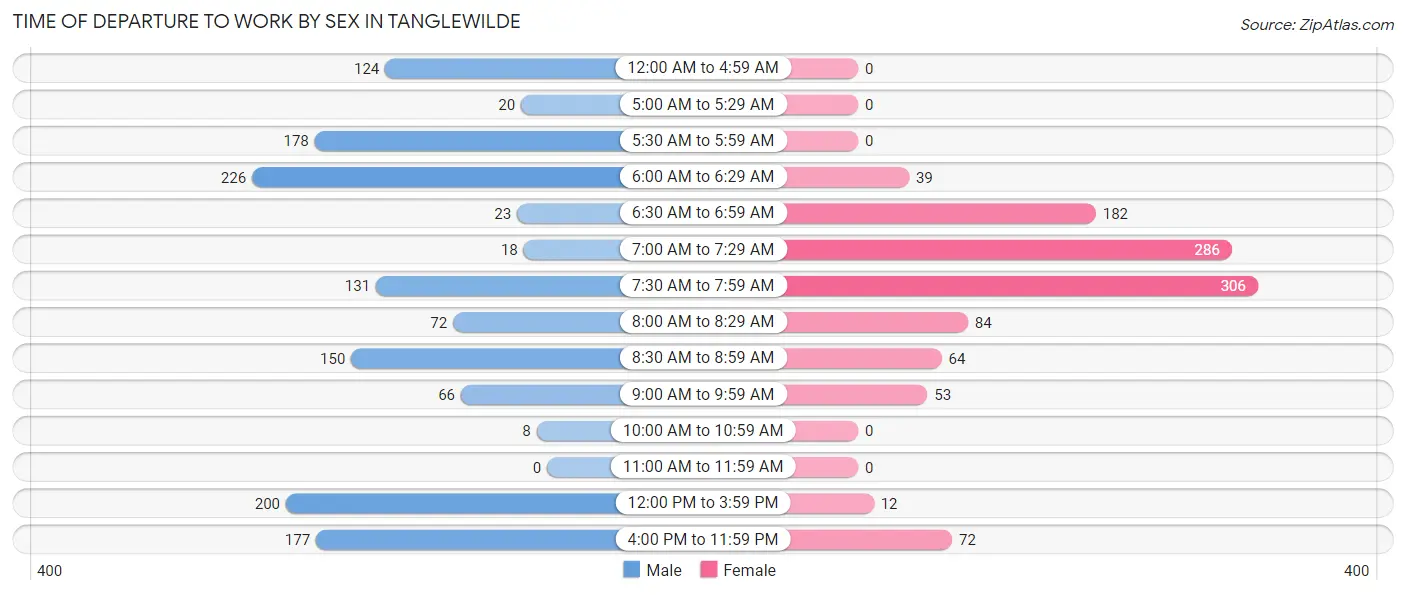
| Time of Departure | Male | Female |
| 12:00 AM to 4:59 AM | 124 (8.9%) | 0 (0.0%) |
| 5:00 AM to 5:29 AM | 20 (1.4%) | 0 (0.0%) |
| 5:30 AM to 5:59 AM | 178 (12.8%) | 0 (0.0%) |
| 6:00 AM to 6:29 AM | 226 (16.2%) | 39 (3.5%) |
| 6:30 AM to 6:59 AM | 23 (1.7%) | 182 (16.6%) |
| 7:00 AM to 7:29 AM | 18 (1.3%) | 286 (26.1%) |
| 7:30 AM to 7:59 AM | 131 (9.4%) | 306 (27.9%) |
| 8:00 AM to 8:29 AM | 72 (5.2%) | 84 (7.6%) |
| 8:30 AM to 8:59 AM | 150 (10.8%) | 64 (5.8%) |
| 9:00 AM to 9:59 AM | 66 (4.7%) | 53 (4.8%) |
| 10:00 AM to 10:59 AM | 8 (0.6%) | 0 (0.0%) |
| 11:00 AM to 11:59 AM | 0 (0.0%) | 0 (0.0%) |
| 12:00 PM to 3:59 PM | 200 (14.4%) | 12 (1.1%) |
| 4:00 PM to 11:59 PM | 177 (12.7%) | 72 (6.6%) |
| Total | 1,393 (100.0%) | 1,098 (100.0%) |
Housing Occupancy in Tanglewilde
Occupancy by Ownership in Tanglewilde
Of the total 2,396 dwellings in Tanglewilde, owner-occupied units account for 1,497 (62.5%), while renter-occupied units make up 899 (37.5%).
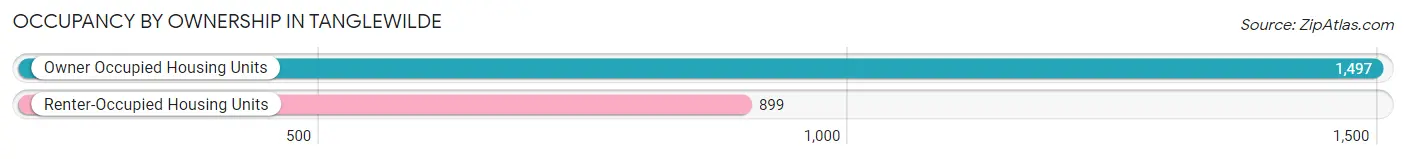
| Occupancy | # Housing Units | % Housing Units |
| Owner Occupied Housing Units | 1,497 | 62.5% |
| Renter-Occupied Housing Units | 899 | 37.5% |
| Total Occupied Housing Units | 2,396 | 100.0% |
Occupancy by Household Size in Tanglewilde
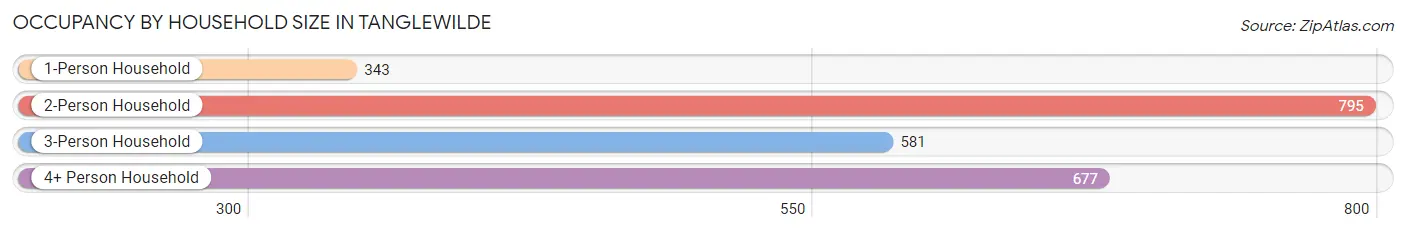
| Household Size | # Housing Units | % Housing Units |
| 1-Person Household | 343 | 14.3% |
| 2-Person Household | 795 | 33.2% |
| 3-Person Household | 581 | 24.2% |
| 4+ Person Household | 677 | 28.3% |
| Total Housing Units | 2,396 | 100.0% |
Occupancy by Ownership by Household Size in Tanglewilde
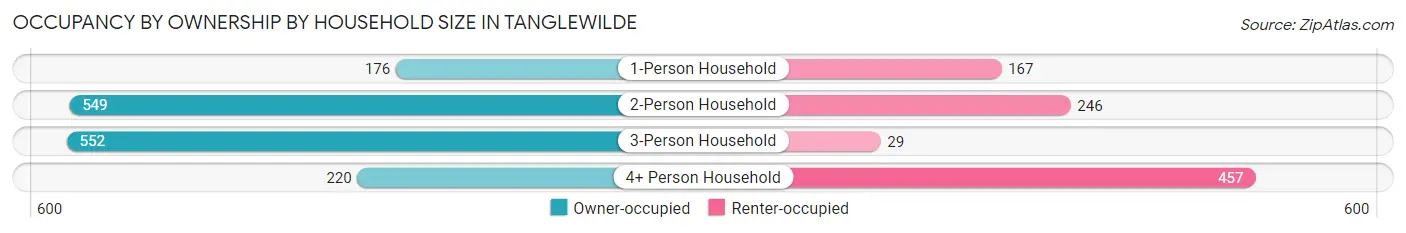
| Household Size | Owner-occupied | Renter-occupied |
| 1-Person Household | 176 (51.3%) | 167 (48.7%) |
| 2-Person Household | 549 (69.1%) | 246 (30.9%) |
| 3-Person Household | 552 (95.0%) | 29 (5.0%) |
| 4+ Person Household | 220 (32.5%) | 457 (67.5%) |
| Total Housing Units | 1,497 (62.5%) | 899 (37.5%) |
Occupancy by Educational Attainment in Tanglewilde
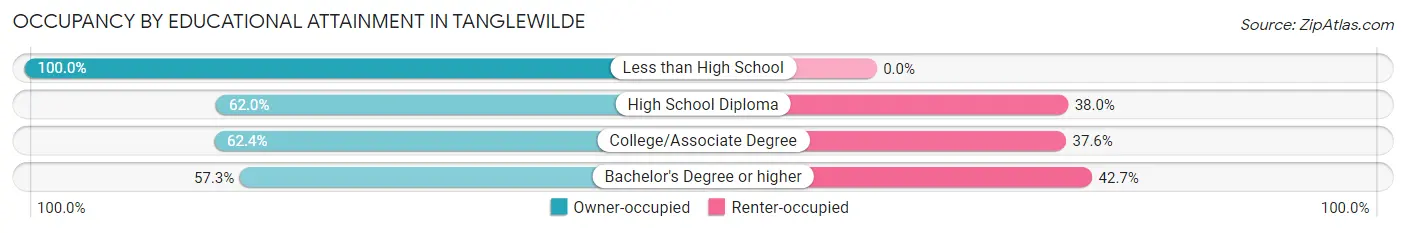
| Household Size | Owner-occupied | Renter-occupied |
| Less than High School | 85 (100.0%) | 0 (0.0%) |
| High School Diploma | 616 (62.0%) | 377 (38.0%) |
| College/Associate Degree | 497 (62.4%) | 299 (37.6%) |
| Bachelor's Degree or higher | 299 (57.3%) | 223 (42.7%) |
Occupancy by Age of Householder in Tanglewilde
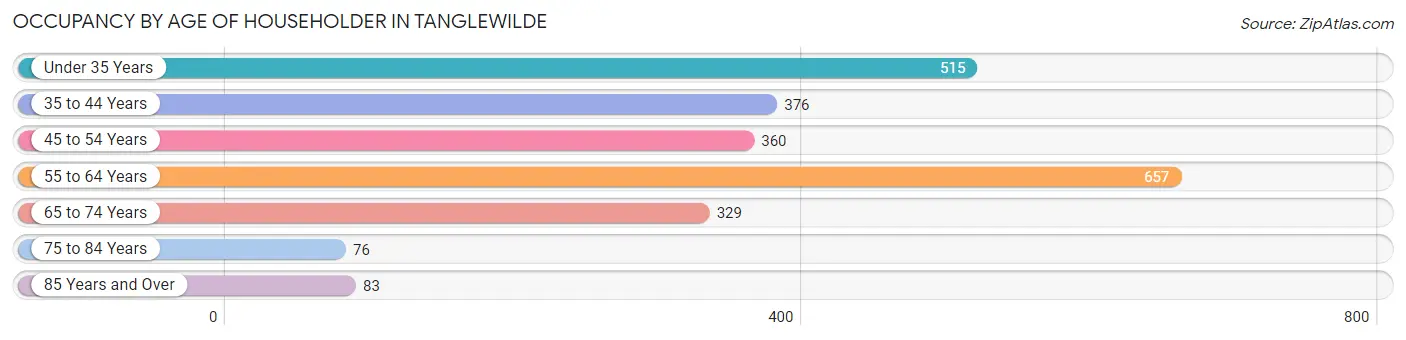
| Age Bracket | # Households | % Households |
| Under 35 Years | 515 | 21.5% |
| 35 to 44 Years | 376 | 15.7% |
| 45 to 54 Years | 360 | 15.0% |
| 55 to 64 Years | 657 | 27.4% |
| 65 to 74 Years | 329 | 13.7% |
| 75 to 84 Years | 76 | 3.2% |
| 85 Years and Over | 83 | 3.5% |
| Total | 2,396 | 100.0% |
Housing Finances in Tanglewilde
Median Income by Occupancy in Tanglewilde
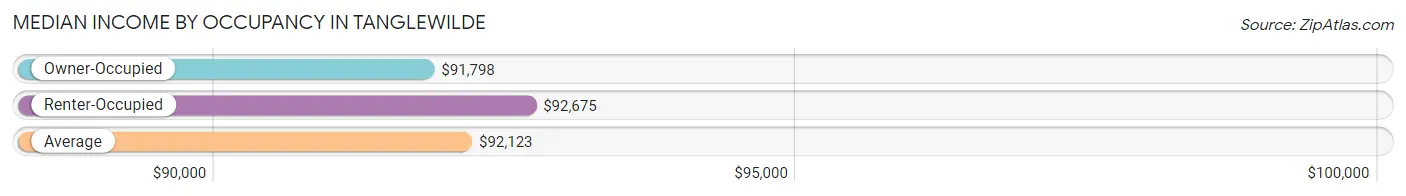
| Occupancy Type | # Households | Median Income |
| Owner-Occupied | 1,497 (62.5%) | $91,798 |
| Renter-Occupied | 899 (37.5%) | $92,675 |
| Average | 2,396 (100.0%) | $92,123 |
Occupancy by Householder Income Bracket in Tanglewilde
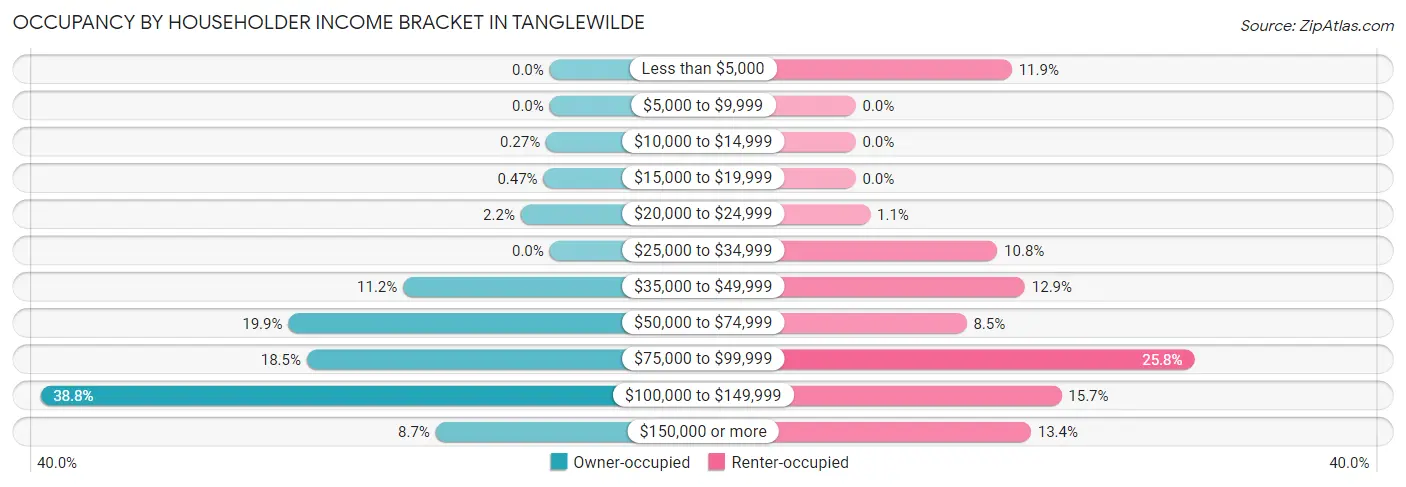
| Income Bracket | Owner-occupied | Renter-occupied |
| Less than $5,000 | 0 (0.0%) | 107 (11.9%) |
| $5,000 to $9,999 | 0 (0.0%) | 0 (0.0%) |
| $10,000 to $14,999 | 4 (0.3%) | 0 (0.0%) |
| $15,000 to $19,999 | 7 (0.5%) | 0 (0.0%) |
| $20,000 to $24,999 | 33 (2.2%) | 10 (1.1%) |
| $25,000 to $34,999 | 0 (0.0%) | 97 (10.8%) |
| $35,000 to $49,999 | 167 (11.2%) | 116 (12.9%) |
| $50,000 to $74,999 | 298 (19.9%) | 76 (8.5%) |
| $75,000 to $99,999 | 277 (18.5%) | 232 (25.8%) |
| $100,000 to $149,999 | 581 (38.8%) | 141 (15.7%) |
| $150,000 or more | 130 (8.7%) | 120 (13.4%) |
| Total | 1,497 (100.0%) | 899 (100.0%) |
Monthly Housing Cost Tiers in Tanglewilde
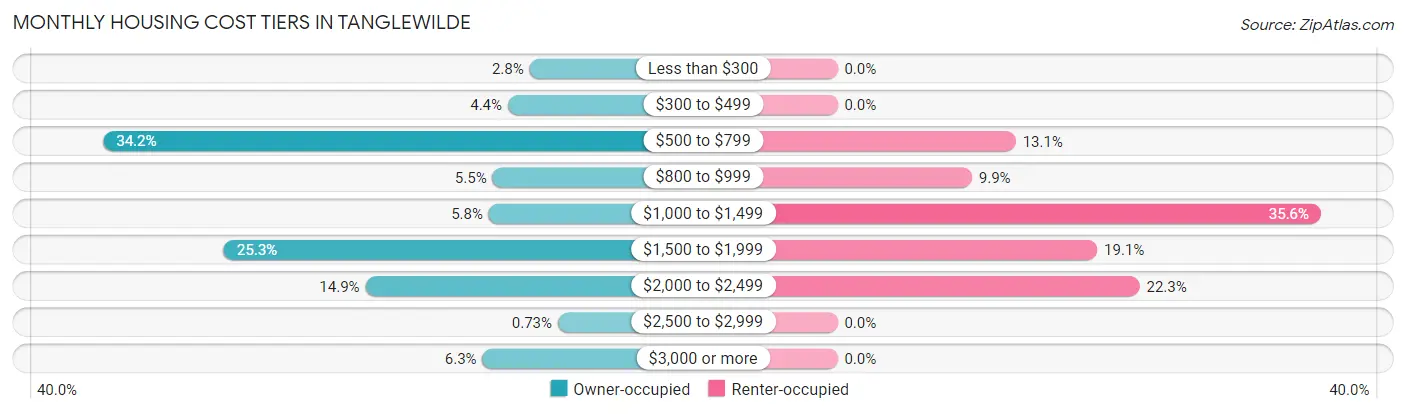
| Monthly Cost | Owner-occupied | Renter-occupied |
| Less than $300 | 42 (2.8%) | 0 (0.0%) |
| $300 to $499 | 66 (4.4%) | 0 (0.0%) |
| $500 to $799 | 512 (34.2%) | 118 (13.1%) |
| $800 to $999 | 83 (5.5%) | 89 (9.9%) |
| $1,000 to $1,499 | 87 (5.8%) | 320 (35.6%) |
| $1,500 to $1,999 | 379 (25.3%) | 172 (19.1%) |
| $2,000 to $2,499 | 223 (14.9%) | 200 (22.3%) |
| $2,500 to $2,999 | 11 (0.7%) | 0 (0.0%) |
| $3,000 or more | 94 (6.3%) | 0 (0.0%) |
| Total | 1,497 (100.0%) | 899 (100.0%) |
Physical Housing Characteristics in Tanglewilde
Housing Structures in Tanglewilde
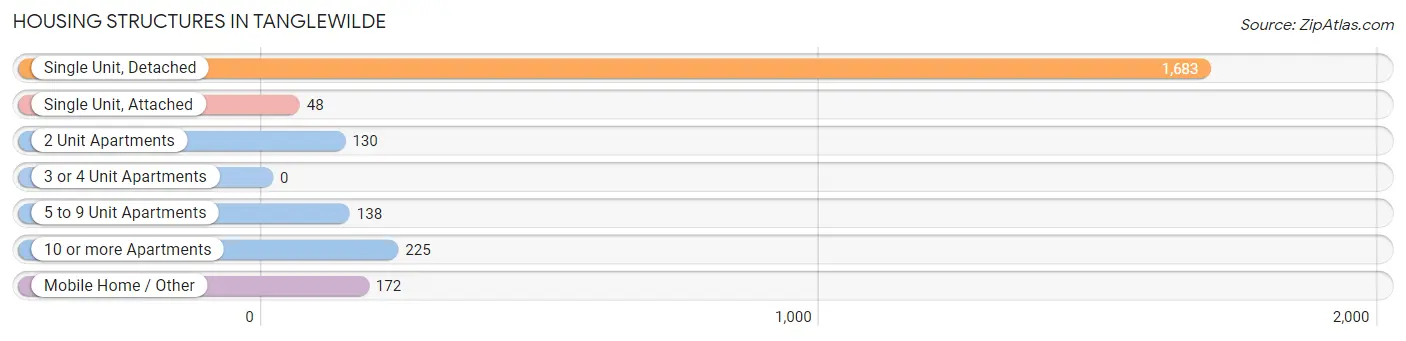
| Structure Type | # Housing Units | % Housing Units |
| Single Unit, Detached | 1,683 | 70.2% |
| Single Unit, Attached | 48 | 2.0% |
| 2 Unit Apartments | 130 | 5.4% |
| 3 or 4 Unit Apartments | 0 | 0.0% |
| 5 to 9 Unit Apartments | 138 | 5.8% |
| 10 or more Apartments | 225 | 9.4% |
| Mobile Home / Other | 172 | 7.2% |
| Total | 2,396 | 100.0% |
Housing Structures by Occupancy in Tanglewilde
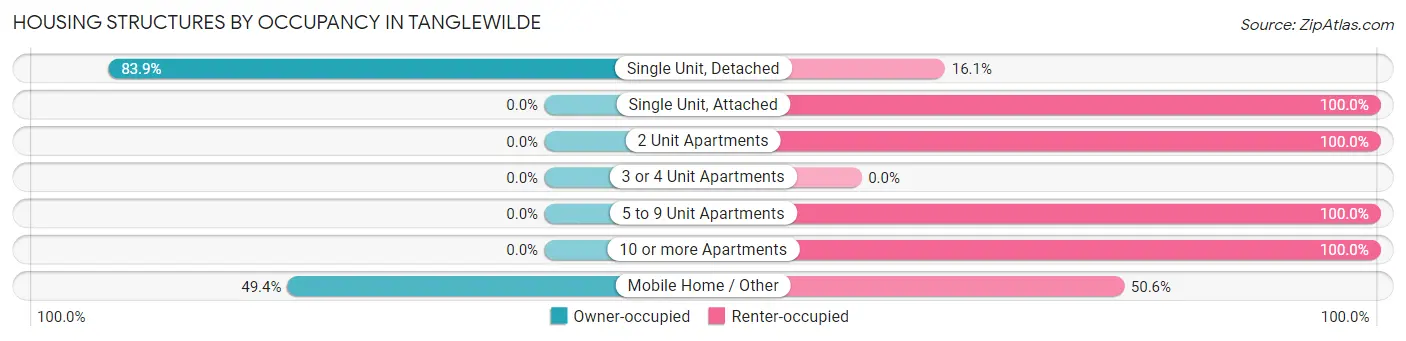
| Structure Type | Owner-occupied | Renter-occupied |
| Single Unit, Detached | 1,412 (83.9%) | 271 (16.1%) |
| Single Unit, Attached | 0 (0.0%) | 48 (100.0%) |
| 2 Unit Apartments | 0 (0.0%) | 130 (100.0%) |
| 3 or 4 Unit Apartments | 0 (0.0%) | 0 (0.0%) |
| 5 to 9 Unit Apartments | 0 (0.0%) | 138 (100.0%) |
| 10 or more Apartments | 0 (0.0%) | 225 (100.0%) |
| Mobile Home / Other | 85 (49.4%) | 87 (50.6%) |
| Total | 1,497 (62.5%) | 899 (37.5%) |
Housing Structures by Number of Rooms in Tanglewilde
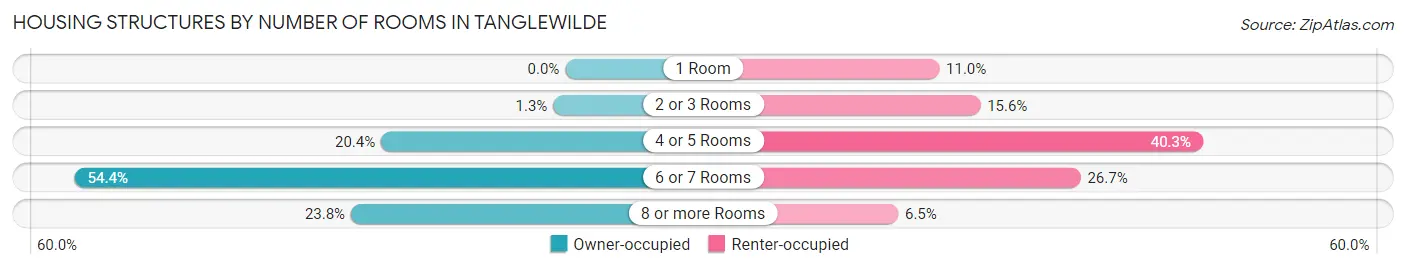
| Number of Rooms | Owner-occupied | Renter-occupied |
| 1 Room | 0 (0.0%) | 99 (11.0%) |
| 2 or 3 Rooms | 20 (1.3%) | 140 (15.6%) |
| 4 or 5 Rooms | 306 (20.4%) | 362 (40.3%) |
| 6 or 7 Rooms | 815 (54.4%) | 240 (26.7%) |
| 8 or more Rooms | 356 (23.8%) | 58 (6.5%) |
| Total | 1,497 (100.0%) | 899 (100.0%) |
Housing Structure by Heating Type in Tanglewilde
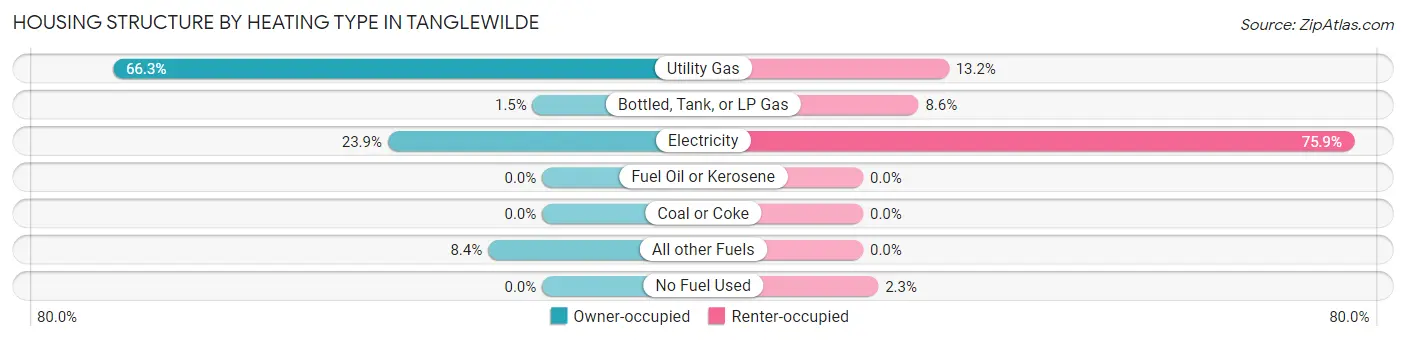
| Heating Type | Owner-occupied | Renter-occupied |
| Utility Gas | 993 (66.3%) | 119 (13.2%) |
| Bottled, Tank, or LP Gas | 22 (1.5%) | 77 (8.6%) |
| Electricity | 357 (23.8%) | 682 (75.9%) |
| Fuel Oil or Kerosene | 0 (0.0%) | 0 (0.0%) |
| Coal or Coke | 0 (0.0%) | 0 (0.0%) |
| All other Fuels | 125 (8.4%) | 0 (0.0%) |
| No Fuel Used | 0 (0.0%) | 21 (2.3%) |
| Total | 1,497 (100.0%) | 899 (100.0%) |
Household Vehicle Usage in Tanglewilde
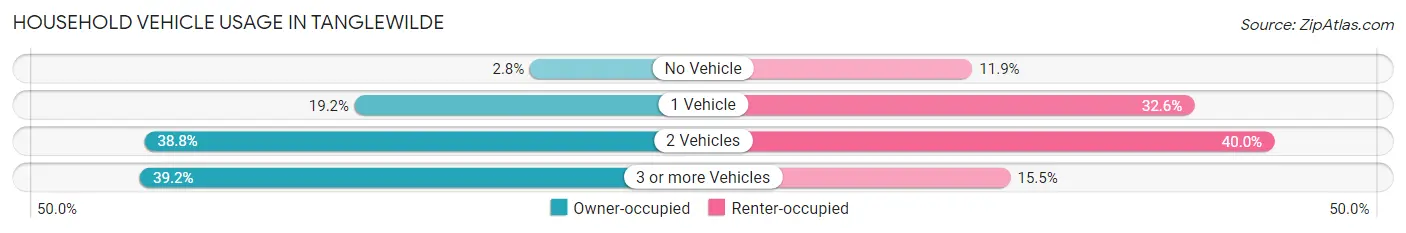
| Vehicles per Household | Owner-occupied | Renter-occupied |
| No Vehicle | 42 (2.8%) | 107 (11.9%) |
| 1 Vehicle | 287 (19.2%) | 293 (32.6%) |
| 2 Vehicles | 581 (38.8%) | 360 (40.0%) |
| 3 or more Vehicles | 587 (39.2%) | 139 (15.5%) |
| Total | 1,497 (100.0%) | 899 (100.0%) |
Real Estate & Mortgages in Tanglewilde
Real Estate and Mortgage Overview in Tanglewilde
| Characteristic | Without Mortgage | With Mortgage |
| Housing Units | 636 | 861 |
| Median Property Value | $451,100 | $352,200 |
| Median Household Income | $95,294 | $86 |
| Monthly Housing Costs | $668 | $94 |
| Real Estate Taxes | $3,879 | $82 |
Property Value by Mortgage Status in Tanglewilde
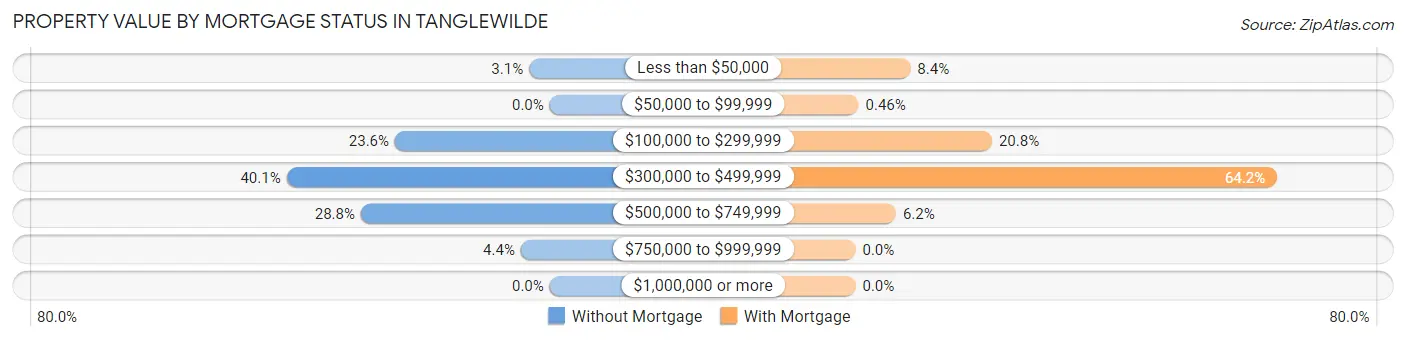
| Property Value | Without Mortgage | With Mortgage |
| Less than $50,000 | 20 (3.1%) | 72 (8.4%) |
| $50,000 to $99,999 | 0 (0.0%) | 4 (0.5%) |
| $100,000 to $299,999 | 150 (23.6%) | 179 (20.8%) |
| $300,000 to $499,999 | 255 (40.1%) | 553 (64.2%) |
| $500,000 to $749,999 | 183 (28.8%) | 53 (6.2%) |
| $750,000 to $999,999 | 28 (4.4%) | 0 (0.0%) |
| $1,000,000 or more | 0 (0.0%) | 0 (0.0%) |
| Total | 636 (100.0%) | 861 (100.0%) |
Household Income by Mortgage Status in Tanglewilde
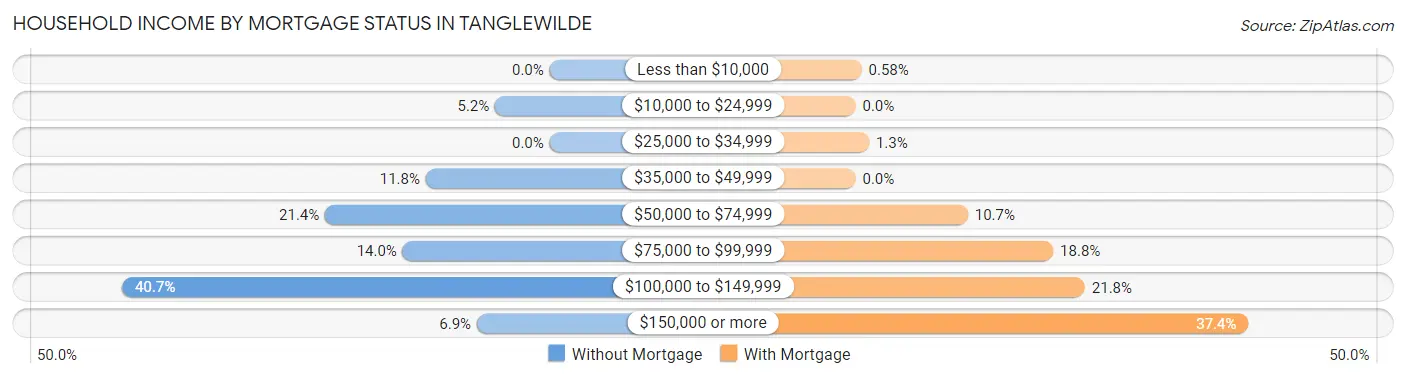
| Household Income | Without Mortgage | With Mortgage |
| Less than $10,000 | 0 (0.0%) | 5 (0.6%) |
| $10,000 to $24,999 | 33 (5.2%) | 0 (0.0%) |
| $25,000 to $34,999 | 0 (0.0%) | 11 (1.3%) |
| $35,000 to $49,999 | 75 (11.8%) | 0 (0.0%) |
| $50,000 to $74,999 | 136 (21.4%) | 92 (10.7%) |
| $75,000 to $99,999 | 89 (14.0%) | 162 (18.8%) |
| $100,000 to $149,999 | 259 (40.7%) | 188 (21.8%) |
| $150,000 or more | 44 (6.9%) | 322 (37.4%) |
| Total | 636 (100.0%) | 861 (100.0%) |
Property Value to Household Income Ratio in Tanglewilde
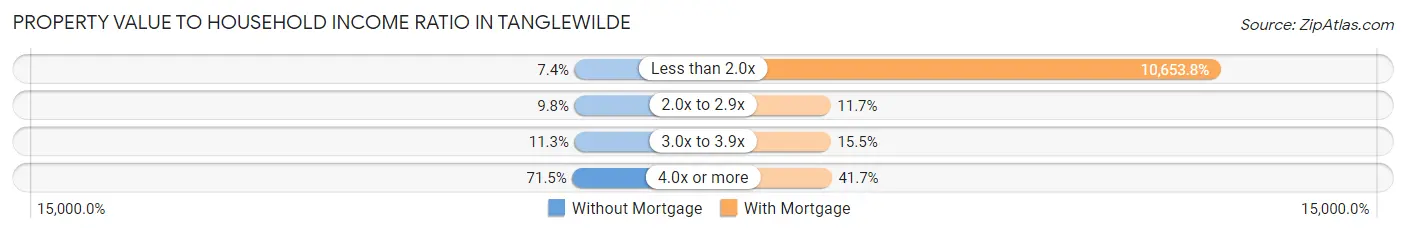
| Value-to-Income Ratio | Without Mortgage | With Mortgage |
| Less than 2.0x | 47 (7.4%) | 91,729 (10,653.8%) |
| 2.0x to 2.9x | 62 (9.8%) | 101 (11.7%) |
| 3.0x to 3.9x | 72 (11.3%) | 133 (15.4%) |
| 4.0x or more | 455 (71.5%) | 359 (41.7%) |
| Total | 636 (100.0%) | 861 (100.0%) |
Real Estate Taxes by Mortgage Status in Tanglewilde
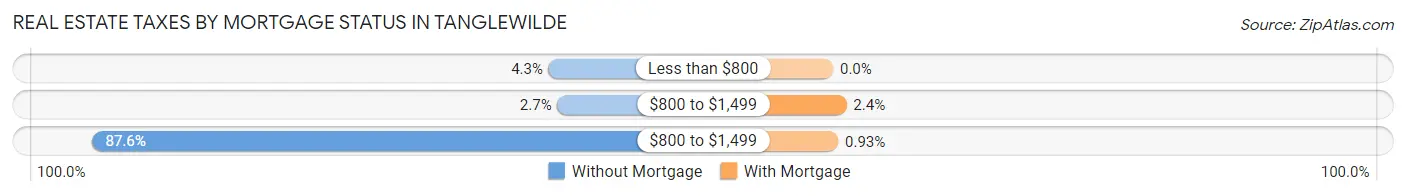
| Property Taxes | Without Mortgage | With Mortgage |
| Less than $800 | 27 (4.3%) | 0 (0.0%) |
| $800 to $1,499 | 17 (2.7%) | 21 (2.4%) |
| $800 to $1,499 | 557 (87.6%) | 8 (0.9%) |
| Total | 636 (100.0%) | 861 (100.0%) |
Health & Disability in Tanglewilde
Health Insurance Coverage by Age in Tanglewilde
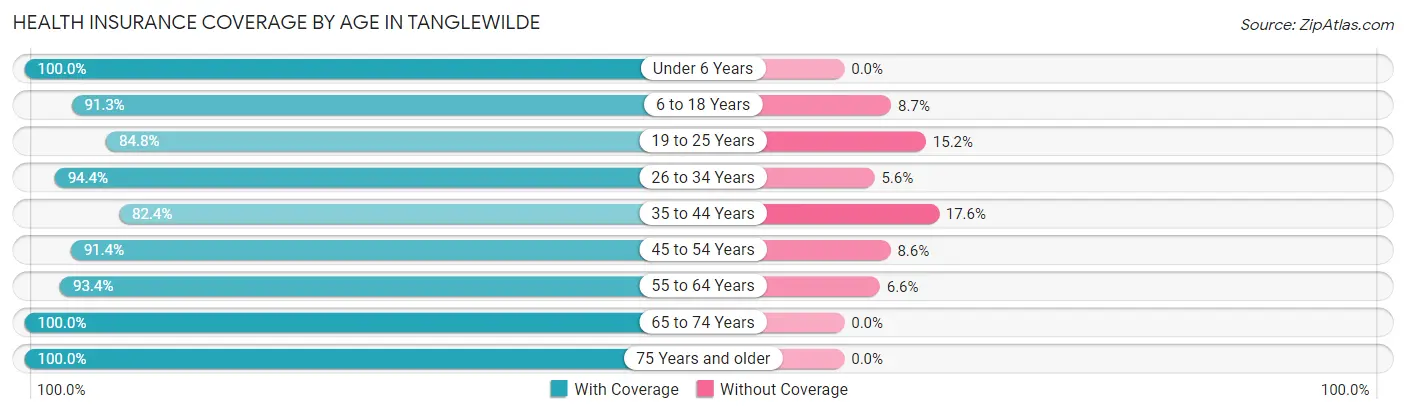
| Age Bracket | With Coverage | Without Coverage |
| Under 6 Years | 770 (100.0%) | 0 (0.0%) |
| 6 to 18 Years | 752 (91.3%) | 72 (8.7%) |
| 19 to 25 Years | 563 (84.8%) | 101 (15.2%) |
| 26 to 34 Years | 621 (94.4%) | 37 (5.6%) |
| 35 to 44 Years | 589 (82.4%) | 126 (17.6%) |
| 45 to 54 Years | 520 (91.4%) | 49 (8.6%) |
| 55 to 64 Years | 1,157 (93.4%) | 82 (6.6%) |
| 65 to 74 Years | 509 (100.0%) | 0 (0.0%) |
| 75 Years and older | 414 (100.0%) | 0 (0.0%) |
| Total | 5,895 (92.7%) | 467 (7.3%) |
Health Insurance Coverage by Citizenship Status in Tanglewilde
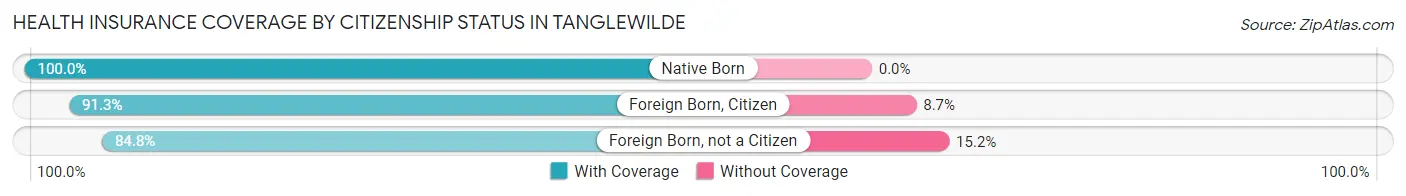
| Citizenship Status | With Coverage | Without Coverage |
| Native Born | 770 (100.0%) | 0 (0.0%) |
| Foreign Born, Citizen | 752 (91.3%) | 72 (8.7%) |
| Foreign Born, not a Citizen | 563 (84.8%) | 101 (15.2%) |
Health Insurance Coverage by Household Income in Tanglewilde
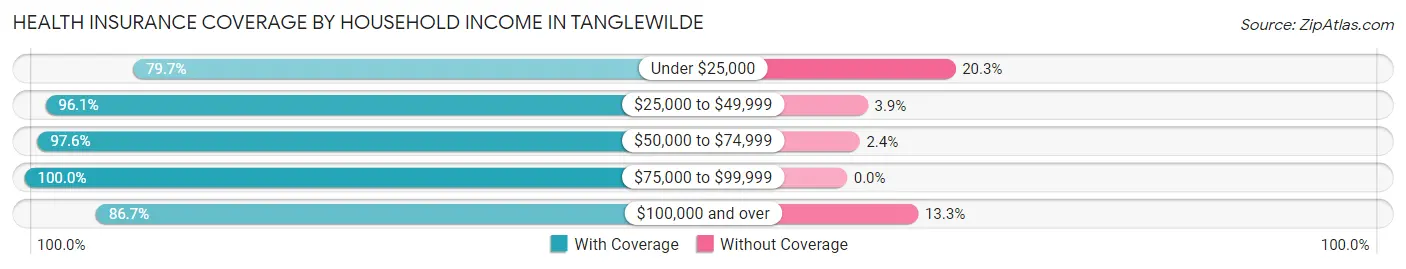
| Household Income | With Coverage | Without Coverage |
| Under $25,000 | 208 (79.7%) | 53 (20.3%) |
| $25,000 to $49,999 | 990 (96.1%) | 40 (3.9%) |
| $50,000 to $74,999 | 901 (97.6%) | 22 (2.4%) |
| $75,000 to $99,999 | 1,437 (100.0%) | 0 (0.0%) |
| $100,000 and over | 2,286 (86.7%) | 352 (13.3%) |
Public vs Private Health Insurance Coverage by Age in Tanglewilde
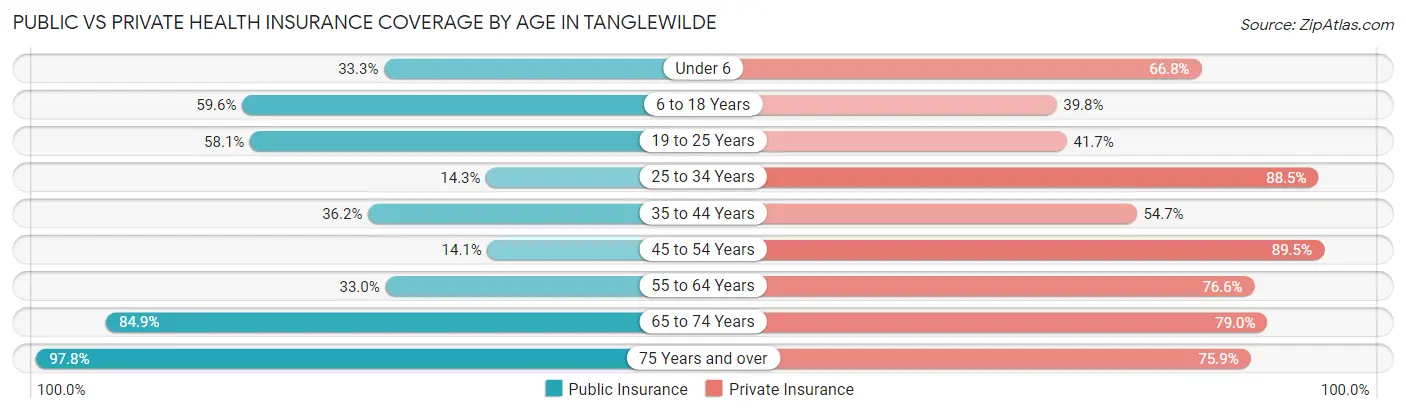
| Age Bracket | Public Insurance | Private Insurance |
| Under 6 | 256 (33.3%) | 514 (66.7%) |
| 6 to 18 Years | 491 (59.6%) | 328 (39.8%) |
| 19 to 25 Years | 386 (58.1%) | 277 (41.7%) |
| 25 to 34 Years | 94 (14.3%) | 582 (88.4%) |
| 35 to 44 Years | 259 (36.2%) | 391 (54.7%) |
| 45 to 54 Years | 80 (14.1%) | 509 (89.5%) |
| 55 to 64 Years | 409 (33.0%) | 949 (76.6%) |
| 65 to 74 Years | 432 (84.9%) | 402 (79.0%) |
| 75 Years and over | 405 (97.8%) | 314 (75.8%) |
| Total | 2,812 (44.2%) | 4,266 (67.0%) |
Disability Status by Sex by Age in Tanglewilde
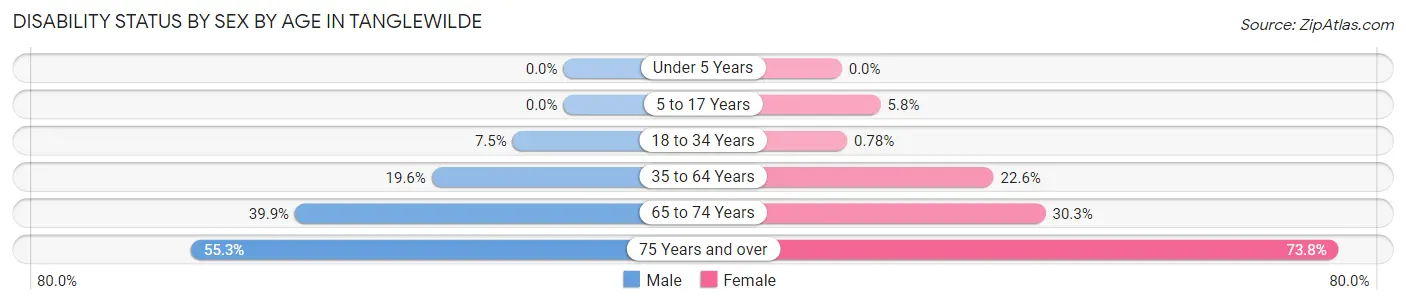
| Age Bracket | Male | Female |
| Under 5 Years | 0 (0.0%) | 0 (0.0%) |
| 5 to 17 Years | 0 (0.0%) | 30 (5.8%) |
| 18 to 34 Years | 46 (7.5%) | 6 (0.8%) |
| 35 to 64 Years | 242 (19.6%) | 290 (22.6%) |
| 65 to 74 Years | 112 (39.9%) | 69 (30.3%) |
| 75 Years and over | 73 (55.3%) | 208 (73.8%) |
Disability Class by Sex by Age in Tanglewilde
Disability Class: Hearing Difficulty
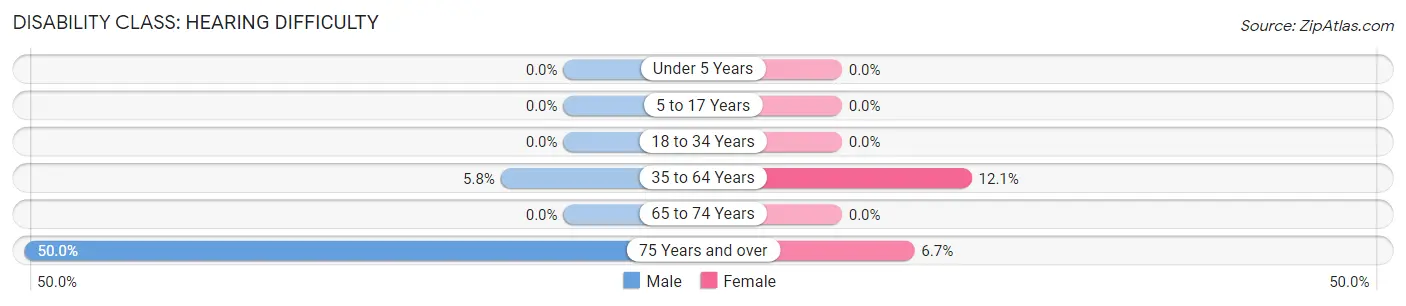
| Age Bracket | Male | Female |
| Under 5 Years | 0 (0.0%) | 0 (0.0%) |
| 5 to 17 Years | 0 (0.0%) | 0 (0.0%) |
| 18 to 34 Years | 0 (0.0%) | 0 (0.0%) |
| 35 to 64 Years | 72 (5.8%) | 155 (12.0%) |
| 65 to 74 Years | 0 (0.0%) | 0 (0.0%) |
| 75 Years and over | 66 (50.0%) | 19 (6.7%) |
Disability Class: Vision Difficulty
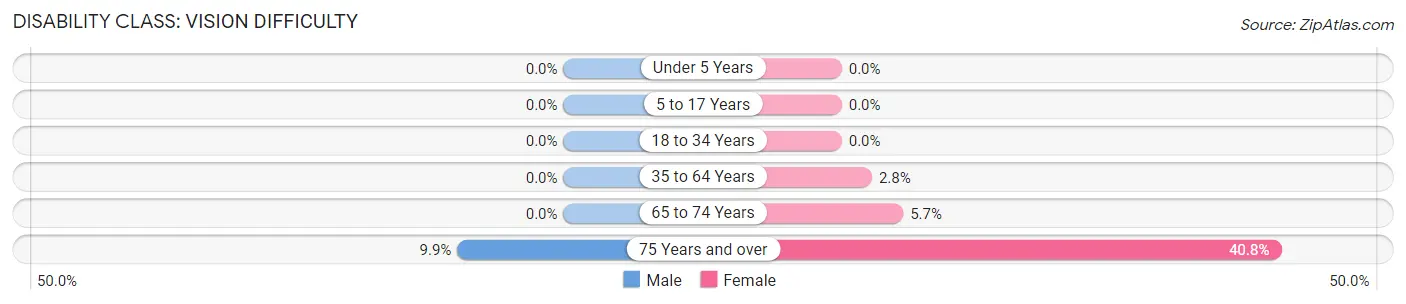
| Age Bracket | Male | Female |
| Under 5 Years | 0 (0.0%) | 0 (0.0%) |
| 5 to 17 Years | 0 (0.0%) | 0 (0.0%) |
| 18 to 34 Years | 0 (0.0%) | 0 (0.0%) |
| 35 to 64 Years | 0 (0.0%) | 36 (2.8%) |
| 65 to 74 Years | 0 (0.0%) | 13 (5.7%) |
| 75 Years and over | 13 (9.9%) | 115 (40.8%) |
Disability Class: Cognitive Difficulty
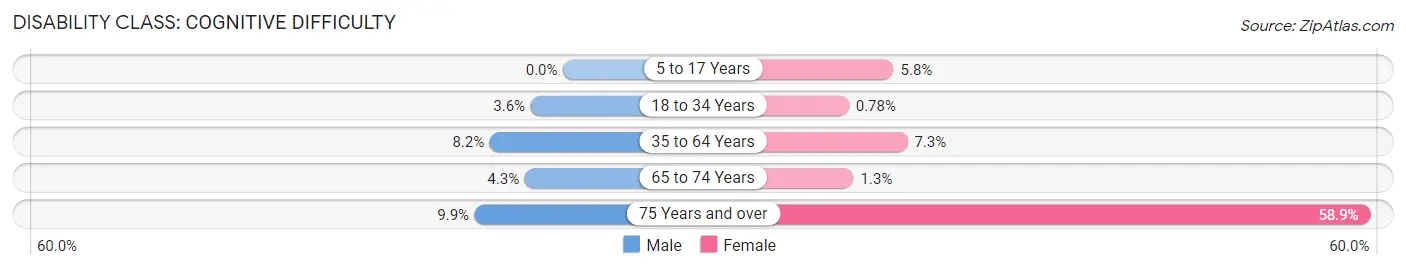
| Age Bracket | Male | Female |
| 5 to 17 Years | 0 (0.0%) | 30 (5.8%) |
| 18 to 34 Years | 22 (3.6%) | 6 (0.8%) |
| 35 to 64 Years | 101 (8.2%) | 94 (7.3%) |
| 65 to 74 Years | 12 (4.3%) | 3 (1.3%) |
| 75 Years and over | 13 (9.9%) | 166 (58.9%) |
Disability Class: Ambulatory Difficulty
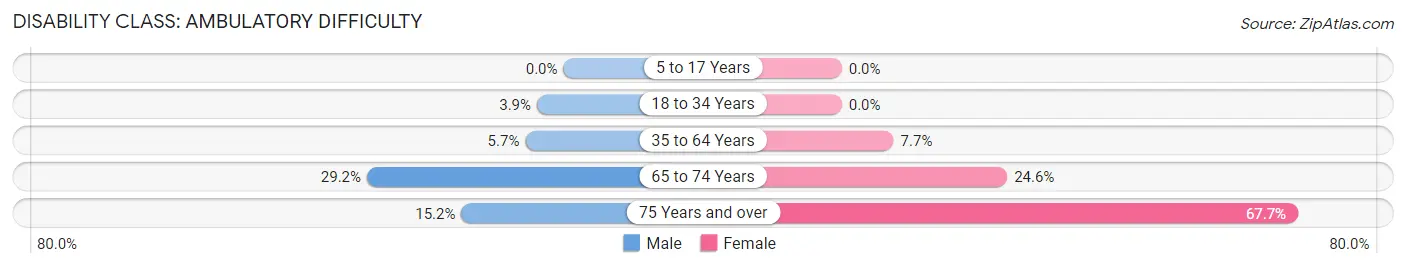
| Age Bracket | Male | Female |
| 5 to 17 Years | 0 (0.0%) | 0 (0.0%) |
| 18 to 34 Years | 24 (3.9%) | 0 (0.0%) |
| 35 to 64 Years | 70 (5.7%) | 99 (7.7%) |
| 65 to 74 Years | 82 (29.2%) | 56 (24.6%) |
| 75 Years and over | 20 (15.1%) | 191 (67.7%) |
Disability Class: Self-Care Difficulty
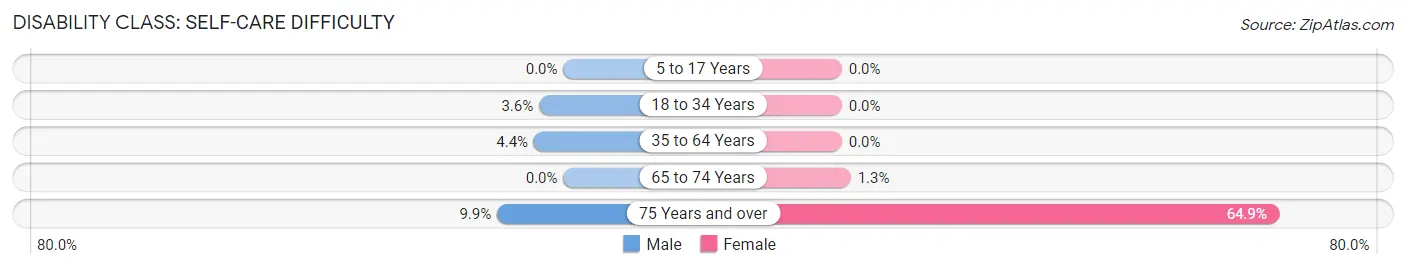
| Age Bracket | Male | Female |
| 5 to 17 Years | 0 (0.0%) | 0 (0.0%) |
| 18 to 34 Years | 22 (3.6%) | 0 (0.0%) |
| 35 to 64 Years | 54 (4.4%) | 0 (0.0%) |
| 65 to 74 Years | 0 (0.0%) | 3 (1.3%) |
| 75 Years and over | 13 (9.9%) | 183 (64.9%) |
Technology Access in Tanglewilde
Computing Device Access in Tanglewilde
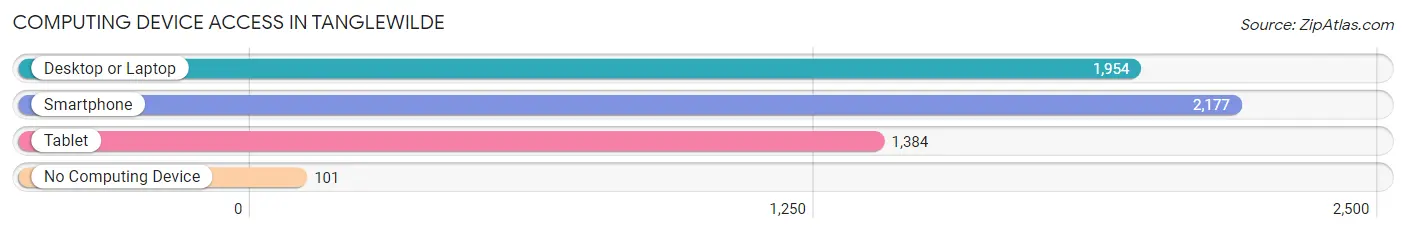
| Device Type | # Households | % Households |
| Desktop or Laptop | 1,954 | 81.6% |
| Smartphone | 2,177 | 90.9% |
| Tablet | 1,384 | 57.8% |
| No Computing Device | 101 | 4.2% |
| Total | 2,396 | 100.0% |
Internet Access in Tanglewilde
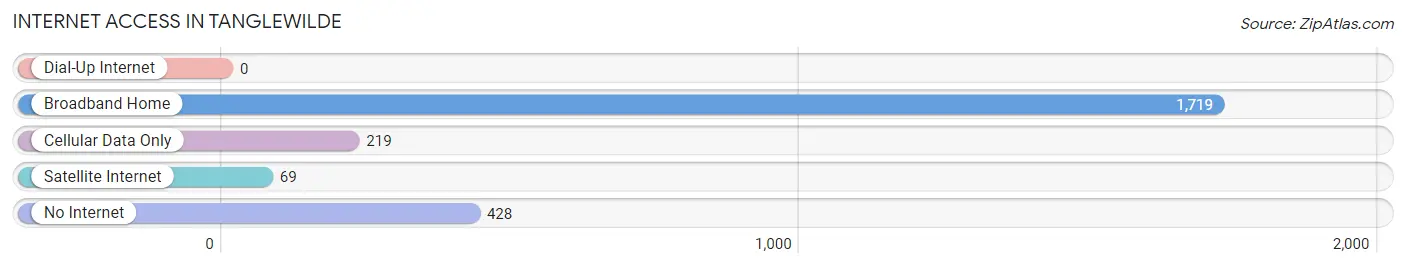
| Internet Type | # Households | % Households |
| Dial-Up Internet | 0 | 0.0% |
| Broadband Home | 1,719 | 71.7% |
| Cellular Data Only | 219 | 9.1% |
| Satellite Internet | 69 | 2.9% |
| No Internet | 428 | 17.9% |
| Total | 2,396 | 100.0% |
Tanglewilde Summary
Tanglewilde is a census-designated place (CDP) located in Thurston County, Washington, United States. The population was 8,845 at the 2010 census. It is part of the Olympia-Lacey-Tumwater Metropolitan Statistical Area.
History
Tanglewilde was first settled in the late 1800s by homesteaders who were attracted to the area by its abundant natural resources. The area was originally known as "Tanglewilde Prairie" and was home to a variety of small farms and ranches. In the early 1900s, the area began to develop into a small community, with the first post office opening in 1910.
The area continued to grow throughout the 20th century, with the population increasing from just over 1,000 in 1950 to 8,845 in 2010. The area was officially designated as a census-designated place in 2010.
Geography
Tanglewilde is located in the western part of Thurston County, Washington, at an elevation of approximately 200 feet. It is situated on the western edge of the Puget Sound lowlands, and is bordered by the cities of Olympia and Lacey to the north and east, respectively.
The area is characterized by rolling hills and valleys, with the highest point in the area being located at an elevation of approximately 500 feet. The area is also home to several small lakes, including Lake Tanglewilde, which is located just south of the CDP.
Economy
The economy of Tanglewilde is largely based on the service industry, with the majority of the population employed in retail, healthcare, and education. The area is also home to several small businesses, including a number of restaurants, grocery stores, and other retail establishments.
The area is also home to a number of light industrial businesses, including a number of manufacturing and distribution centers. The area is also home to a number of government offices, including the Thurston County Courthouse and the Thurston County Sheriff's Office.
Demographics
As of the 2010 census, the population of Tanglewilde was 8,845. The racial makeup of the area was 79.3% White, 8.2% Hispanic or Latino, 6.2% Asian, 4.2% African American, and 2.1% Native American.
The median household income in Tanglewilde was $60,945, and the median family income was $68,945. The per capita income was $27,945. The unemployment rate was 5.2%.
Conclusion
Tanglewilde is a census-designated place located in Thurston County, Washington. The area was first settled in the late 1800s and has grown steadily since then, with the population increasing from just over 1,000 in 1950 to 8,845 in 2010. The economy of Tanglewilde is largely based on the service industry, with the majority of the population employed in retail, healthcare, and education. The area is also home to a number of light industrial businesses, including a number of manufacturing and distribution centers. As of the 2010 census, the population of Tanglewilde was 8,845, with the median household income being $60,945 and the median family income being $68,945.
Common Questions
What is Per Capita Income in Tanglewilde?
Per Capita income in Tanglewilde is $32,993.
What is the Median Family Income in Tanglewilde?
Median Family Income in Tanglewilde is $94,024.
What is the Median Household income in Tanglewilde?
Median Household Income in Tanglewilde is $92,123.
What is Income or Wage Gap in Tanglewilde?
Income or Wage Gap in Tanglewilde is 35.8%.
Women in Tanglewilde earn 64.2 cents for every dollar earned by a man.
What is Inequality or Gini Index in Tanglewilde?
Inequality or Gini Index in Tanglewilde is 0.31.
What is the Total Population of Tanglewilde?
Total Population of Tanglewilde is 6,407.
What is the Total Male Population of Tanglewilde?
Total Male Population of Tanglewilde is 2,891.
What is the Total Female Population of Tanglewilde?
Total Female Population of Tanglewilde is 3,516.
What is the Ratio of Males per 100 Females in Tanglewilde?
There are 82.22 Males per 100 Females in Tanglewilde.
What is the Ratio of Females per 100 Males in Tanglewilde?
There are 121.62 Females per 100 Males in Tanglewilde.
What is the Median Population Age in Tanglewilde?
Median Population Age in Tanglewilde is 38.5 Years.
What is the Average Family Size in Tanglewilde
Average Family Size in Tanglewilde is 2.9 People.
What is the Average Household Size in Tanglewilde
Average Household Size in Tanglewilde is 2.6 People.
How Large is the Labor Force in Tanglewilde?
There are 3,086 People in the Labor Forcein in Tanglewilde.
What is the Percentage of People in the Labor Force in Tanglewilde?
61.9% of People are in the Labor Force in Tanglewilde.
What is the Unemployment Rate in Tanglewilde?
Unemployment Rate in Tanglewilde is 9.9%.