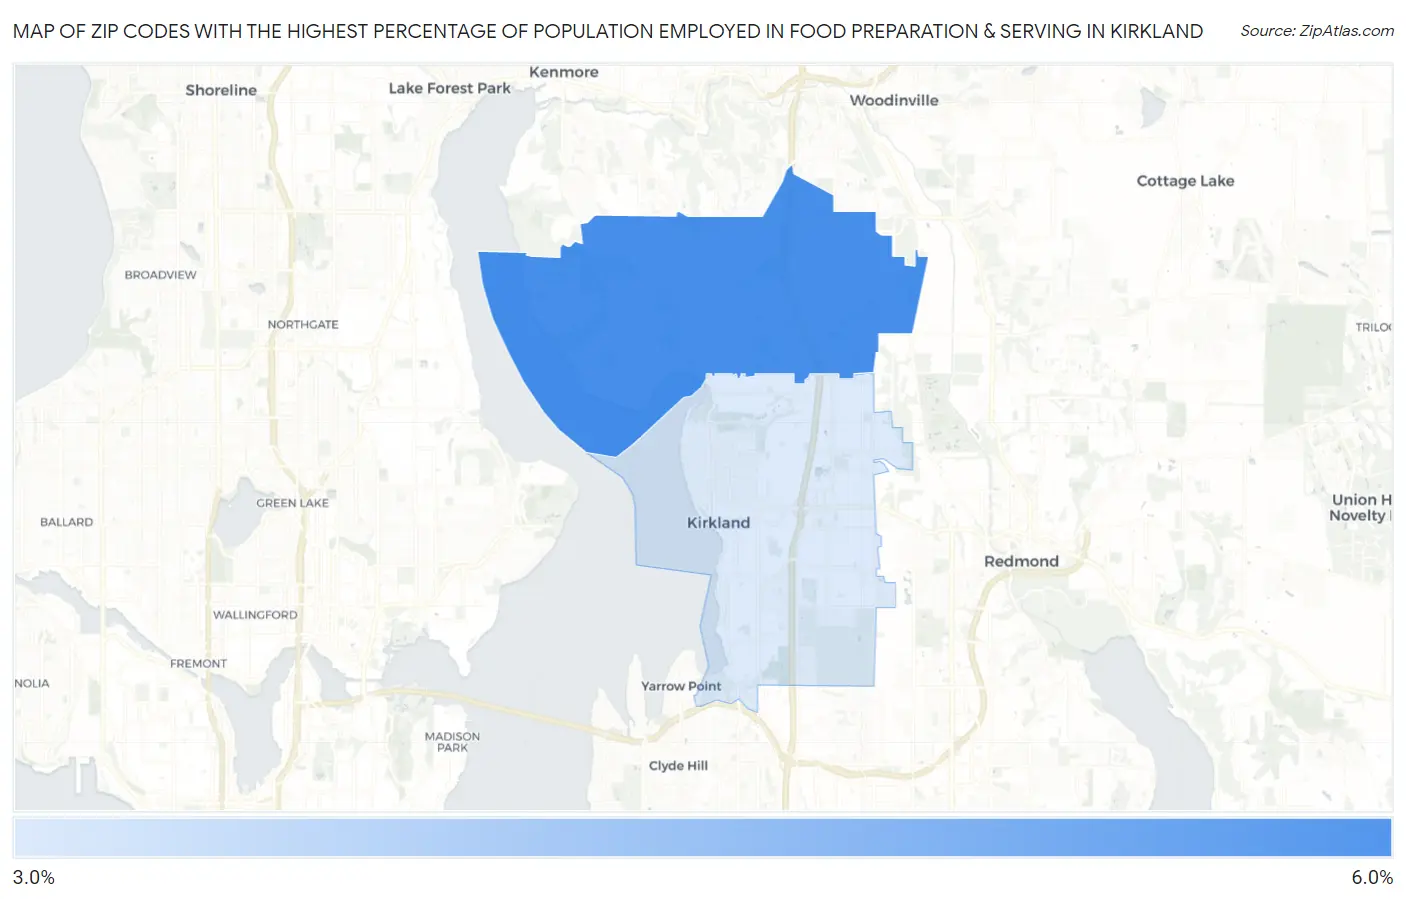
Zip Codes with the Highest Percentage of Population Employed in Food Preparation & Serving in Kirkland, WA
RELATED REPORTS & OPTIONS
Food Preparation & Serving
Kirkland
Compare Zip Codes
Map of Zip Codes with the Highest Percentage of Population Employed in Food Preparation & Serving in Kirkland
3.1%
5.7%
Zip Codes with the Highest Percentage of Population Employed in Food Preparation & Serving in Kirkland, WA
| Zip Code | % Employed | vs State | vs National | |
| 1. | 98034 | 5.7% | 5.1%(+0.563)#178 | 5.3%(+0.420)#10,314 |
| 2. | 98033 | 3.1% | 5.1%(-2.06)#390 | 5.3%(-2.20)#20,928 |
1
Common Questions
What are the Top Zip Codes with the Highest Percentage of Population Employed in Food Preparation & Serving in Kirkland, WA?
Top Zip Codes with the Highest Percentage of Population Employed in Food Preparation & Serving in Kirkland, WA are:
What zip code has the Highest Percentage of Population Employed in Food Preparation & Serving in Kirkland, WA?
98034 has the Highest Percentage of Population Employed in Food Preparation & Serving in Kirkland, WA with 5.7%.
What is the Percentage of Population Employed in Food Preparation & Serving in Kirkland, WA?
Percentage of Population Employed in Food Preparation & Serving in Kirkland is 4.5%.
What is the Percentage of Population Employed in Food Preparation & Serving in Washington?
Percentage of Population Employed in Food Preparation & Serving in Washington is 5.1%.
What is the Percentage of Population Employed in Food Preparation & Serving in the United States?
Percentage of Population Employed in Food Preparation & Serving in the United States is 5.3%.