Cities with the Highest Percentage of Dominican Population in Washington
RELATED REPORTS & OPTIONS
Dominican
Washington
Compare Cities
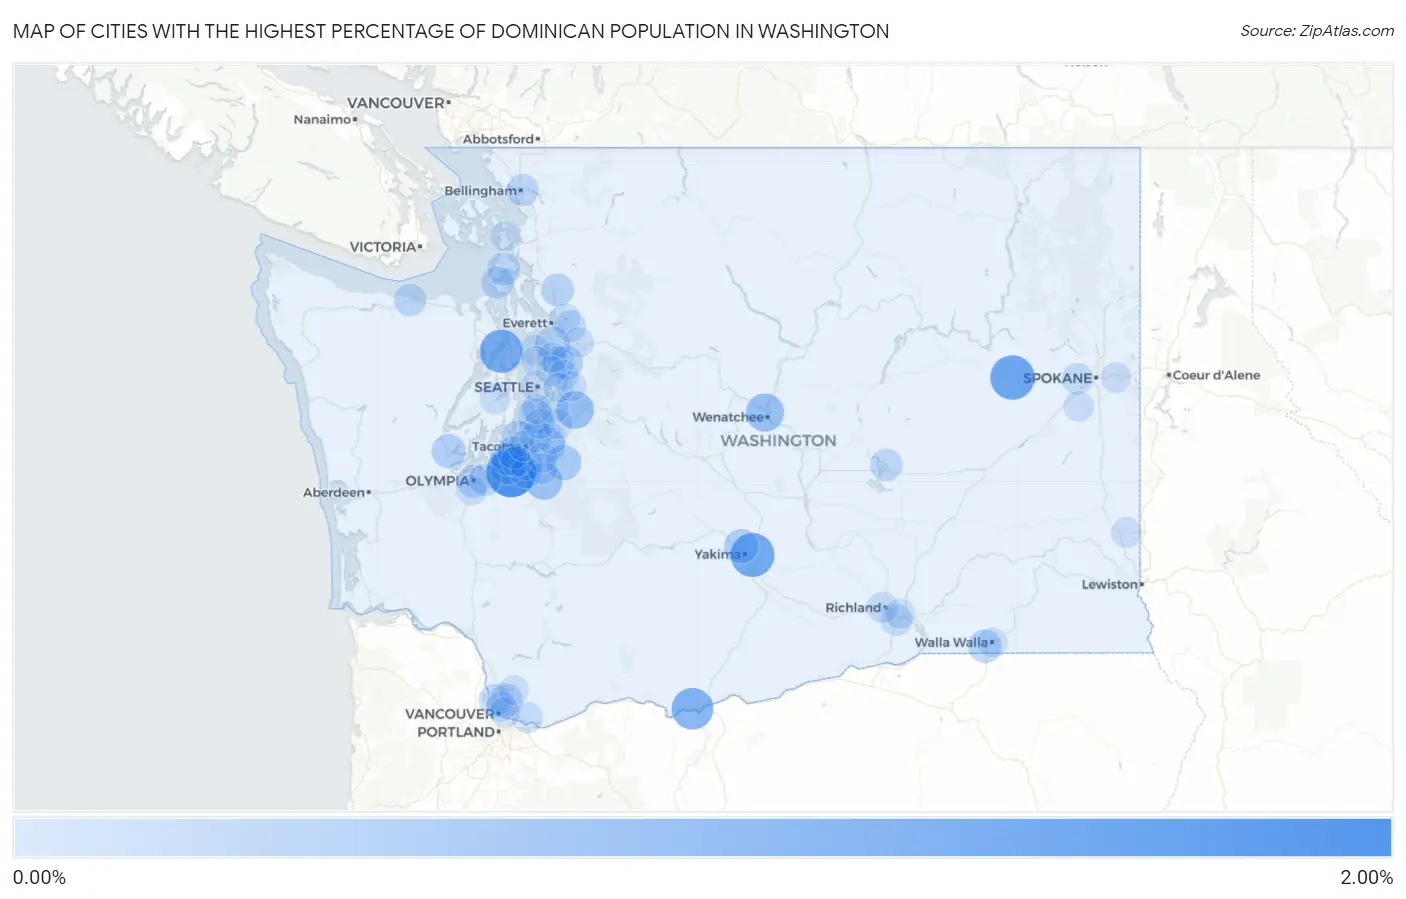
Map of Cities with the Highest Percentage of Dominican Population in Washington
0.00%
2.00%
Cities with the Highest Percentage of Dominican Population in Washington
| City | Dominican | vs State | vs National | |
| 1. | Fort Lewis | 1.70% | 0.056%(+1.65)#1 | 0.68%(+1.02)#842 |
| 2. | Davenport | 1.24% | 0.056%(+1.19)#2 | 0.68%(+0.559)#1,110 |
| 3. | Terrace Heights | 1.19% | 0.056%(+1.13)#3 | 0.68%(+0.501)#1,146 |
| 4. | Lofall | 1.13% | 0.056%(+1.07)#4 | 0.68%(+0.444)#1,185 |
| 5. | Wishram | 1.00% | 0.056%(+0.940)#5 | 0.68%(+0.311)#1,296 |
| 6. | Wenatchee | 0.68% | 0.056%(+0.623)#6 | 0.68%(-0.006)#1,647 |
| 7. | Mirrormont | 0.66% | 0.056%(+0.603)#7 | 0.68%(-0.027)#1,681 |
| 8. | Graham | 0.59% | 0.056%(+0.531)#8 | 0.68%(-0.098)#1,788 |
| 9. | Pacific | 0.44% | 0.056%(+0.381)#9 | 0.68%(-0.248)#2,080 |
| 10. | Prairie Heights | 0.43% | 0.056%(+0.378)#10 | 0.68%(-0.251)#2,091 |
| 11. | Normandy Park | 0.43% | 0.056%(+0.377)#11 | 0.68%(-0.252)#2,093 |
| 12. | Selah | 0.37% | 0.056%(+0.310)#12 | 0.68%(-0.319)#2,241 |
| 13. | Mill Creek | 0.37% | 0.056%(+0.310)#13 | 0.68%(-0.319)#2,242 |
| 14. | Shelton | 0.34% | 0.056%(+0.288)#14 | 0.68%(-0.341)#2,294 |
| 15. | North Fort Lewis | 0.33% | 0.056%(+0.277)#15 | 0.68%(-0.353)#2,325 |
| 16. | Ruston | 0.31% | 0.056%(+0.259)#16 | 0.68%(-0.370)#2,369 |
| 17. | Cottage Lake | 0.29% | 0.056%(+0.237)#17 | 0.68%(-0.392)#2,450 |
| 18. | College Place | 0.29% | 0.056%(+0.230)#18 | 0.68%(-0.399)#2,474 |
| 19. | Steilacoom | 0.28% | 0.056%(+0.229)#19 | 0.68%(-0.400)#2,478 |
| 20. | Olympia | 0.25% | 0.056%(+0.198)#20 | 0.68%(-0.431)#2,588 |
| 21. | Arlington | 0.25% | 0.056%(+0.191)#21 | 0.68%(-0.438)#2,605 |
| 22. | Barberton | 0.23% | 0.056%(+0.171)#22 | 0.68%(-0.458)#2,671 |
| 23. | Parkland | 0.22% | 0.056%(+0.165)#23 | 0.68%(-0.464)#2,694 |
| 24. | University Place | 0.22% | 0.056%(+0.161)#24 | 0.68%(-0.469)#2,716 |
| 25. | Oak Harbor | 0.21% | 0.056%(+0.153)#25 | 0.68%(-0.476)#2,739 |
| 26. | Moses Lake | 0.20% | 0.056%(+0.147)#26 | 0.68%(-0.482)#2,757 |
| 27. | Felida | 0.20% | 0.056%(+0.144)#27 | 0.68%(-0.485)#2,773 |
| 28. | Coupeville | 0.20% | 0.056%(+0.141)#28 | 0.68%(-0.489)#2,789 |
| 29. | Woodinville | 0.19% | 0.056%(+0.132)#29 | 0.68%(-0.497)#2,817 |
| 30. | Port Angeles | 0.18% | 0.056%(+0.129)#30 | 0.68%(-0.500)#2,829 |
| 31. | Bellingham | 0.17% | 0.056%(+0.112)#31 | 0.68%(-0.517)#2,901 |
| 32. | Lacey | 0.16% | 0.056%(+0.106)#32 | 0.68%(-0.523)#2,927 |
| 33. | Federal Way | 0.15% | 0.056%(+0.093)#33 | 0.68%(-0.536)#2,989 |
| 34. | Everett | 0.14% | 0.056%(+0.086)#34 | 0.68%(-0.543)#3,033 |
| 35. | Spanaway | 0.13% | 0.056%(+0.077)#35 | 0.68%(-0.552)#3,085 |
| 36. | Airway Heights | 0.12% | 0.056%(+0.067)#36 | 0.68%(-0.562)#3,133 |
| 37. | Kennewick | 0.12% | 0.056%(+0.066)#37 | 0.68%(-0.563)#3,138 |
| 38. | Richland | 0.10% | 0.056%(+0.046)#38 | 0.68%(-0.583)#3,259 |
| 39. | Camas | 0.083% | 0.056%(+0.028)#39 | 0.68%(-0.601)#3,402 |
| 40. | Renton | 0.073% | 0.056%(+0.018)#40 | 0.68%(-0.612)#3,479 |
| 41. | Bremerton | 0.070% | 0.056%(+0.015)#41 | 0.68%(-0.614)#3,498 |
| 42. | Lake Stevens | 0.062% | 0.056%(+0.006)#42 | 0.68%(-0.623)#3,576 |
| 43. | Redmond | 0.060% | 0.056%(+0.004)#43 | 0.68%(-0.625)#3,601 |
| 44. | Edmonds | 0.059% | 0.056%(+0.003)#44 | 0.68%(-0.626)#3,608 |
| 45. | Lakewood | 0.057% | 0.056%(+0.001)#45 | 0.68%(-0.628)#3,625 |
| 46. | Seattle | 0.056% | 0.056%(+0.001)#46 | 0.68%(-0.629)#3,630 |
| 47. | Tacoma | 0.054% | 0.056%(-0.001)#47 | 0.68%(-0.630)#3,650 |
| 48. | Monroe | 0.051% | 0.056%(-0.005)#48 | 0.68%(-0.634)#3,670 |
| 49. | Tumwater | 0.047% | 0.056%(-0.009)#49 | 0.68%(-0.638)#3,704 |
| 50. | Fairwood Cdp King County | 0.043% | 0.056%(-0.013)#50 | 0.68%(-0.642)#3,738 |
| 51. | Vancouver | 0.039% | 0.056%(-0.016)#51 | 0.68%(-0.645)#3,778 |
| 52. | Auburn | 0.039% | 0.056%(-0.017)#52 | 0.68%(-0.646)#3,782 |
| 53. | South Hill | 0.037% | 0.056%(-0.019)#53 | 0.68%(-0.648)#3,799 |
| 54. | Pullman | 0.034% | 0.056%(-0.021)#54 | 0.68%(-0.650)#3,829 |
| 55. | Spokane Valley | 0.033% | 0.056%(-0.023)#55 | 0.68%(-0.652)#3,850 |
| 56. | Kent | 0.031% | 0.056%(-0.024)#56 | 0.68%(-0.654)#3,862 |
| 57. | Hazel Dell | 0.031% | 0.056%(-0.025)#57 | 0.68%(-0.654)#3,864 |
| 58. | Des Moines | 0.031% | 0.056%(-0.025)#58 | 0.68%(-0.654)#3,870 |
| 59. | Cheney | 0.023% | 0.056%(-0.032)#59 | 0.68%(-0.661)#3,947 |
| 60. | Bothell | 0.023% | 0.056%(-0.033)#60 | 0.68%(-0.662)#3,952 |
| 61. | Sammamish | 0.023% | 0.056%(-0.033)#61 | 0.68%(-0.662)#3,961 |
| 62. | Shoreline | 0.020% | 0.056%(-0.035)#62 | 0.68%(-0.664)#3,977 |
| 63. | Burien | 0.017% | 0.056%(-0.038)#63 | 0.68%(-0.667)#4,010 |
| 64. | Puyallup | 0.016% | 0.056%(-0.039)#64 | 0.68%(-0.668)#4,020 |
| 65. | Walla Walla | 0.015% | 0.056%(-0.041)#65 | 0.68%(-0.670)#4,037 |
| 66. | Kirkland | 0.014% | 0.056%(-0.041)#66 | 0.68%(-0.671)#4,045 |
| 67. | Battle Ground | 0.0096% | 0.056%(-0.046)#67 | 0.68%(-0.675)#4,087 |
| 68. | Bellevue | 0.0073% | 0.056%(-0.048)#68 | 0.68%(-0.677)#4,109 |
| 69. | Pasco | 0.0065% | 0.056%(-0.049)#69 | 0.68%(-0.678)#4,116 |
| 70. | Anacortes | 0.0057% | 0.056%(-0.050)#70 | 0.68%(-0.679)#4,126 |
Common Questions
What are the Top 10 Cities with the Highest Percentage of Dominican Population in Washington?
Top 10 Cities with the Highest Percentage of Dominican Population in Washington are:
#1
1.70%
#2
1.24%
#3
1.19%
#4
1.13%
#5
1.00%
#6
0.68%
#7
0.66%
#8
0.59%
#9
0.44%
#10
0.43%
What city has the Highest Percentage of Dominican Population in Washington?
Fort Lewis has the Highest Percentage of Dominican Population in Washington with 1.70%.
What is the Percentage of Dominican Population in the State of Washington?
Percentage of Dominican Population in Washington is 0.056%.
What is the Percentage of Dominican Population in the United States?
Percentage of Dominican Population in the United States is 0.68%.