Cities with the Most Immigrants from Somalia in Washington
RELATED REPORTS & OPTIONS
Somalia
Washington
Compare Cities
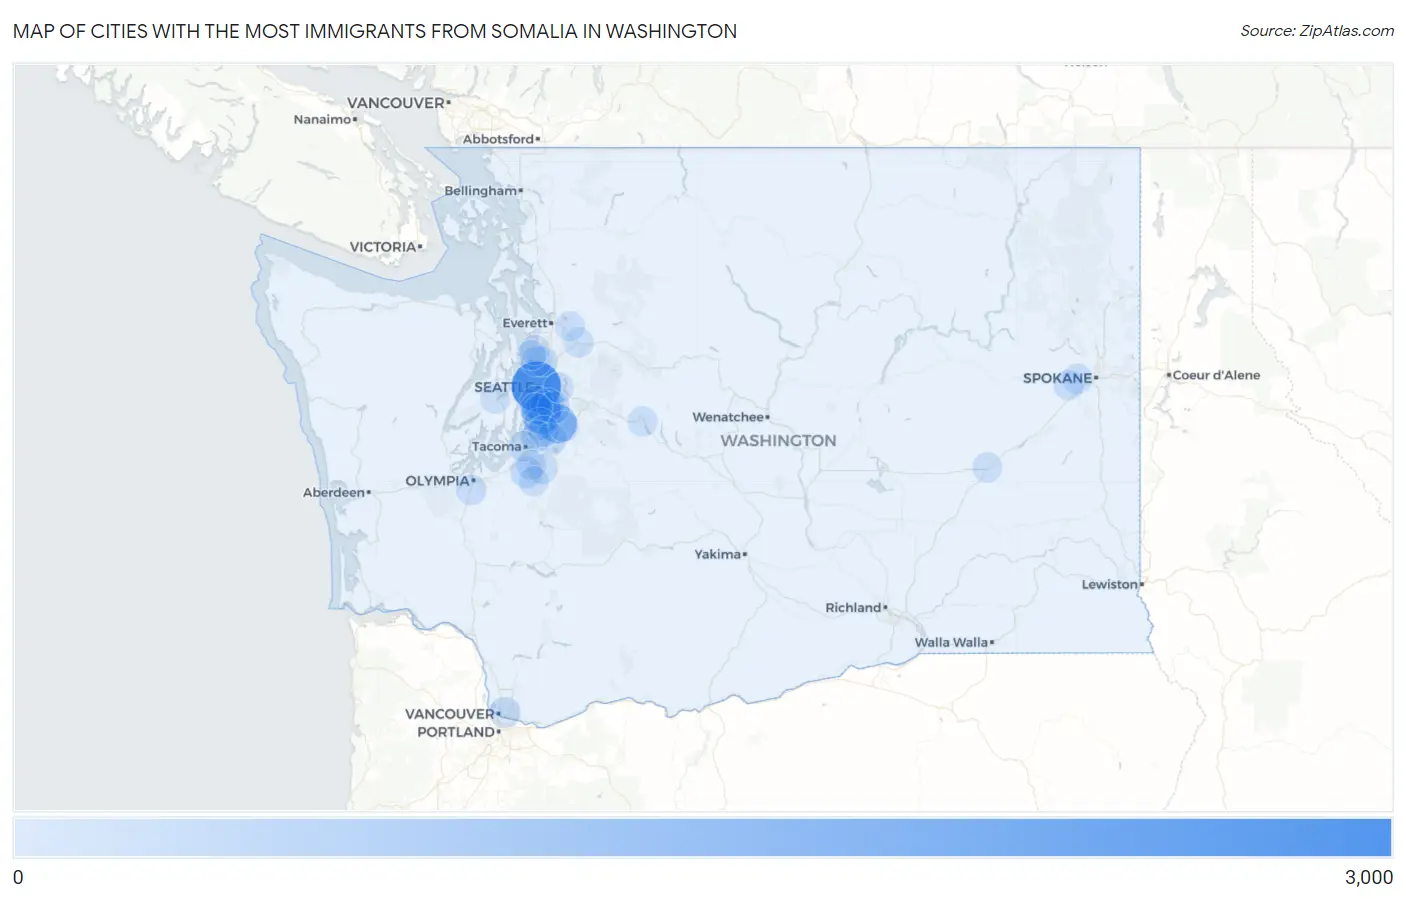
Map of Cities with the Most Immigrants from Somalia in Washington
0
3,000
Cities with the Most Immigrants from Somalia in Washington
| City | Somalia | vs State | vs National | |
| 1. | Seattle | 2,628 | 8,540(30.77%)#1 | 98,399(2.67%)#4 |
| 2. | Seatac | 1,208 | 8,540(14.15%)#2 | 98,399(1.23%)#12 |
| 3. | Kent | 1,138 | 8,540(13.33%)#3 | 98,399(1.16%)#14 |
| 4. | Tukwila | 694 | 8,540(8.13%)#4 | 98,399(0.71%)#26 |
| 5. | Bryn Mawr Skyway | 440 | 8,540(5.15%)#5 | 98,399(0.45%)#45 |
| 6. | White Center | 376 | 8,540(4.40%)#6 | 98,399(0.38%)#51 |
| 7. | Renton | 284 | 8,540(3.33%)#7 | 98,399(0.29%)#67 |
| 8. | Des Moines | 252 | 8,540(2.95%)#8 | 98,399(0.26%)#74 |
| 9. | Burien | 203 | 8,540(2.38%)#9 | 98,399(0.21%)#88 |
| 10. | Auburn | 165 | 8,540(1.93%)#10 | 98,399(0.17%)#98 |
| 11. | Spanaway | 157 | 8,540(1.84%)#11 | 98,399(0.16%)#102 |
| 12. | Federal Way | 146 | 8,540(1.71%)#12 | 98,399(0.15%)#107 |
| 13. | Fairwood Cdp King County | 133 | 8,540(1.56%)#13 | 98,399(0.14%)#116 |
| 14. | Vancouver | 123 | 8,540(1.44%)#14 | 98,399(0.13%)#122 |
| 15. | Lakeland North | 111 | 8,540(1.30%)#15 | 98,399(0.11%)#132 |
| 16. | Tacoma | 69 | 8,540(0.81%)#16 | 98,399(0.07%)#164 |
| 17. | Covington | 55 | 8,540(0.64%)#17 | 98,399(0.06%)#188 |
| 18. | Airway Heights | 53 | 8,540(0.62%)#18 | 98,399(0.05%)#192 |
| 19. | Lake Forest Park | 51 | 8,540(0.60%)#19 | 98,399(0.05%)#197 |
| 20. | Shoreline | 40 | 8,540(0.47%)#20 | 98,399(0.04%)#221 |
| 21. | Tumwater | 37 | 8,540(0.43%)#21 | 98,399(0.04%)#236 |
| 22. | Fairchild Afb | 34 | 8,540(0.40%)#22 | 98,399(0.03%)#254 |
| 23. | South Hill | 31 | 8,540(0.36%)#23 | 98,399(0.03%)#258 |
| 24. | Bellevue | 21 | 8,540(0.25%)#24 | 98,399(0.02%)#293 |
| 25. | Clover Creek | 16 | 8,540(0.19%)#25 | 98,399(0.02%)#320 |
| 26. | Monroe | 12 | 8,540(0.14%)#26 | 98,399(0.01%)#338 |
| 27. | Elk Plain | 11 | 8,540(0.13%)#27 | 98,399(0.01%)#347 |
| 28. | Edmonds | 9 | 8,540(0.11%)#28 | 98,399(0.01%)#358 |
| 29. | Ritzville | 5 | 8,540(0.06%)#29 | 98,399(0.01%)#398 |
| 30. | Snoqualmie Pass | 3 | 8,540(0.04%)#30 | 98,399(0.00%)#416 |
| 31. | Everett | 2 | 8,540(0.02%)#31 | 98,399(0.00%)#417 |
| 32. | Bremerton | 2 | 8,540(0.02%)#32 | 98,399(0.00%)#420 |
| 33. | Woodway | 1 | 8,540(0.01%)#33 | 98,399(0.00%)#431 |
Common Questions
What are the Top 10 Cities with the Most Immigrants from Somalia in Washington?
Top 10 Cities with the Most Immigrants from Somalia in Washington are:
#1
2,628
#2
1,208
#3
1,138
#4
694
#5
440
#6
376
#7
284
#8
252
#9
203
#10
165
What city has the Most Immigrants from Somalia in Washington?
Seattle has the Most Immigrants from Somalia in Washington with 2,628.
What is the Total Immigrants from Somalia in the State of Washington?
Total Immigrants from Somalia in Washington is 8,540.
What is the Total Immigrants from Somalia in the United States?
Total Immigrants from Somalia in the United States is 98,399.