Cities with the Highest Percentage of Population Employed in Arts, Entertainment & Recreation in Washington
RELATED REPORTS & OPTIONS
Arts, Entertainment & Recreation
Washington
Compare Cities
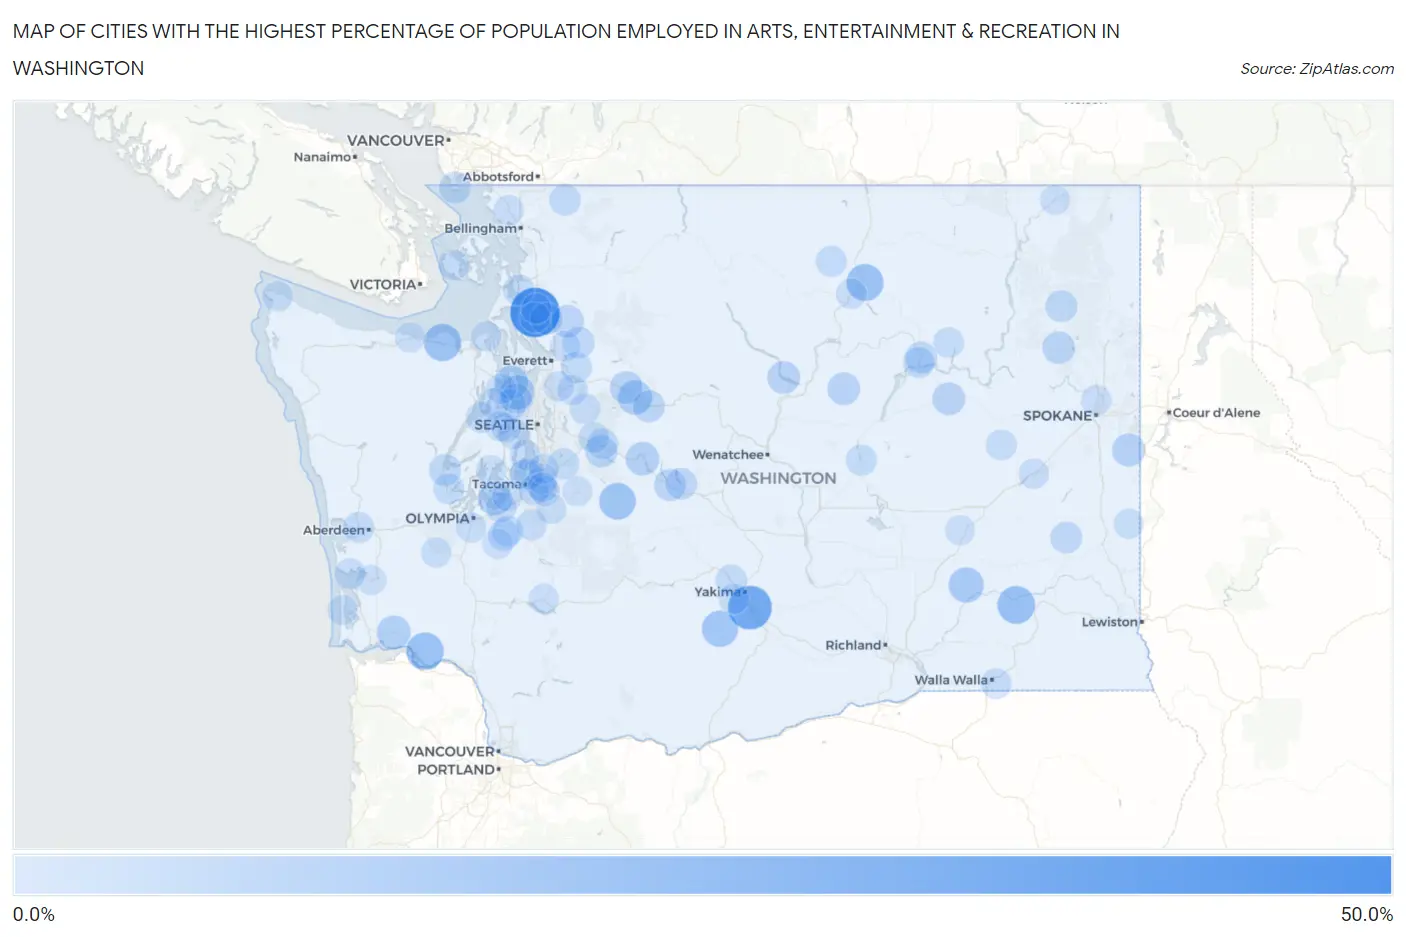
Map of Cities with the Highest Percentage of Population Employed in Arts, Entertainment & Recreation in Washington
0.0%
50.0%
Cities with the Highest Percentage of Population Employed in Arts, Entertainment & Recreation in Washington
| City | % Employed | vs State | vs National | |
| 1. | Northwest Stanwood | 50.0% | 2.1%(+47.9)#1 | 2.1%(+47.9)#38 |
| 2. | Parker | 35.5% | 2.1%(+33.3)#2 | 2.1%(+33.4)#93 |
| 3. | Starbuck | 21.1% | 2.1%(+18.9)#3 | 2.1%(+19.0)#241 |
| 4. | Upper Elochoman | 20.6% | 2.1%(+18.5)#4 | 2.1%(+18.6)#259 |
| 5. | Carlsborg | 20.2% | 2.1%(+18.1)#5 | 2.1%(+18.1)#265 |
| 6. | North Omak | 19.6% | 2.1%(+17.4)#6 | 2.1%(+17.5)#280 |
| 7. | Greenwater | 18.6% | 2.1%(+16.4)#7 | 2.1%(+16.5)#305 |
| 8. | White Swan | 17.8% | 2.1%(+15.6)#8 | 2.1%(+15.7)#337 |
| 9. | Crescent Bar | 15.9% | 2.1%(+13.7)#9 | 2.1%(+13.8)#417 |
| 10. | Kahlotus | 15.3% | 2.1%(+13.1)#10 | 2.1%(+13.2)#450 |
| 11. | Baring | 13.6% | 2.1%(+11.5)#11 | 2.1%(+11.6)#550 |
| 12. | Kingston | 13.6% | 2.1%(+11.5)#12 | 2.1%(+11.5)#554 |
| 13. | Port Gamble Tribal Community | 12.4% | 2.1%(+10.2)#13 | 2.1%(+10.3)#640 |
| 14. | Grays River | 12.0% | 2.1%(+9.85)#14 | 2.1%(+9.92)#672 |
| 15. | Snoqualmie Pass | 11.8% | 2.1%(+9.62)#15 | 2.1%(+9.68)#690 |
| 16. | Anderson Island | 11.1% | 2.1%(+8.98)#16 | 2.1%(+9.05)#751 |
| 17. | Rockford | 10.8% | 2.1%(+8.68)#17 | 2.1%(+8.74)#784 |
| 18. | Wilbur | 10.0% | 2.1%(+7.82)#18 | 2.1%(+7.88)#920 |
| 19. | Manson | 9.7% | 2.1%(+7.53)#19 | 2.1%(+7.59)#966 |
| 20. | Index | 9.6% | 2.1%(+7.47)#20 | 2.1%(+7.53)#982 |
| 21. | Mansfield | 9.5% | 2.1%(+7.33)#21 | 2.1%(+7.39)#1,003 |
| 22. | Arlington Heights | 9.1% | 2.1%(+6.96)#22 | 2.1%(+7.02)#1,049 |
| 23. | Springdale | 8.9% | 2.1%(+6.72)#23 | 2.1%(+6.79)#1,091 |
| 24. | Wilderness Rim | 8.4% | 2.1%(+6.24)#24 | 2.1%(+6.31)#1,201 |
| 25. | Skykomish | 8.3% | 2.1%(+6.19)#25 | 2.1%(+6.25)#1,219 |
| 26. | Easton | 8.1% | 2.1%(+5.96)#26 | 2.1%(+6.03)#1,267 |
| 27. | Sunday Lake | 7.9% | 2.1%(+5.79)#27 | 2.1%(+5.85)#1,310 |
| 28. | Elmer City | 7.8% | 2.1%(+5.63)#28 | 2.1%(+5.70)#1,356 |
| 29. | Chewelah | 7.6% | 2.1%(+5.47)#29 | 2.1%(+5.53)#1,417 |
| 30. | Skokomish | 7.6% | 2.1%(+5.44)#30 | 2.1%(+5.51)#1,426 |
| 31. | Point Roberts | 7.6% | 2.1%(+5.44)#31 | 2.1%(+5.50)#1,428 |
| 32. | Granite Falls | 7.4% | 2.1%(+5.26)#32 | 2.1%(+5.32)#1,490 |
| 33. | Endicott | 7.3% | 2.1%(+5.11)#33 | 2.1%(+5.18)#1,522 |
| 34. | Roslyn | 7.2% | 2.1%(+5.05)#34 | 2.1%(+5.11)#1,538 |
| 35. | Suquamish | 7.0% | 2.1%(+4.84)#35 | 2.1%(+4.90)#1,599 |
| 36. | Maple Falls | 7.0% | 2.1%(+4.83)#36 | 2.1%(+4.89)#1,605 |
| 37. | Yelm | 6.8% | 2.1%(+4.65)#37 | 2.1%(+4.71)#1,654 |
| 38. | Browns Point | 6.6% | 2.1%(+4.40)#38 | 2.1%(+4.47)#1,747 |
| 39. | Coulee Dam | 6.4% | 2.1%(+4.25)#39 | 2.1%(+4.31)#1,815 |
| 40. | Eschbach | 6.2% | 2.1%(+4.01)#40 | 2.1%(+4.07)#1,918 |
| 41. | Conconully | 6.0% | 2.1%(+3.82)#41 | 2.1%(+3.89)#1,991 |
| 42. | North Yelm | 6.0% | 2.1%(+3.81)#42 | 2.1%(+3.88)#1,998 |
| 43. | North Bend | 5.9% | 2.1%(+3.75)#43 | 2.1%(+3.82)#2,027 |
| 44. | Three Lakes | 5.9% | 2.1%(+3.71)#44 | 2.1%(+3.77)#2,057 |
| 45. | Covington | 5.9% | 2.1%(+3.70)#45 | 2.1%(+3.77)#2,061 |
| 46. | Hoquiam | 5.8% | 2.1%(+3.61)#46 | 2.1%(+3.68)#2,118 |
| 47. | La Conner | 5.8% | 2.1%(+3.61)#47 | 2.1%(+3.67)#2,121 |
| 48. | Soap Lake | 5.7% | 2.1%(+3.57)#48 | 2.1%(+3.63)#2,133 |
| 49. | Shelton | 5.6% | 2.1%(+3.47)#49 | 2.1%(+3.54)#2,194 |
| 50. | Seabeck | 5.6% | 2.1%(+3.42)#50 | 2.1%(+3.49)#2,222 |
| 51. | Milton | 5.4% | 2.1%(+3.30)#51 | 2.1%(+3.36)#2,296 |
| 52. | South Creek | 5.3% | 2.1%(+3.20)#52 | 2.1%(+3.26)#2,357 |
| 53. | Friday Harbor | 5.3% | 2.1%(+3.16)#53 | 2.1%(+3.22)#2,380 |
| 54. | Harrington | 5.3% | 2.1%(+3.12)#54 | 2.1%(+3.18)#2,403 |
| 55. | Tokeland | 5.3% | 2.1%(+3.12)#55 | 2.1%(+3.18)#2,410 |
| 56. | Dash Point | 5.2% | 2.1%(+3.05)#56 | 2.1%(+3.12)#2,454 |
| 57. | Manchester | 5.1% | 2.1%(+2.94)#57 | 2.1%(+3.00)#2,541 |
| 58. | Lake Marcel Stillwater | 5.0% | 2.1%(+2.90)#58 | 2.1%(+2.96)#2,561 |
| 59. | Walla Walla East | 5.0% | 2.1%(+2.86)#59 | 2.1%(+2.93)#2,591 |
| 60. | Keller | 5.0% | 2.1%(+2.85)#60 | 2.1%(+2.92)#2,601 |
| 61. | Snoqualmie | 4.9% | 2.1%(+2.75)#61 | 2.1%(+2.81)#2,681 |
| 62. | Ahtanum | 4.9% | 2.1%(+2.73)#62 | 2.1%(+2.79)#2,706 |
| 63. | Indianola | 4.8% | 2.1%(+2.61)#63 | 2.1%(+2.67)#2,796 |
| 64. | Bangor Base | 4.6% | 2.1%(+2.50)#64 | 2.1%(+2.56)#2,877 |
| 65. | Okanogan | 4.6% | 2.1%(+2.42)#65 | 2.1%(+2.48)#2,951 |
| 66. | Neah Bay | 4.5% | 2.1%(+2.40)#66 | 2.1%(+2.46)#2,972 |
| 67. | Lake Cassidy | 4.5% | 2.1%(+2.40)#67 | 2.1%(+2.46)#2,986 |
| 68. | Vashon | 4.5% | 2.1%(+2.38)#68 | 2.1%(+2.45)#3,000 |
| 69. | Lofall | 4.5% | 2.1%(+2.37)#69 | 2.1%(+2.43)#3,024 |
| 70. | Lakeland South | 4.5% | 2.1%(+2.31)#70 | 2.1%(+2.38)#3,083 |
| 71. | Country Homes | 4.4% | 2.1%(+2.28)#71 | 2.1%(+2.34)#3,124 |
| 72. | Dupont | 4.4% | 2.1%(+2.23)#72 | 2.1%(+2.29)#3,179 |
| 73. | Steilacoom | 4.4% | 2.1%(+2.21)#73 | 2.1%(+2.28)#3,193 |
| 74. | Sprague | 4.3% | 2.1%(+2.20)#74 | 2.1%(+2.27)#3,207 |
| 75. | High Bridge | 4.3% | 2.1%(+2.19)#75 | 2.1%(+2.25)#3,227 |
| 76. | Stanwood | 4.3% | 2.1%(+2.13)#76 | 2.1%(+2.19)#3,302 |
| 77. | Oakville | 4.2% | 2.1%(+2.08)#77 | 2.1%(+2.15)#3,348 |
| 78. | Ferndale | 4.2% | 2.1%(+2.07)#78 | 2.1%(+2.14)#3,356 |
| 79. | Tumwater | 4.2% | 2.1%(+2.02)#79 | 2.1%(+2.08)#3,410 |
| 80. | Orting | 4.1% | 2.1%(+2.00)#80 | 2.1%(+2.06)#3,453 |
| 81. | Waller | 4.1% | 2.1%(+1.99)#81 | 2.1%(+2.06)#3,459 |
| 82. | Clearview | 4.1% | 2.1%(+1.99)#82 | 2.1%(+2.05)#3,461 |
| 83. | North Puyallup | 4.1% | 2.1%(+1.98)#83 | 2.1%(+2.04)#3,484 |
| 84. | Lake Ketchum | 4.1% | 2.1%(+1.96)#84 | 2.1%(+2.03)#3,513 |
| 85. | Garfield | 4.1% | 2.1%(+1.92)#85 | 2.1%(+1.98)#3,558 |
| 86. | Port Angeles | 4.0% | 2.1%(+1.88)#86 | 2.1%(+1.94)#3,602 |
| 87. | Morton | 4.0% | 2.1%(+1.84)#87 | 2.1%(+1.91)#3,649 |
| 88. | Ocean Park | 4.0% | 2.1%(+1.84)#88 | 2.1%(+1.90)#3,654 |
| 89. | Rainier | 3.9% | 2.1%(+1.74)#89 | 2.1%(+1.81)#3,773 |
| 90. | Fairwood Cdp Spokane County | 3.9% | 2.1%(+1.71)#90 | 2.1%(+1.77)#3,810 |
| 91. | Lakeland North | 3.8% | 2.1%(+1.69)#91 | 2.1%(+1.75)#3,853 |
| 92. | Enumclaw | 3.8% | 2.1%(+1.68)#92 | 2.1%(+1.75)#3,856 |
| 93. | Rocky Point | 3.8% | 2.1%(+1.61)#93 | 2.1%(+1.68)#3,961 |
| 94. | Lind | 3.7% | 2.1%(+1.58)#94 | 2.1%(+1.65)#4,011 |
| 95. | Key Center | 3.7% | 2.1%(+1.58)#95 | 2.1%(+1.64)#4,019 |
| 96. | Edgewood | 3.7% | 2.1%(+1.56)#96 | 2.1%(+1.63)#4,037 |
| 97. | Northport | 3.7% | 2.1%(+1.56)#97 | 2.1%(+1.62)#4,060 |
| 98. | South Bend | 3.7% | 2.1%(+1.52)#98 | 2.1%(+1.59)#4,118 |
| 99. | Enetai | 3.7% | 2.1%(+1.52)#99 | 2.1%(+1.59)#4,121 |
| 100. | Port Townsend | 3.7% | 2.1%(+1.51)#100 | 2.1%(+1.58)#4,131 |
Common Questions
What are the Top 10 Cities with the Highest Percentage of Population Employed in Arts, Entertainment & Recreation in Washington?
Top 10 Cities with the Highest Percentage of Population Employed in Arts, Entertainment & Recreation in Washington are:
#1
50.0%
#2
35.5%
#3
21.1%
#4
20.6%
#5
20.2%
#6
19.6%
#7
18.6%
#8
17.8%
#9
15.3%
#10
13.6%
What city has the Highest Percentage of Population Employed in Arts, Entertainment & Recreation in Washington?
Northwest Stanwood has the Highest Percentage of Population Employed in Arts, Entertainment & Recreation in Washington with 50.0%.
What is the Percentage of Population Employed in Arts, Entertainment & Recreation in the State of Washington?
Percentage of Population Employed in Arts, Entertainment & Recreation in Washington is 2.1%.
What is the Percentage of Population Employed in Arts, Entertainment & Recreation in the United States?
Percentage of Population Employed in Arts, Entertainment & Recreation in the United States is 2.1%.