Quilcene, WA Map & Demographics
Quilcene Map
Quilcene Overview
$25,680
PER CAPITA INCOME
$66,429
AVG FAMILY INCOME
$55,577
AVG HOUSEHOLD INCOME
0.32
INEQUALITY / GINI INDEX
610
TOTAL POPULATION
343
MALE POPULATION
267
FEMALE POPULATION
128.46
MALES / 100 FEMALES
77.84
FEMALES / 100 MALES
38.9
MEDIAN AGE
2.8
AVG FAMILY SIZE
2.4
AVG HOUSEHOLD SIZE
342
LABOR FORCE [ PEOPLE ]
62.9%
PERCENT IN LABOR FORCE
7.3%
UNEMPLOYMENT RATE
Quilcene Zip Codes
Quilcene Area Codes
Income in Quilcene
Income Overview in Quilcene
Per Capita Income in Quilcene is $25,680, while median incomes of families and households are $66,429 and $55,577 respectively.
| Characteristic | Number | Measure |
| Per Capita Income | 610 | $25,680 |
| Median Family Income | 120 | $66,429 |
| Mean Family Income | 120 | $69,143 |
| Median Household Income | 256 | $55,577 |
| Mean Household Income | 256 | $53,802 |
| Income Deficit | 120 | $0 |
| Wage / Income Gap (%) | 610 | 0.00% |
| Wage / Income Gap ($) | 610 | 100.00¢ per $1 |
| Gini / Inequality Index | 610 | 0.32 |
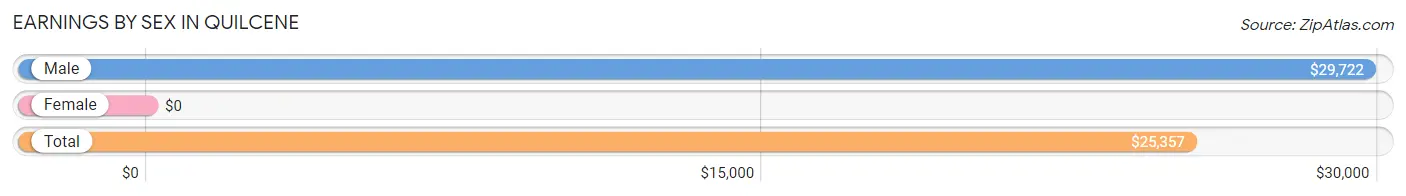
Earnings by Sex in Quilcene
| Sex | Number | Average Earnings |
| Male | 206 (60.2%) | $29,722 |
| Female | 136 (39.8%) | $0 |
| Total | 342 (100.0%) | $25,357 |
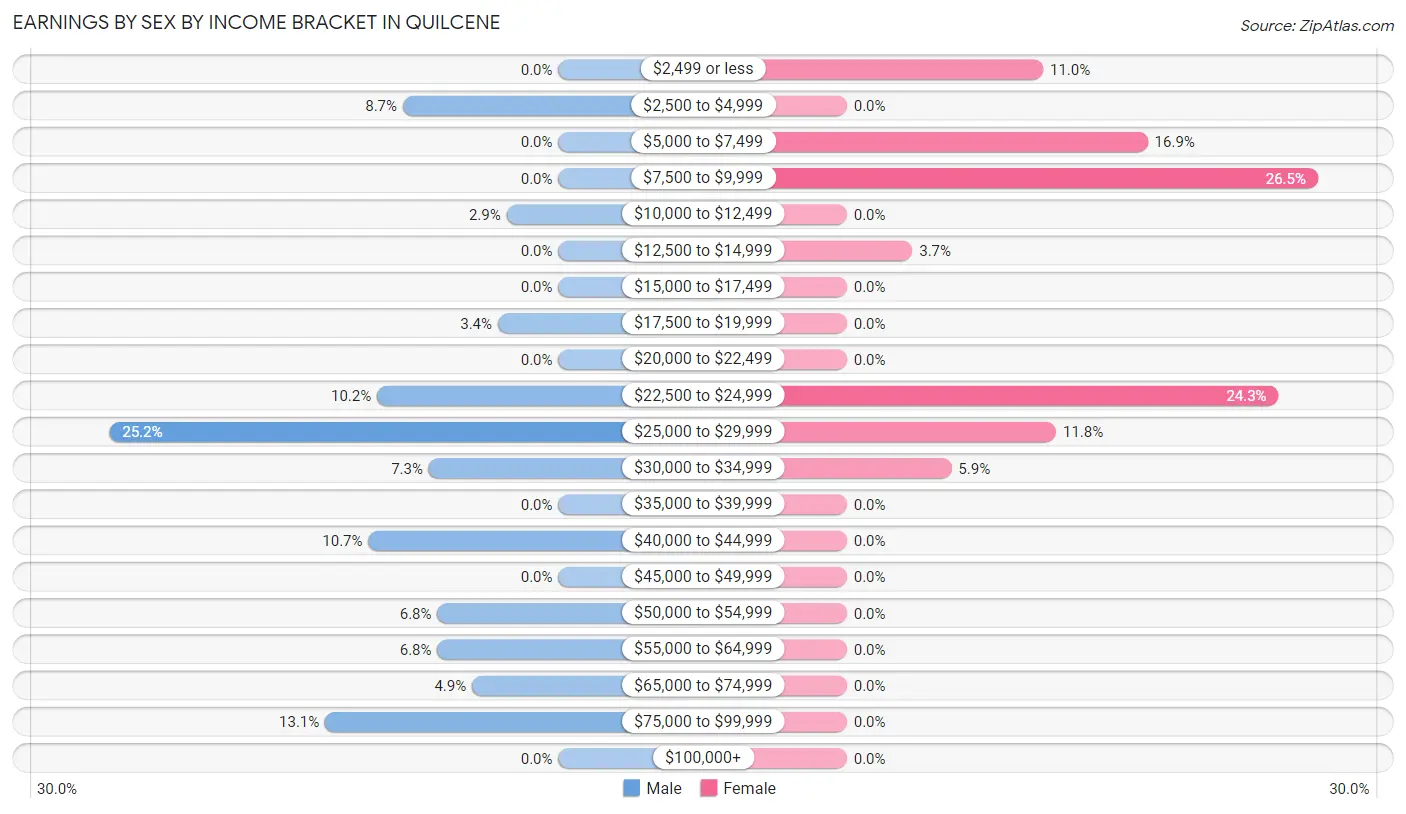
Earnings by Sex by Income Bracket in Quilcene
The most common earnings brackets in Quilcene are $25,000 to $29,999 for men (52 | 25.2%) and $7,500 to $9,999 for women (36 | 26.5%).
| Income | Male | Female |
| $2,499 or less | 0 (0.0%) | 15 (11.0%) |
| $2,500 to $4,999 | 18 (8.7%) | 0 (0.0%) |
| $5,000 to $7,499 | 0 (0.0%) | 23 (16.9%) |
| $7,500 to $9,999 | 0 (0.0%) | 36 (26.5%) |
| $10,000 to $12,499 | 6 (2.9%) | 0 (0.0%) |
| $12,500 to $14,999 | 0 (0.0%) | 5 (3.7%) |
| $15,000 to $17,499 | 0 (0.0%) | 0 (0.0%) |
| $17,500 to $19,999 | 7 (3.4%) | 0 (0.0%) |
| $20,000 to $22,499 | 0 (0.0%) | 0 (0.0%) |
| $22,500 to $24,999 | 21 (10.2%) | 33 (24.3%) |
| $25,000 to $29,999 | 52 (25.2%) | 16 (11.8%) |
| $30,000 to $34,999 | 15 (7.3%) | 8 (5.9%) |
| $35,000 to $39,999 | 0 (0.0%) | 0 (0.0%) |
| $40,000 to $44,999 | 22 (10.7%) | 0 (0.0%) |
| $45,000 to $49,999 | 0 (0.0%) | 0 (0.0%) |
| $50,000 to $54,999 | 14 (6.8%) | 0 (0.0%) |
| $55,000 to $64,999 | 14 (6.8%) | 0 (0.0%) |
| $65,000 to $74,999 | 10 (4.9%) | 0 (0.0%) |
| $75,000 to $99,999 | 27 (13.1%) | 0 (0.0%) |
| $100,000+ | 0 (0.0%) | 0 (0.0%) |
| Total | 206 (100.0%) | 136 (100.0%) |
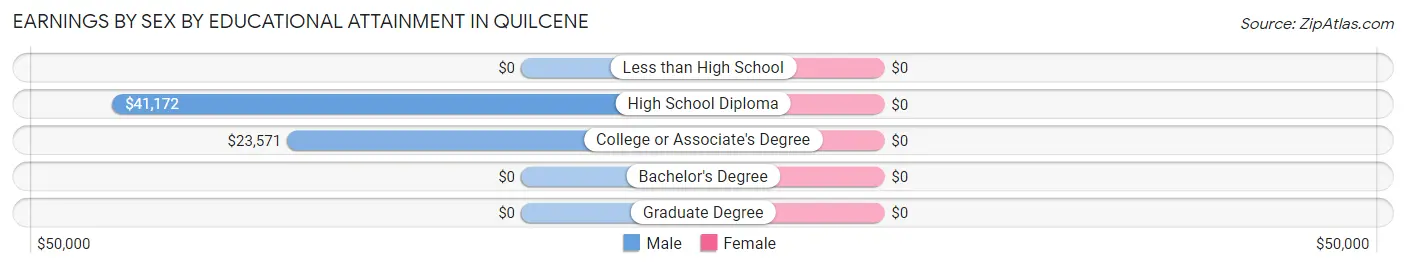
Earnings by Sex by Educational Attainment in Quilcene
| Educational Attainment | Male Income | Female Income |
| Less than High School | - | - |
| High School Diploma | $41,172 | $0 |
| College or Associate's Degree | $23,571 | $0 |
| Bachelor's Degree | - | - |
| Graduate Degree | - | - |
| Total | $27,471 | $22,992 |
Family Income in Quilcene
Family Income Brackets in Quilcene
According to the Quilcene family income data, there are 44 families falling into the $75,000 to $99,999 income range, which is the most common income bracket and makes up 36.7% of all families.
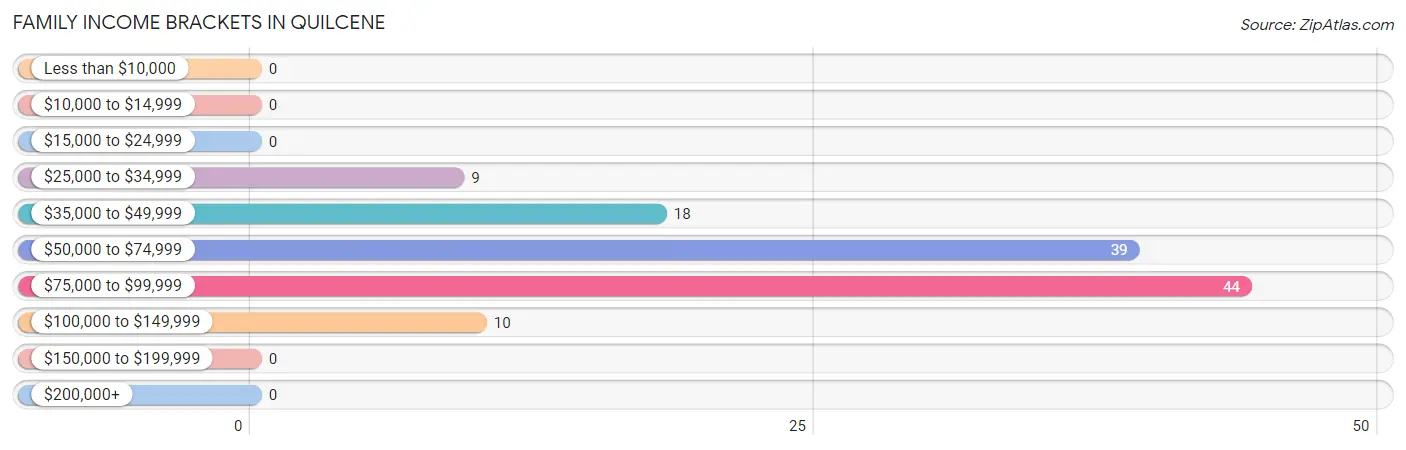
| Income Bracket | # Families | % Families |
| Less than $10,000 | 0 | 0.0% |
| $10,000 to $14,999 | 0 | 0.0% |
| $15,000 to $24,999 | 0 | 0.0% |
| $25,000 to $34,999 | 9 | 7.5% |
| $35,000 to $49,999 | 18 | 15.0% |
| $50,000 to $74,999 | 39 | 32.5% |
| $75,000 to $99,999 | 44 | 36.7% |
| $100,000 to $149,999 | 10 | 8.3% |
| $150,000 to $199,999 | 0 | 0.0% |
| $200,000+ | 0 | 0.0% |
Family Income by Famaliy Size in Quilcene
2-person families (95 | 79.2%) account for the highest median family income in Quilcene with $57,050 per family, while 2-person families (95 | 79.2%) have the highest median income of $28,525 per family member.
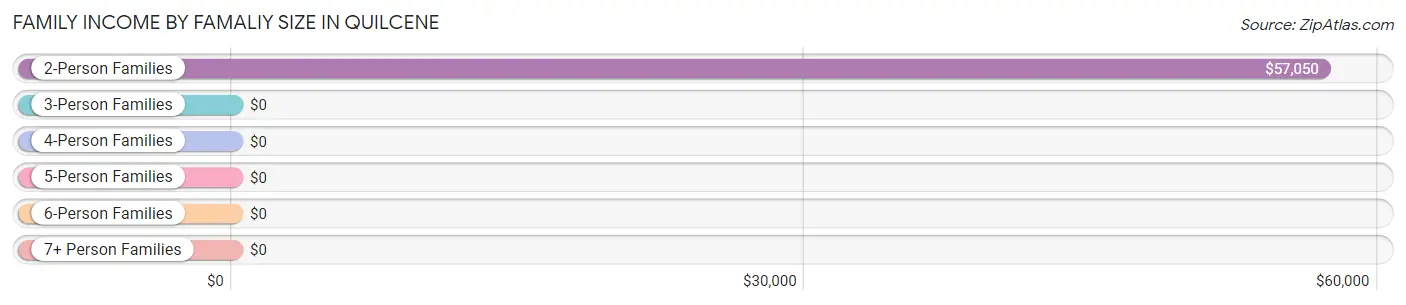
| Income Bracket | # Families | Median Income |
| 2-Person Families | 95 (79.2%) | $57,050 |
| 3-Person Families | 0 (0.0%) | $0 |
| 4-Person Families | 9 (7.5%) | $0 |
| 5-Person Families | 13 (10.8%) | $0 |
| 6-Person Families | 3 (2.5%) | $0 |
| 7+ Person Families | 0 (0.0%) | $0 |
| Total | 120 (100.0%) | $66,429 |
Family Income by Number of Earners in Quilcene
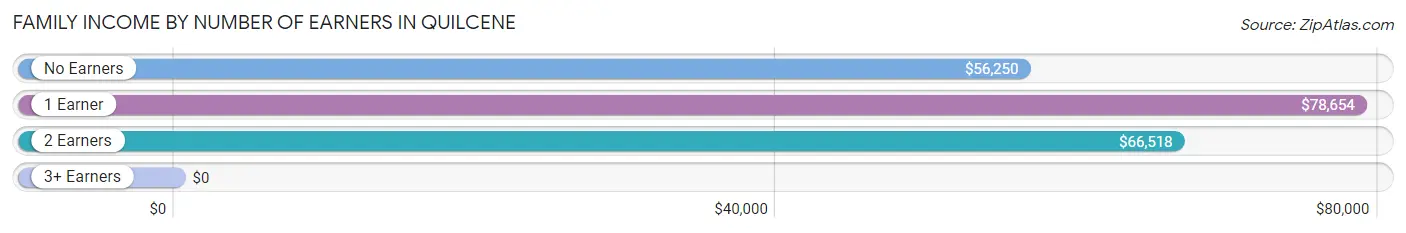
| Number of Earners | # Families | Median Income |
| No Earners | 35 (29.2%) | $56,250 |
| 1 Earner | 48 (40.0%) | $78,654 |
| 2 Earners | 25 (20.8%) | $66,518 |
| 3+ Earners | 12 (10.0%) | $0 |
| Total | 120 (100.0%) | $66,429 |
Household Income in Quilcene
Household Income Brackets in Quilcene
With 74 households falling in the category, the $75,000 to $99,999 income range is the most frequent in Quilcene, accounting for 28.9% of all households.
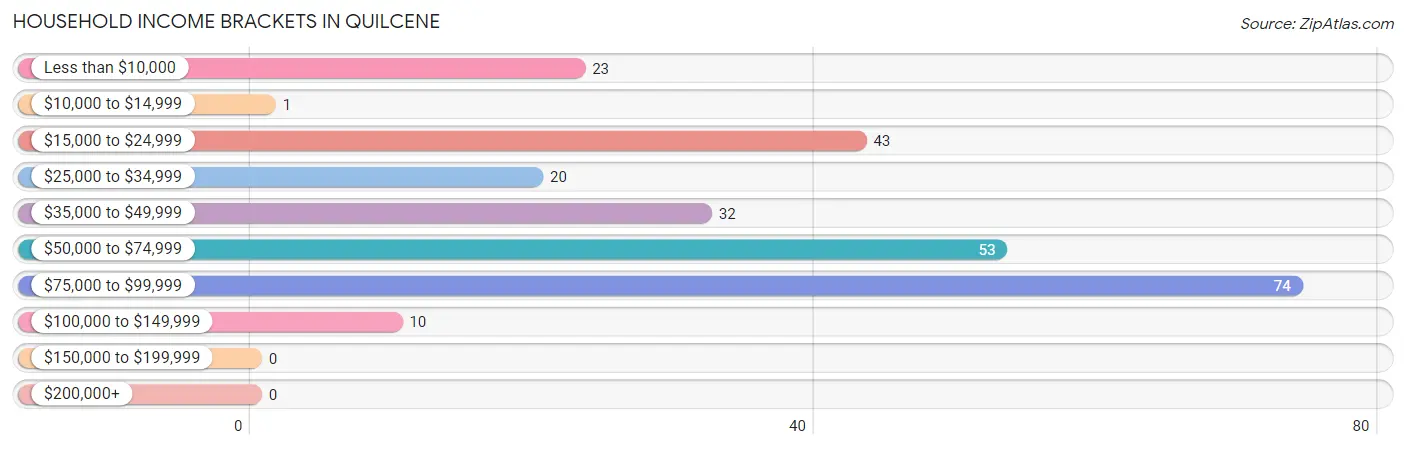
| Income Bracket | # Households | % Households |
| Less than $10,000 | 23 | 9.0% |
| $10,000 to $14,999 | 1 | 0.4% |
| $15,000 to $24,999 | 43 | 16.8% |
| $25,000 to $34,999 | 20 | 7.8% |
| $35,000 to $49,999 | 32 | 12.5% |
| $50,000 to $74,999 | 53 | 20.7% |
| $75,000 to $99,999 | 74 | 28.9% |
| $100,000 to $149,999 | 10 | 3.9% |
| $150,000 to $199,999 | 0 | 0.0% |
| $200,000+ | 0 | 0.0% |
Household Income by Householder Age in Quilcene
The median household income in Quilcene is $55,577, with the highest median household income of $90,042 found in the 25 to 44 years age bracket for the primary householder. A total of 73 households (28.5%) fall into this category.
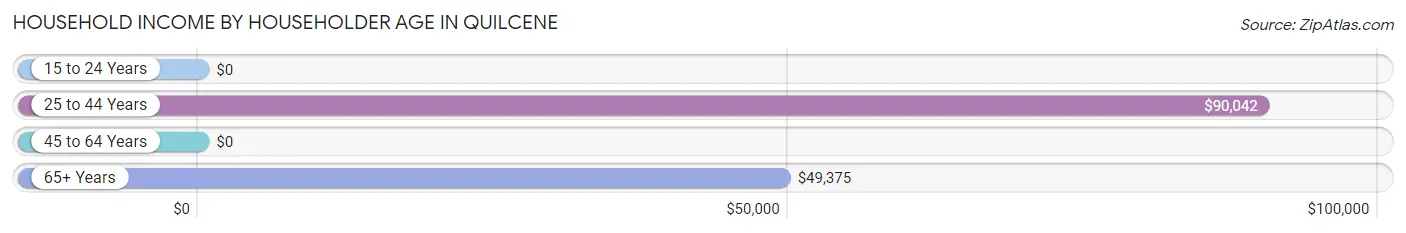
| Income Bracket | # Households | Median Income |
| 15 to 24 Years | 0 (0.0%) | $0 |
| 25 to 44 Years | 73 (28.5%) | $90,042 |
| 45 to 64 Years | 58 (22.7%) | $0 |
| 65+ Years | 125 (48.8%) | $49,375 |
| Total | 256 (100.0%) | $55,577 |
Poverty in Quilcene
Income Below Poverty by Sex and Age in Quilcene
With 4.1% poverty level for males and 25.1% for females among the residents of Quilcene, 45 to 54 year old males and 15 year old females are the most vulnerable to poverty, with 6 males (23.1%) and 10 females (100.0%) in their respective age groups living below the poverty level.
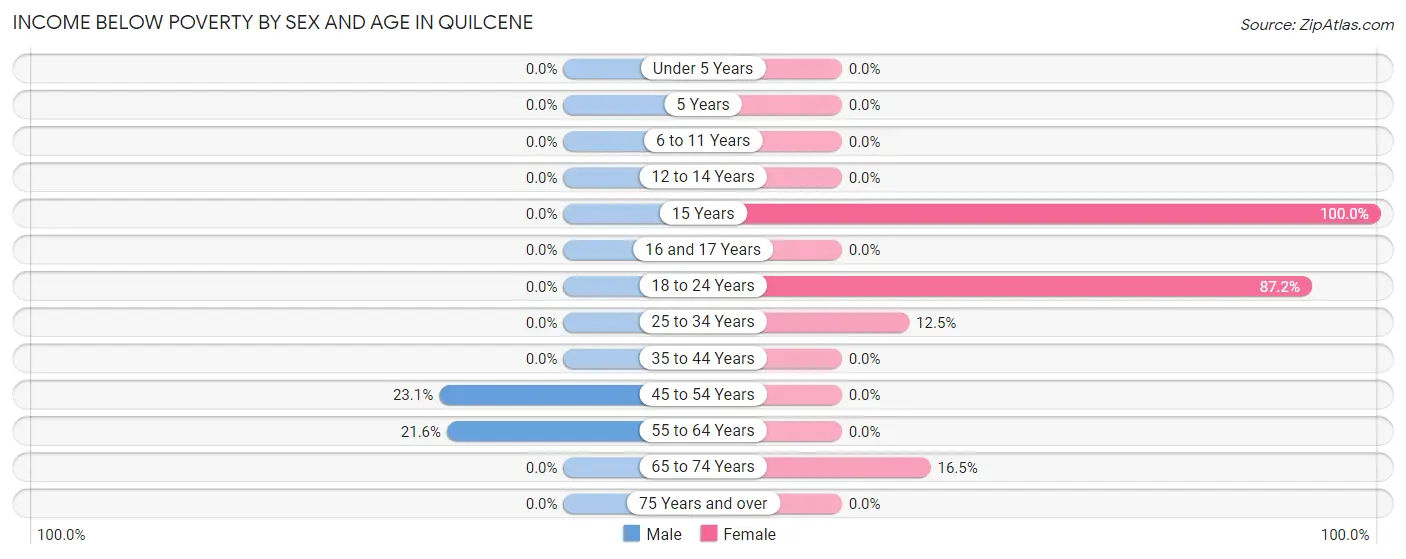
| Age Bracket | Male | Female |
| Under 5 Years | 0 (0.0%) | 0 (0.0%) |
| 5 Years | 0 (0.0%) | 0 (0.0%) |
| 6 to 11 Years | 0 (0.0%) | 0 (0.0%) |
| 12 to 14 Years | 0 (0.0%) | 0 (0.0%) |
| 15 Years | 0 (0.0%) | 10 (100.0%) |
| 16 and 17 Years | 0 (0.0%) | 0 (0.0%) |
| 18 to 24 Years | 0 (0.0%) | 41 (87.2%) |
| 25 to 34 Years | 0 (0.0%) | 1 (12.5%) |
| 35 to 44 Years | 0 (0.0%) | 0 (0.0%) |
| 45 to 54 Years | 6 (23.1%) | 0 (0.0%) |
| 55 to 64 Years | 8 (21.6%) | 0 (0.0%) |
| 65 to 74 Years | 0 (0.0%) | 15 (16.5%) |
| 75 Years and over | 0 (0.0%) | 0 (0.0%) |
| Total | 14 (4.1%) | 67 (25.1%) |
Income Above Poverty by Sex and Age in Quilcene
According to the poverty statistics in Quilcene, males aged under 5 years and females aged 12 to 14 years are the age groups that are most secure financially, with 100.0% of males and 100.0% of females in these age groups living above the poverty line.
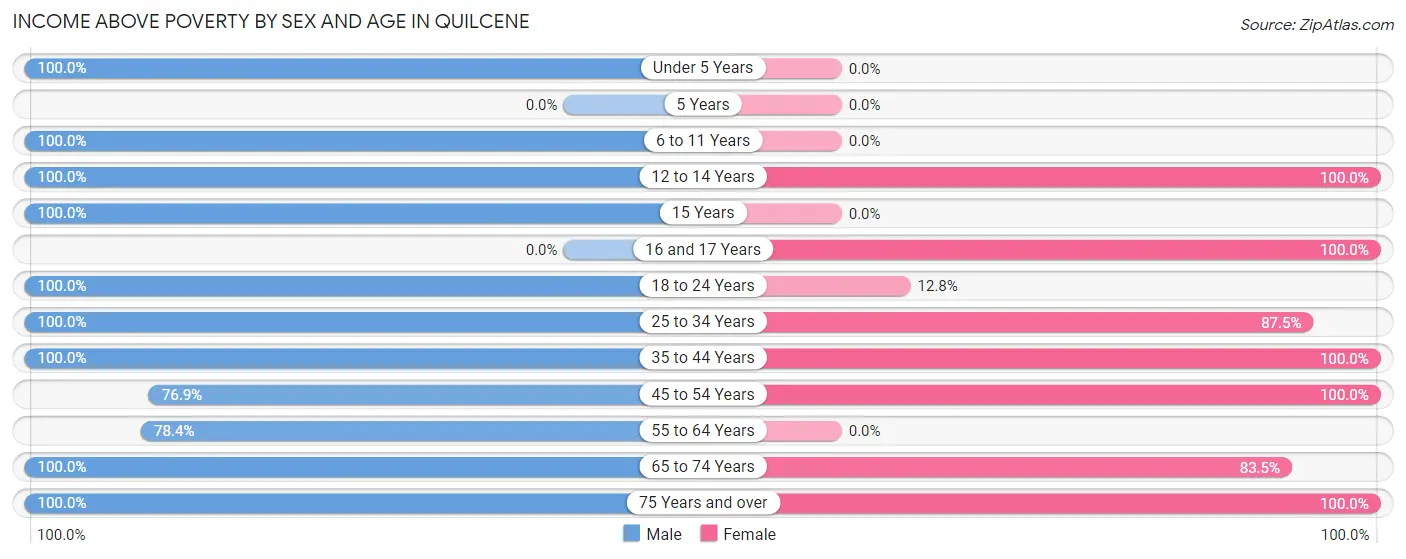
| Age Bracket | Male | Female |
| Under 5 Years | 16 (100.0%) | 0 (0.0%) |
| 5 Years | 0 (0.0%) | 0 (0.0%) |
| 6 to 11 Years | 16 (100.0%) | 0 (0.0%) |
| 12 to 14 Years | 6 (100.0%) | 15 (100.0%) |
| 15 Years | 3 (100.0%) | 0 (0.0%) |
| 16 and 17 Years | 0 (0.0%) | 10 (100.0%) |
| 18 to 24 Years | 25 (100.0%) | 6 (12.8%) |
| 25 to 34 Years | 108 (100.0%) | 7 (87.5%) |
| 35 to 44 Years | 10 (100.0%) | 33 (100.0%) |
| 45 to 54 Years | 20 (76.9%) | 34 (100.0%) |
| 55 to 64 Years | 29 (78.4%) | 0 (0.0%) |
| 65 to 74 Years | 34 (100.0%) | 76 (83.5%) |
| 75 Years and over | 62 (100.0%) | 19 (100.0%) |
| Total | 329 (95.9%) | 200 (74.9%) |
Income Below Poverty Among Married-Couple Families in Quilcene
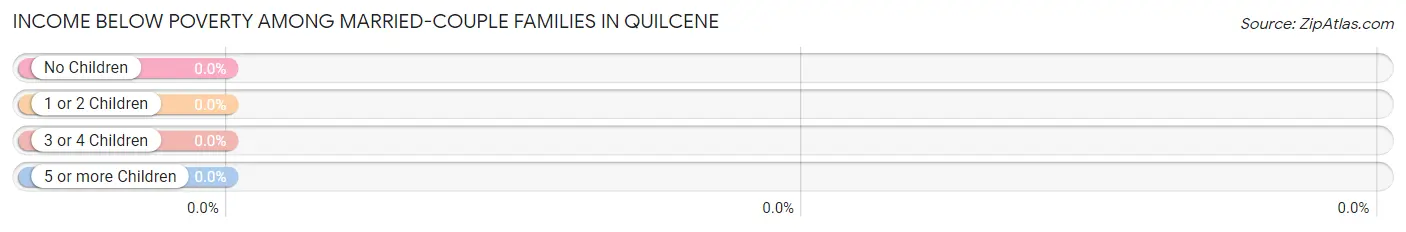
| Children | Above Poverty | Below Poverty |
| No Children | 88 (100.0%) | 0 (0.0%) |
| 1 or 2 Children | 12 (100.0%) | 0 (0.0%) |
| 3 or 4 Children | 13 (100.0%) | 0 (0.0%) |
| 5 or more Children | 0 (0.0%) | 0 (0.0%) |
| Total | 113 (100.0%) | 0 (0.0%) |
Income Below Poverty Among Single-Parent Households in Quilcene
| Children | Single Father | Single Mother |
| No Children | 0 (0.0%) | 0 (0.0%) |
| 1 or 2 Children | 0 (0.0%) | 0 (0.0%) |
| 3 or 4 Children | 0 (0.0%) | 0 (0.0%) |
| 5 or more Children | 0 (0.0%) | 0 (0.0%) |
| Total | 0 (0.0%) | 0 (0.0%) |
Income Below Poverty Among Married-Couple vs Single-Parent Households in Quilcene
| Children | Married-Couple Families | Single-Parent Households |
| No Children | 0 (0.0%) | 0 (0.0%) |
| 1 or 2 Children | 0 (0.0%) | 0 (0.0%) |
| 3 or 4 Children | 0 (0.0%) | 0 (0.0%) |
| 5 or more Children | 0 (0.0%) | 0 (0.0%) |
| Total | 0 (0.0%) | 0 (0.0%) |
Race in Quilcene
The most populous races in Quilcene are White / Caucasian (542 | 88.8%), and Two or more Races (68 | 11.2%).
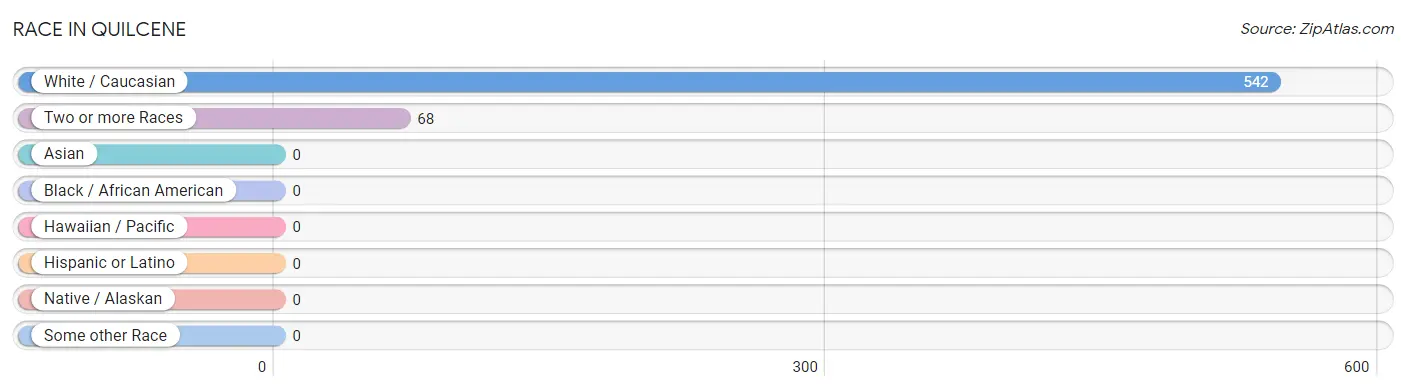
| Race | # Population | % Population |
| Asian | 0 | 0.0% |
| Black / African American | 0 | 0.0% |
| Hawaiian / Pacific | 0 | 0.0% |
| Hispanic or Latino | 0 | 0.0% |
| Native / Alaskan | 0 | 0.0% |
| White / Caucasian | 542 | 88.8% |
| Two or more Races | 68 | 11.2% |
| Some other Race | 0 | 0.0% |
| Total | 610 | 100.0% |
Ancestry in Quilcene
The most populous ancestries reported in Quilcene are German (78 | 12.8%), English (75 | 12.3%), Irish (55 | 9.0%), Norwegian (50 | 8.2%), and French (32 | 5.2%), together accounting for 47.6% of all Quilcene residents.
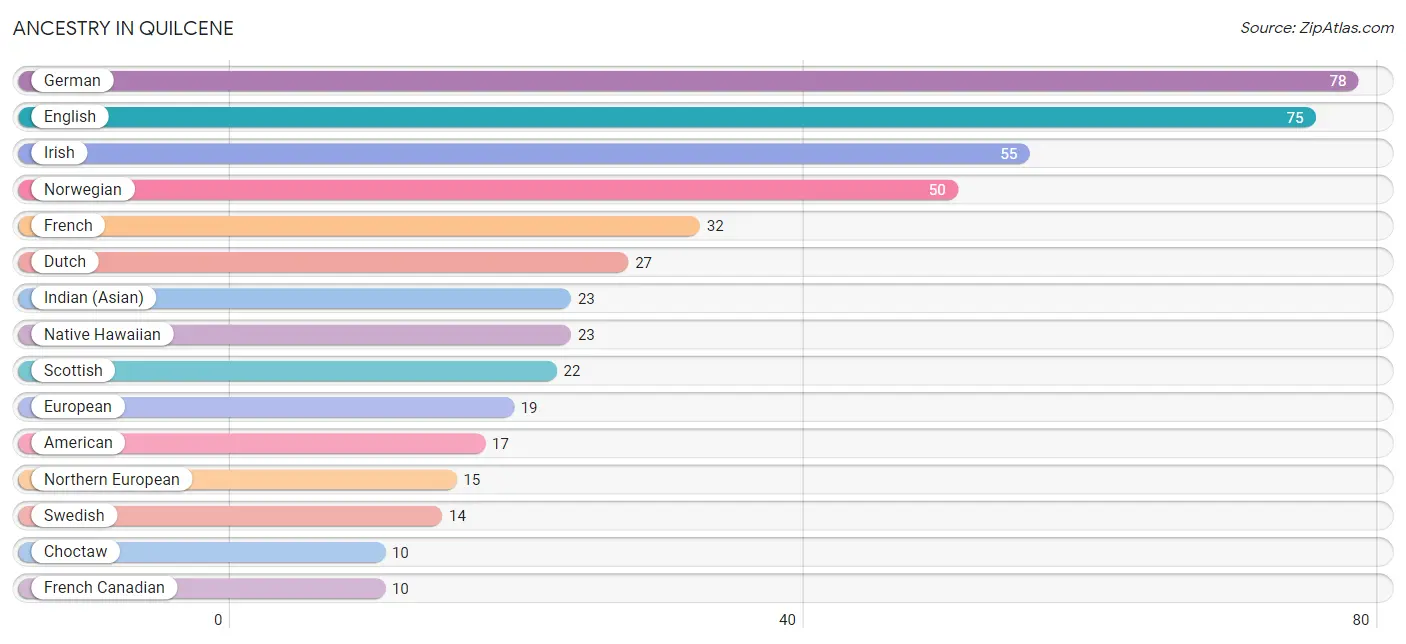
| Ancestry | # Population | % Population |
| American | 17 | 2.8% |
| Choctaw | 10 | 1.6% |
| Dutch | 27 | 4.4% |
| English | 75 | 12.3% |
| European | 19 | 3.1% |
| French | 32 | 5.2% |
| French Canadian | 10 | 1.6% |
| German | 78 | 12.8% |
| Indian (Asian) | 23 | 3.8% |
| Irish | 55 | 9.0% |
| Italian | 1 | 0.2% |
| Native Hawaiian | 23 | 3.8% |
| Northern European | 15 | 2.5% |
| Norwegian | 50 | 8.2% |
| Portuguese | 7 | 1.1% |
| Scottish | 22 | 3.6% |
| Swedish | 14 | 2.3% | View All 17 Rows |
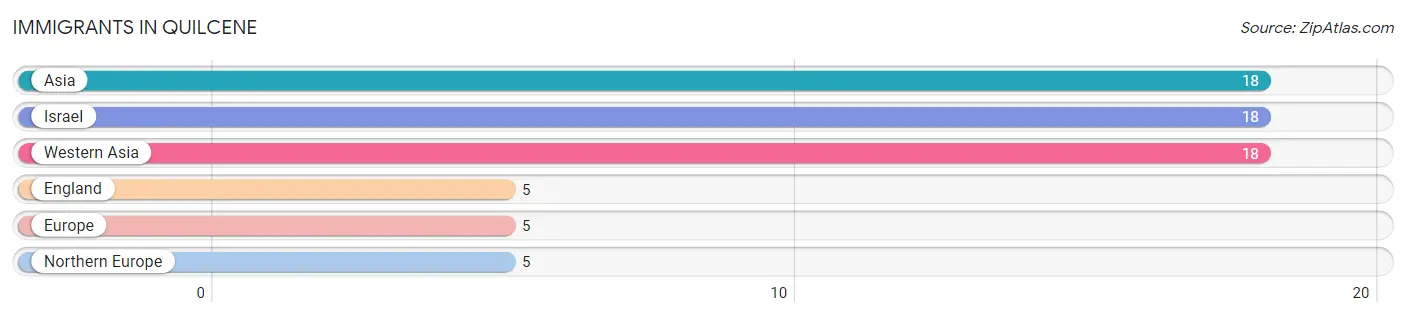
Immigrants in Quilcene
The most numerous immigrant groups reported in Quilcene came from Asia (18 | 2.9%), Israel (18 | 2.9%), Western Asia (18 | 2.9%), England (5 | 0.8%), and Europe (5 | 0.8%), together accounting for 10.5% of all Quilcene residents.
| Immigration Origin | # Population | % Population |
| Asia | 18 | 2.9% |
| England | 5 | 0.8% |
| Europe | 5 | 0.8% |
| Israel | 18 | 2.9% |
| Northern Europe | 5 | 0.8% |
| Western Asia | 18 | 2.9% | View All 6 Rows |
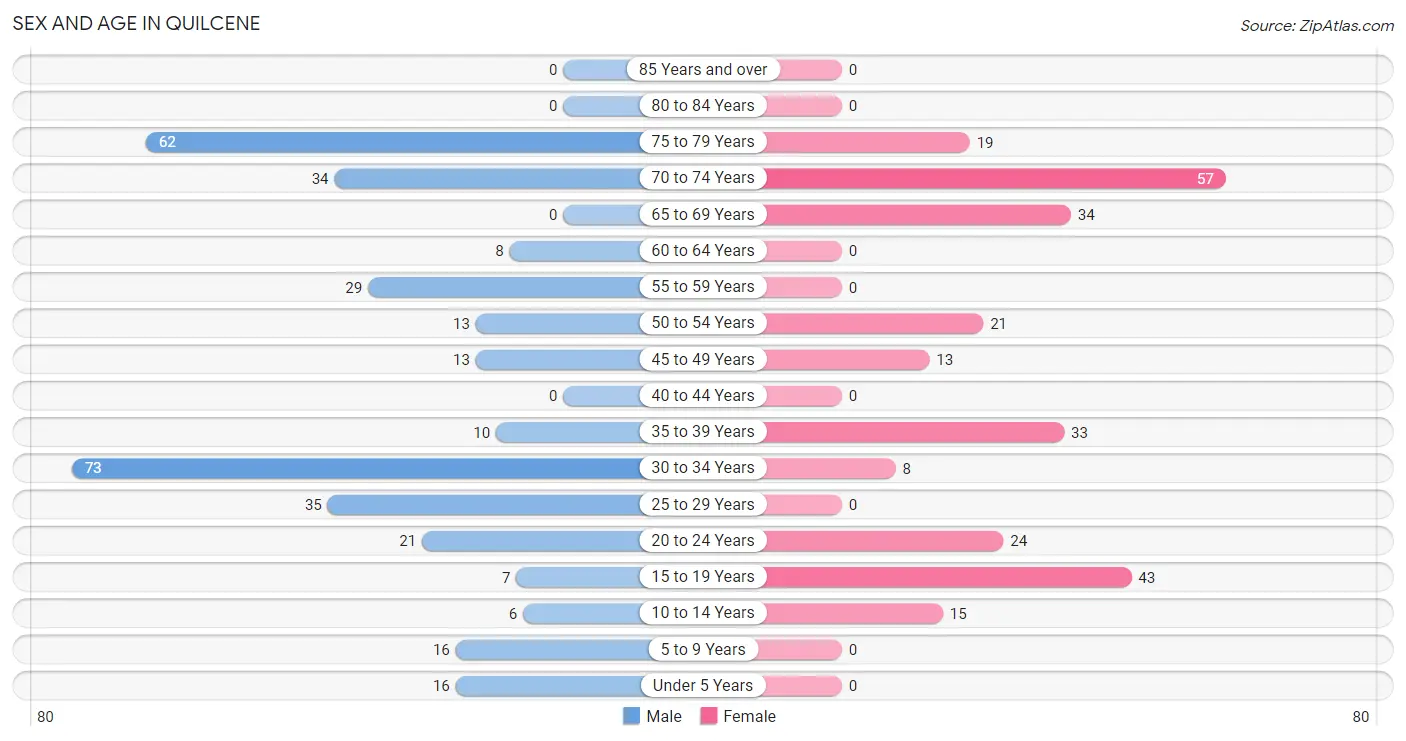
Sex and Age in Quilcene
Sex and Age in Quilcene
The most populous age groups in Quilcene are 30 to 34 Years (73 | 21.3%) for men and 70 to 74 Years (57 | 21.3%) for women.
| Age Bracket | Male | Female |
| Under 5 Years | 16 (4.7%) | 0 (0.0%) |
| 5 to 9 Years | 16 (4.7%) | 0 (0.0%) |
| 10 to 14 Years | 6 (1.8%) | 15 (5.6%) |
| 15 to 19 Years | 7 (2.0%) | 43 (16.1%) |
| 20 to 24 Years | 21 (6.1%) | 24 (9.0%) |
| 25 to 29 Years | 35 (10.2%) | 0 (0.0%) |
| 30 to 34 Years | 73 (21.3%) | 8 (3.0%) |
| 35 to 39 Years | 10 (2.9%) | 33 (12.4%) |
| 40 to 44 Years | 0 (0.0%) | 0 (0.0%) |
| 45 to 49 Years | 13 (3.8%) | 13 (4.9%) |
| 50 to 54 Years | 13 (3.8%) | 21 (7.9%) |
| 55 to 59 Years | 29 (8.5%) | 0 (0.0%) |
| 60 to 64 Years | 8 (2.3%) | 0 (0.0%) |
| 65 to 69 Years | 0 (0.0%) | 34 (12.7%) |
| 70 to 74 Years | 34 (9.9%) | 57 (21.3%) |
| 75 to 79 Years | 62 (18.1%) | 19 (7.1%) |
| 80 to 84 Years | 0 (0.0%) | 0 (0.0%) |
| 85 Years and over | 0 (0.0%) | 0 (0.0%) |
| Total | 343 (100.0%) | 267 (100.0%) |
Families and Households in Quilcene
Median Family Size in Quilcene
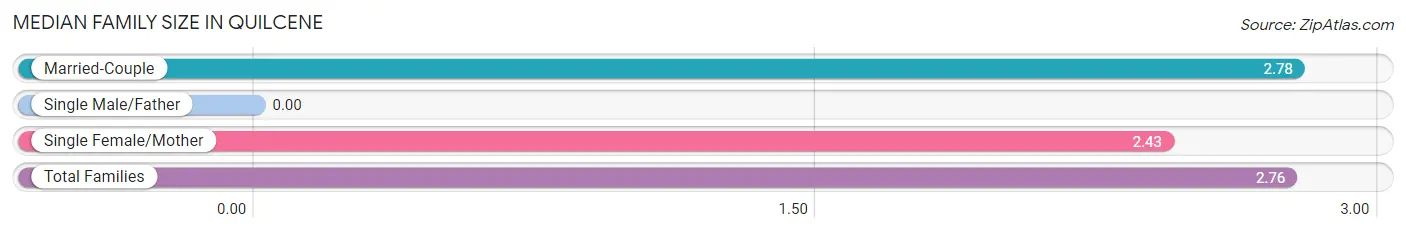
| Family Type | # Families | Family Size |
| Married-Couple | 113 (94.2%) | 2.78 |
| Single Male/Father | 0 (0.0%) | - |
| Single Female/Mother | 7 (5.8%) | 2.43 |
| Total Families | 120 (100.0%) | 2.76 |
Median Household Size in Quilcene
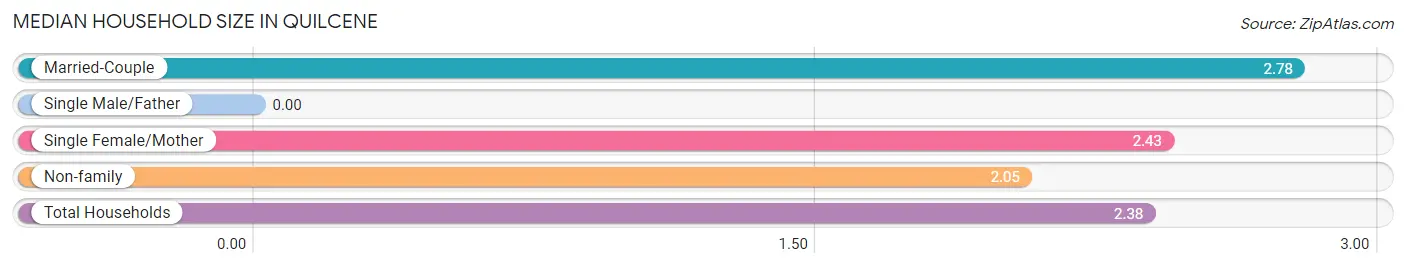
| Household Type | # Households | Household Size |
| Married-Couple | 113 (44.1%) | 2.78 |
| Single Male/Father | 0 (0.0%) | - |
| Single Female/Mother | 7 (2.7%) | 2.43 |
| Non-family | 136 (53.1%) | 2.05 |
| Total Households | 256 (100.0%) | 2.38 |
Household Size by Marriage Status in Quilcene
Out of a total of 256 households in Quilcene, 120 (46.9%) are family households, while 136 (53.1%) are nonfamily households. The most numerous type of family households are 2-person households, comprising 95, and the most common type of nonfamily households are 1-person households, comprising 82.
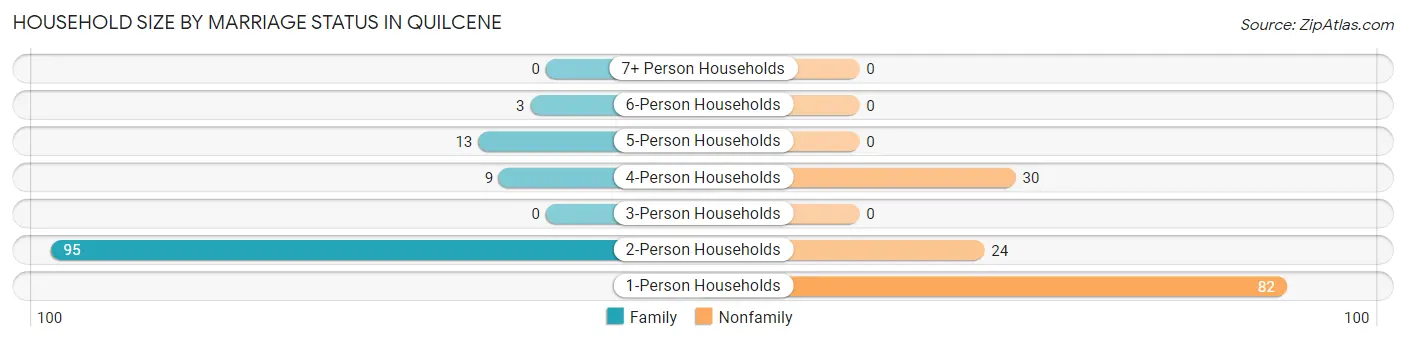
| Household Size | Family Households | Nonfamily Households |
| 1-Person Households | - | 82 (32.0%) |
| 2-Person Households | 95 (37.1%) | 24 (9.4%) |
| 3-Person Households | 0 (0.0%) | 0 (0.0%) |
| 4-Person Households | 9 (3.5%) | 30 (11.7%) |
| 5-Person Households | 13 (5.1%) | 0 (0.0%) |
| 6-Person Households | 3 (1.2%) | 0 (0.0%) |
| 7+ Person Households | 0 (0.0%) | 0 (0.0%) |
| Total | 120 (46.9%) | 136 (53.1%) |
Female Fertility in Quilcene
Fertility by Age in Quilcene
| Age Bracket | Women with Births | Births / 1,000 Women |
| 15 to 19 years | 0 (0.0%) | 0.0 |
| 20 to 34 years | 0 (0.0%) | 0.0 |
| 35 to 50 years | 0 (0.0%) | 0.0 |
| Total | 0 (0.0%) | 0.0 |
Fertility by Age by Marriage Status in Quilcene
| Age Bracket | Married | Unmarried |
| 15 to 19 years | 0 (0.0%) | 0 (0.0%) |
| 20 to 34 years | 0 (0.0%) | 0 (0.0%) |
| 35 to 50 years | 0 (0.0%) | 0 (0.0%) |
| Total | 0 (0.0%) | 0 (0.0%) |
Fertility by Education in Quilcene
| Educational Attainment | Women with Births | Births / 1,000 Women |
| Less than High School | 0 (0.0%) | 0.0 |
| High School Diploma | 0 (0.0%) | 0.0 |
| College or Associate's Degree | 0 (0.0%) | 0.0 |
| Bachelor's Degree | 0 (0.0%) | 0.0 |
| Graduate Degree | 0 (0.0%) | 0.0 |
| Total | 0 (0.0%) | 0.0 |
Fertility by Education by Marriage Status in Quilcene
| Educational Attainment | Married | Unmarried |
| Less than High School | 0 (0.0%) | 0 (0.0%) |
| High School Diploma | 0 (0.0%) | 0 (0.0%) |
| College or Associate's Degree | 0 (0.0%) | 0 (0.0%) |
| Bachelor's Degree | 0 (0.0%) | 0 (0.0%) |
| Graduate Degree | 0 (0.0%) | 0 (0.0%) |
| Total | 0 (0.0%) | 0 (0.0%) |
Employment Characteristics in Quilcene
Employment by Class of Employer in Quilcene
Among the 317 employed individuals in Quilcene, private company employees (244 | 77.0%), self-employed (not incorporated) (41 | 12.9%), and self-employed (incorporated) (14 | 4.4%) make up the most common classes of employment.
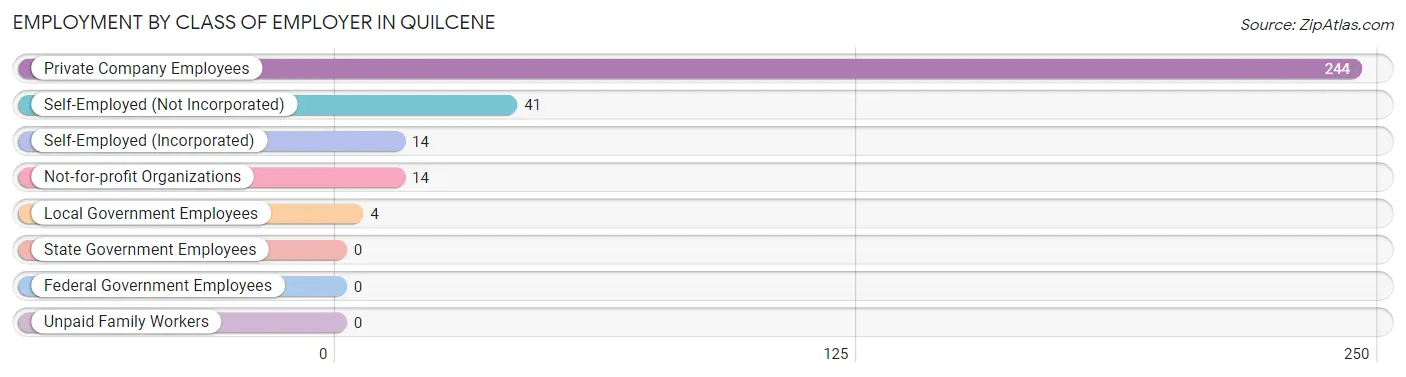
| Employer Class | # Employees | % Employees |
| Private Company Employees | 244 | 77.0% |
| Self-Employed (Incorporated) | 14 | 4.4% |
| Self-Employed (Not Incorporated) | 41 | 12.9% |
| Not-for-profit Organizations | 14 | 4.4% |
| Local Government Employees | 4 | 1.3% |
| State Government Employees | 0 | 0.0% |
| Federal Government Employees | 0 | 0.0% |
| Unpaid Family Workers | 0 | 0.0% |
| Total | 317 | 100.0% |
Employment Status by Age in Quilcene
According to the labor force statistics for Quilcene, out of the total population over 16 years of age (544), 62.9% or 342 individuals are in the labor force, with 7.3% or 25 of them unemployed. The age group with the highest labor force participation rate is 16 to 19 years, with 100.0% or 37 individuals in the labor force. Within the labor force, the 20 to 24 years age range has the highest percentage of unemployed individuals, with 33.3% or 15 of them being unemployed.
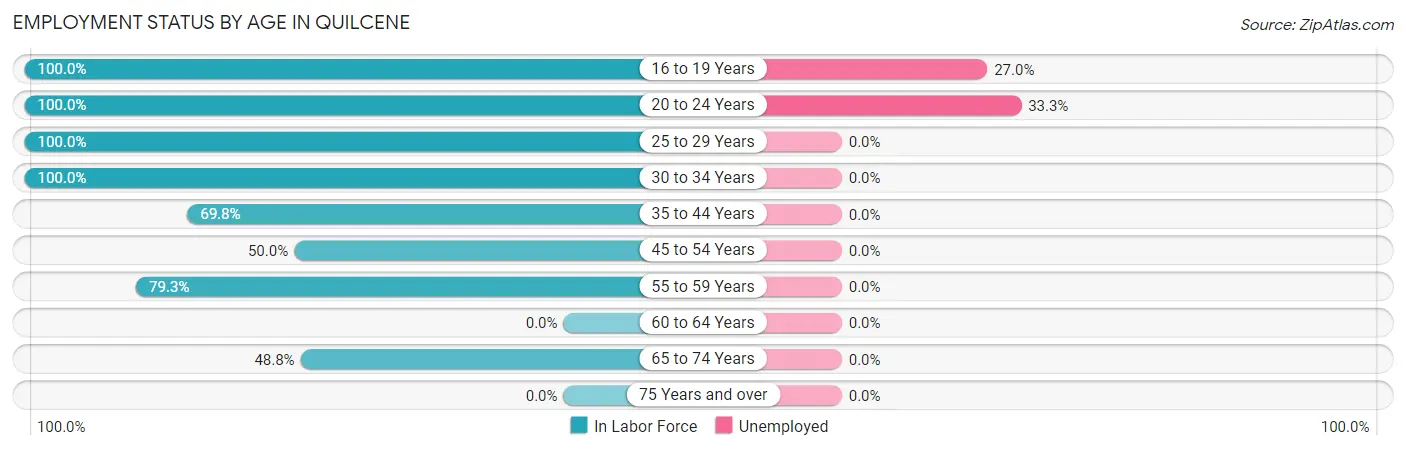
| Age Bracket | In Labor Force | Unemployed |
| 16 to 19 Years | 37 (100.0%) | 10 (27.0%) |
| 20 to 24 Years | 45 (100.0%) | 15 (33.3%) |
| 25 to 29 Years | 35 (100.0%) | 0 (0.0%) |
| 30 to 34 Years | 81 (100.0%) | 0 (0.0%) |
| 35 to 44 Years | 30 (69.8%) | 0 (0.0%) |
| 45 to 54 Years | 30 (50.0%) | 0 (0.0%) |
| 55 to 59 Years | 23 (79.3%) | 0 (0.0%) |
| 60 to 64 Years | 0 (0.0%) | 0 (0.0%) |
| 65 to 74 Years | 61 (48.8%) | 0 (0.0%) |
| 75 Years and over | 0 (0.0%) | 0 (0.0%) |
| Total | 342 (62.9%) | 25 (7.3%) |
Employment Status by Educational Attainment in Quilcene
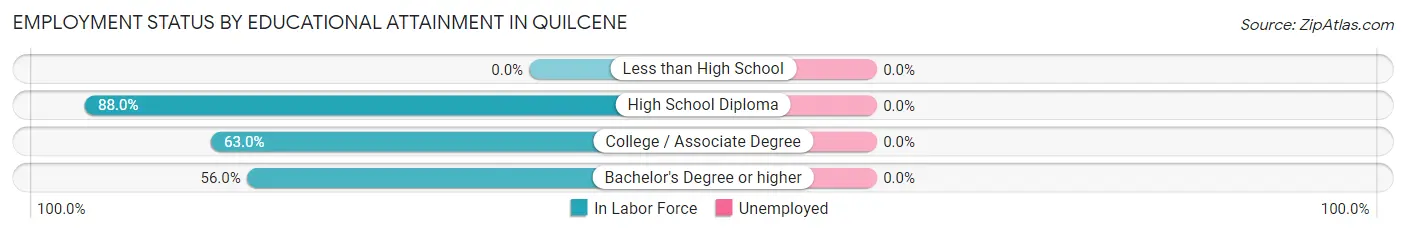
| Educational Attainment | In Labor Force | Unemployed |
| Less than High School | 0 (0.0%) | 0 (0.0%) |
| High School Diploma | 139 (88.0%) | 0 (0.0%) |
| College / Associate Degree | 46 (63.0%) | 0 (0.0%) |
| Bachelor's Degree or higher | 14 (56.0%) | 0 (0.0%) |
| Total | 199 (77.7%) | 0 (0.0%) |
Employment Occupations by Sex in Quilcene
Management, Business, Science and Arts Occupations
The most common Management, Business, Science and Arts occupations in Quilcene are Management (15 | 4.7%), Community & Social Service (14 | 4.4%), and Education, Arts & Media (14 | 4.4%).
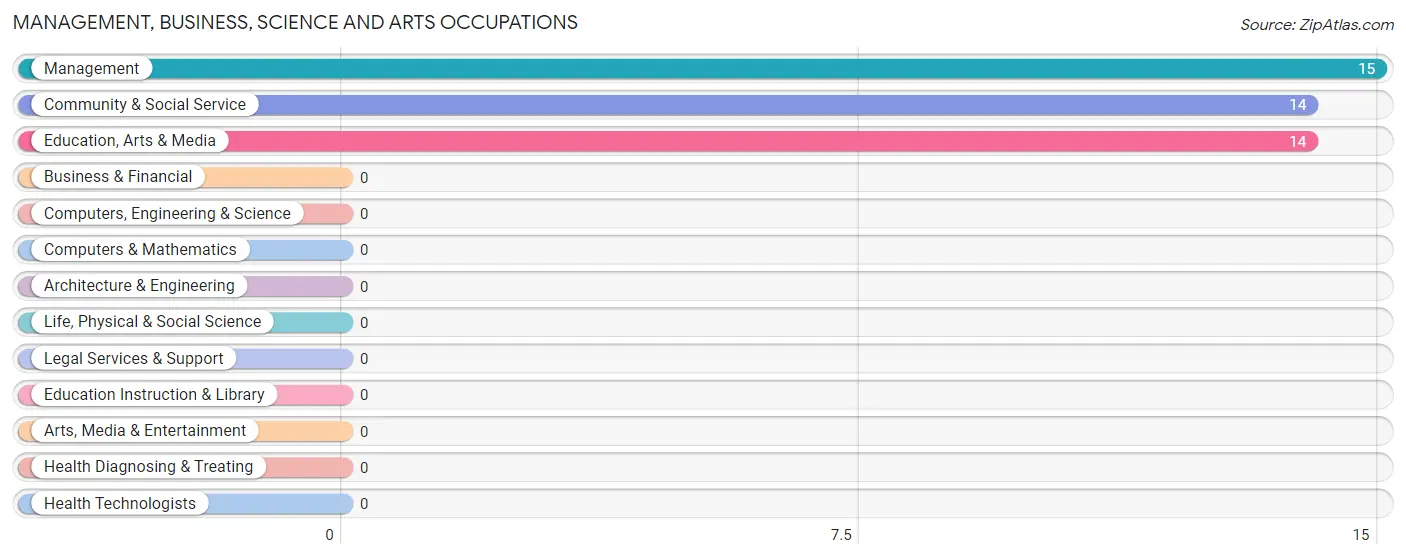
Management, Business, Science and Arts Occupations by Sex
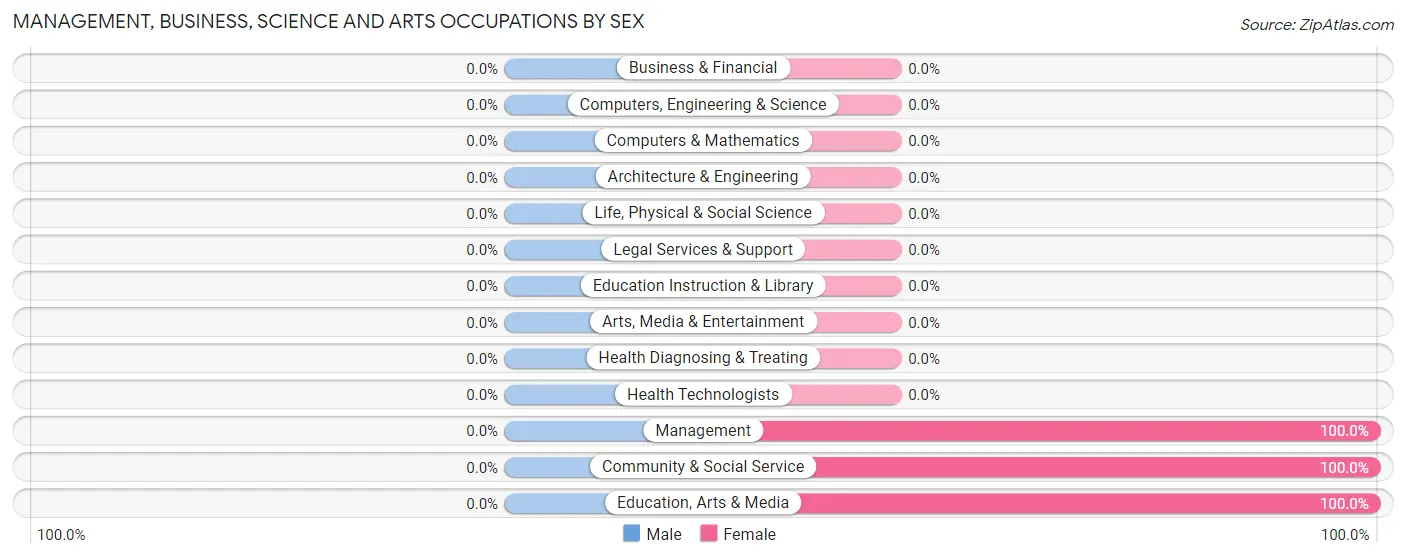
| Occupation | Male | Female |
| Management | 0 (0.0%) | 15 (100.0%) |
| Business & Financial | 0 (0.0%) | 0 (0.0%) |
| Computers, Engineering & Science | 0 (0.0%) | 0 (0.0%) |
| Computers & Mathematics | 0 (0.0%) | 0 (0.0%) |
| Architecture & Engineering | 0 (0.0%) | 0 (0.0%) |
| Life, Physical & Social Science | 0 (0.0%) | 0 (0.0%) |
| Community & Social Service | 0 (0.0%) | 14 (100.0%) |
| Education, Arts & Media | 0 (0.0%) | 14 (100.0%) |
| Legal Services & Support | 0 (0.0%) | 0 (0.0%) |
| Education Instruction & Library | 0 (0.0%) | 0 (0.0%) |
| Arts, Media & Entertainment | 0 (0.0%) | 0 (0.0%) |
| Health Diagnosing & Treating | 0 (0.0%) | 0 (0.0%) |
| Health Technologists | 0 (0.0%) | 0 (0.0%) |
| Total (Category) | 0 (0.0%) | 29 (100.0%) |
| Total (Overall) | 185 (58.4%) | 132 (41.6%) |
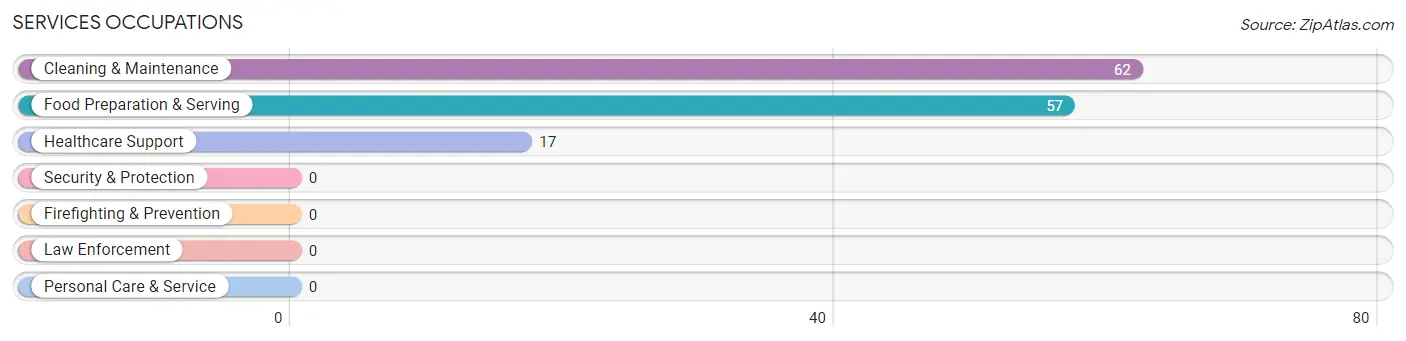
Services Occupations
The most common Services occupations in Quilcene are Cleaning & Maintenance (62 | 19.6%), Food Preparation & Serving (57 | 18.0%), and Healthcare Support (17 | 5.4%).
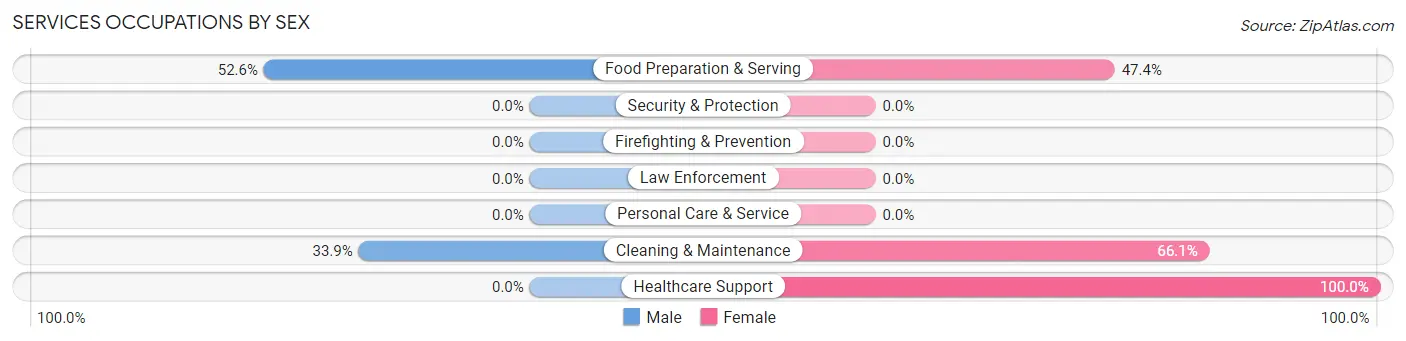
Services Occupations by Sex
Within the Services occupations in Quilcene, the most male-oriented occupations are Food Preparation & Serving (52.6%), and Cleaning & Maintenance (33.9%), while the most female-oriented occupations are Healthcare Support (100.0%), Cleaning & Maintenance (66.1%), and Food Preparation & Serving (47.4%).
| Occupation | Male | Female |
| Healthcare Support | 0 (0.0%) | 17 (100.0%) |
| Security & Protection | 0 (0.0%) | 0 (0.0%) |
| Firefighting & Prevention | 0 (0.0%) | 0 (0.0%) |
| Law Enforcement | 0 (0.0%) | 0 (0.0%) |
| Food Preparation & Serving | 30 (52.6%) | 27 (47.4%) |
| Cleaning & Maintenance | 21 (33.9%) | 41 (66.1%) |
| Personal Care & Service | 0 (0.0%) | 0 (0.0%) |
| Total (Category) | 51 (37.5%) | 85 (62.5%) |
| Total (Overall) | 185 (58.4%) | 132 (41.6%) |
Sales and Office Occupations
The most common Sales and Office occupations in Quilcene are , and Sales & Related (18 | 5.7%).
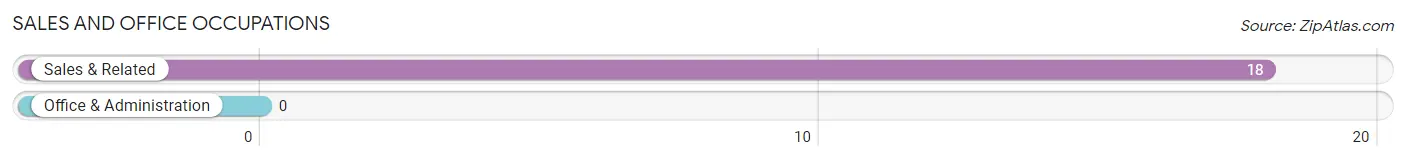
Sales and Office Occupations by Sex
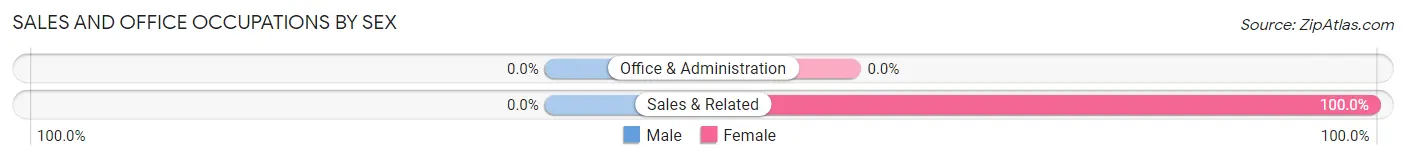
| Occupation | Male | Female |
| Sales & Related | 0 (0.0%) | 18 (100.0%) |
| Office & Administration | 0 (0.0%) | 0 (0.0%) |
| Total (Category) | 0 (0.0%) | 18 (100.0%) |
| Total (Overall) | 185 (58.4%) | 132 (41.6%) |
Natural Resources, Construction and Maintenance Occupations
The most common Natural Resources, Construction and Maintenance occupations in Quilcene are Installation, Maintenance & Repair (33 | 10.4%), Construction & Extraction (28 | 8.8%), and Farming, Fishing & Forestry (16 | 5.1%).
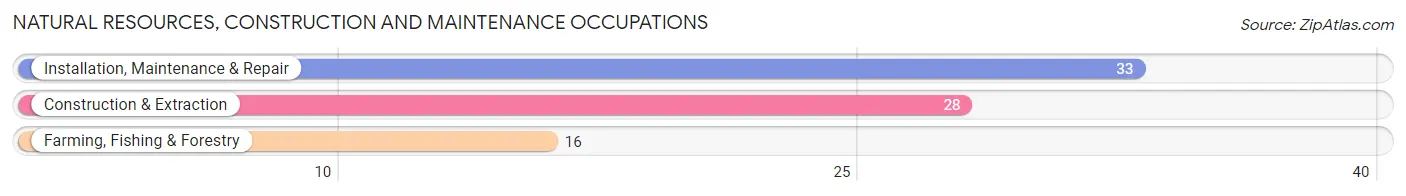
Natural Resources, Construction and Maintenance Occupations by Sex
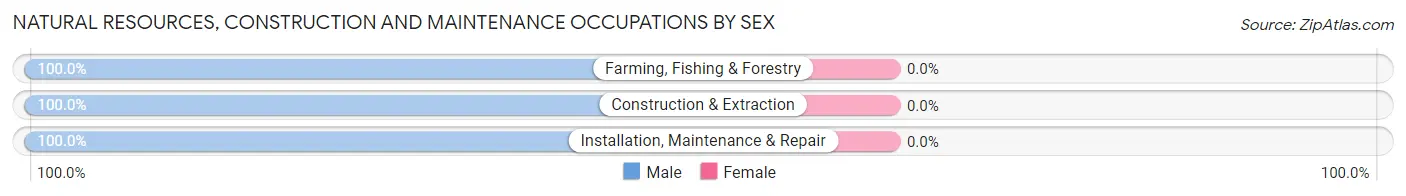
| Occupation | Male | Female |
| Farming, Fishing & Forestry | 16 (100.0%) | 0 (0.0%) |
| Construction & Extraction | 28 (100.0%) | 0 (0.0%) |
| Installation, Maintenance & Repair | 33 (100.0%) | 0 (0.0%) |
| Total (Category) | 77 (100.0%) | 0 (0.0%) |
| Total (Overall) | 185 (58.4%) | 132 (41.6%) |
Production, Transportation and Moving Occupations
The most common Production, Transportation and Moving occupations in Quilcene are Production (47 | 14.8%), Transportation (6 | 1.9%), and Material Moving (4 | 1.3%).
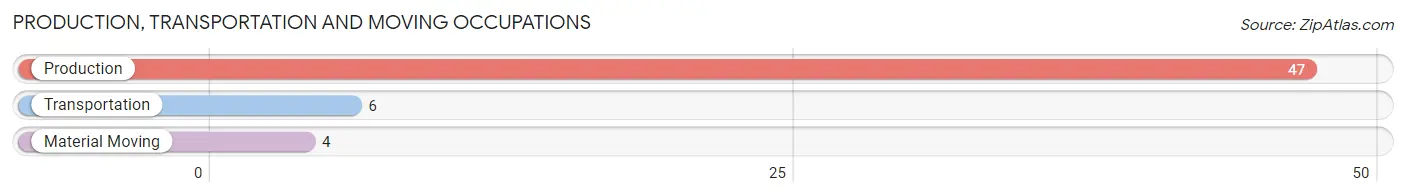
Production, Transportation and Moving Occupations by Sex
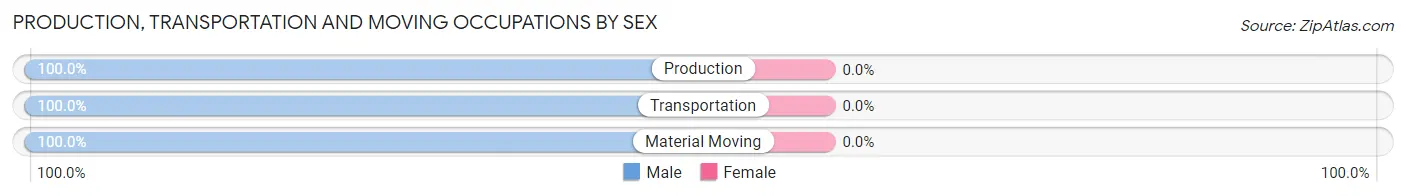
| Occupation | Male | Female |
| Production | 47 (100.0%) | 0 (0.0%) |
| Transportation | 6 (100.0%) | 0 (0.0%) |
| Material Moving | 4 (100.0%) | 0 (0.0%) |
| Total (Category) | 57 (100.0%) | 0 (0.0%) |
| Total (Overall) | 185 (58.4%) | 132 (41.6%) |
Employment Industries by Sex in Quilcene
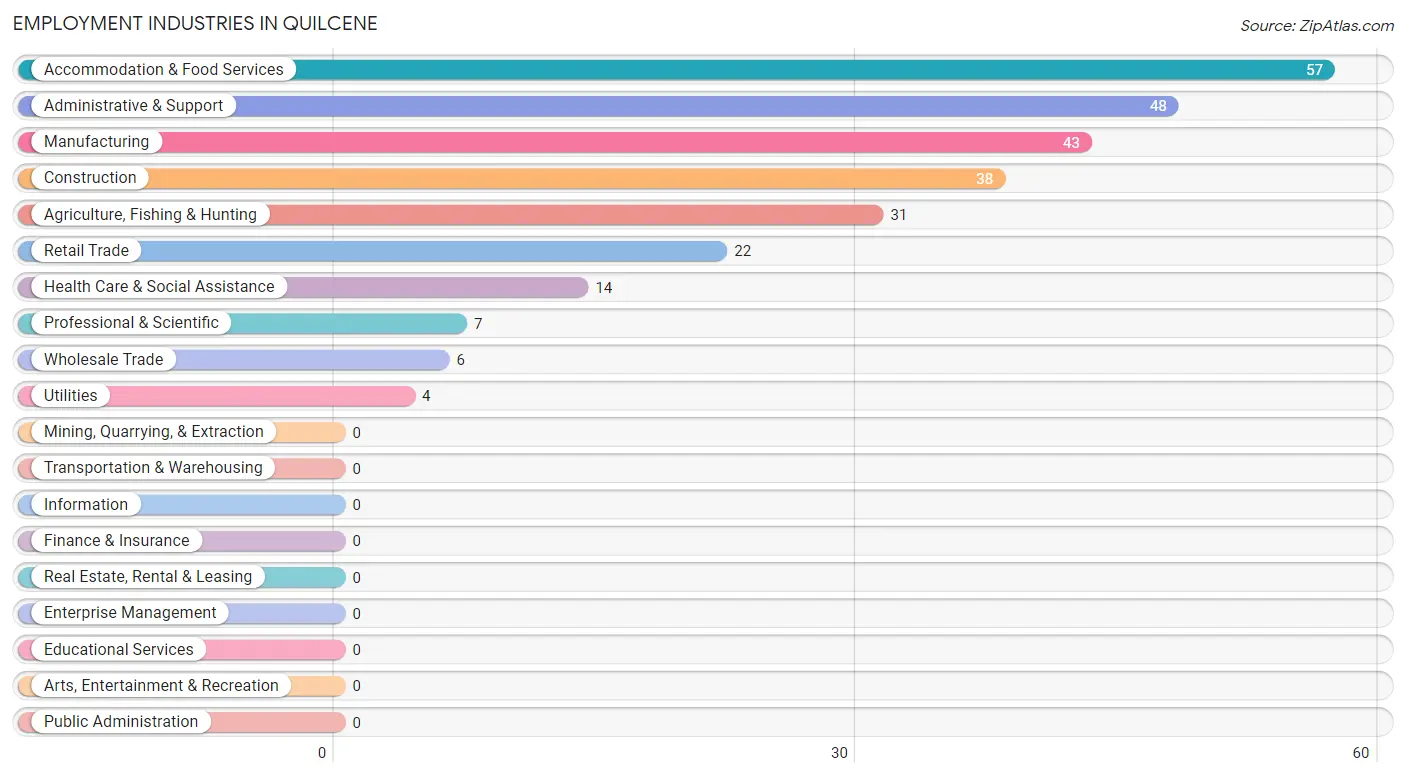
Employment Industries in Quilcene
The major employment industries in Quilcene include Accommodation & Food Services (57 | 18.0%), Administrative & Support (48 | 15.1%), Manufacturing (43 | 13.6%), Construction (38 | 12.0%), and Agriculture, Fishing & Hunting (31 | 9.8%).
Employment Industries by Sex in Quilcene
The Quilcene industries that see more men than women are Construction (100.0%), Manufacturing (100.0%), and Wholesale Trade (100.0%), whereas the industries that tend to have a higher number of women are Professional & Scientific (100.0%), Health Care & Social Assistance (100.0%), and Administrative & Support (85.4%).
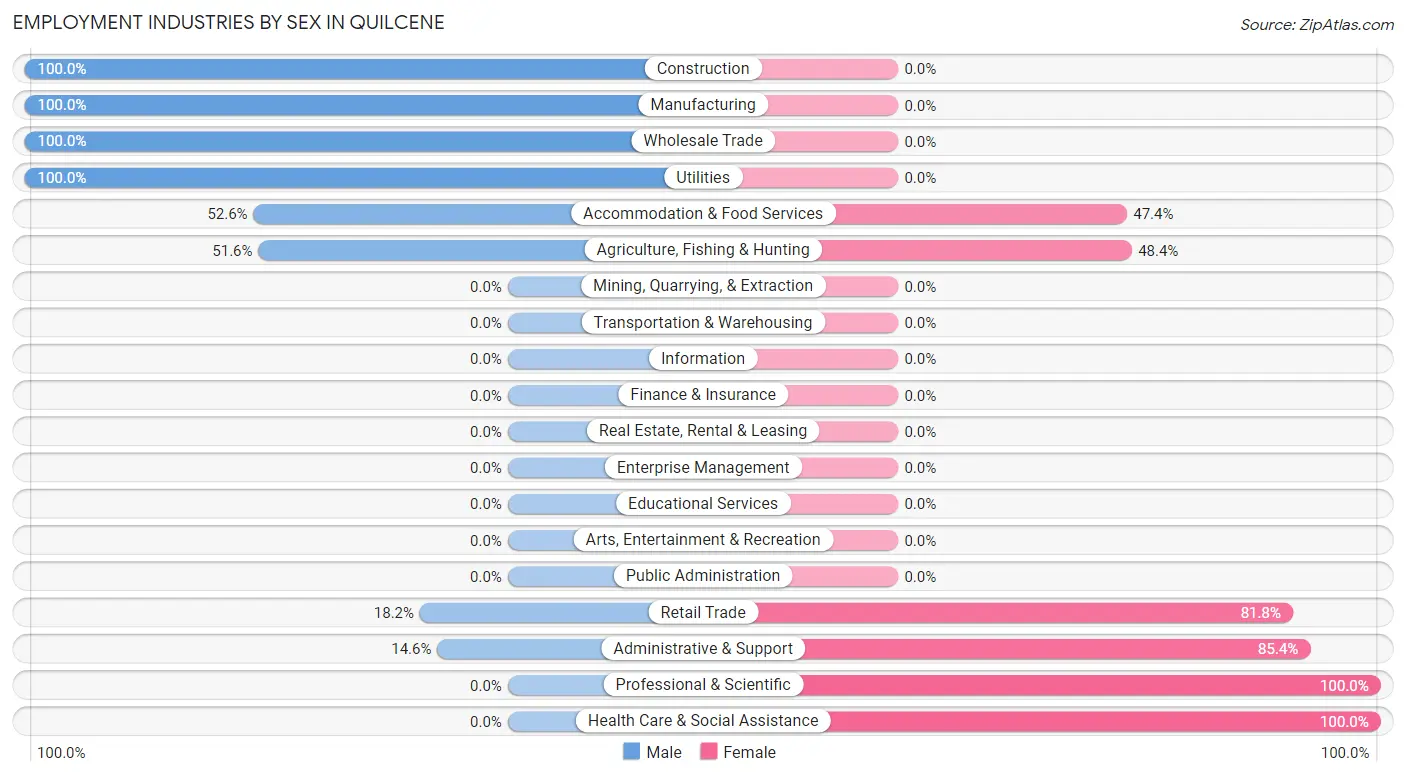
| Industry | Male | Female |
| Agriculture, Fishing & Hunting | 16 (51.6%) | 15 (48.4%) |
| Mining, Quarrying, & Extraction | 0 (0.0%) | 0 (0.0%) |
| Construction | 38 (100.0%) | 0 (0.0%) |
| Manufacturing | 43 (100.0%) | 0 (0.0%) |
| Wholesale Trade | 6 (100.0%) | 0 (0.0%) |
| Retail Trade | 4 (18.2%) | 18 (81.8%) |
| Transportation & Warehousing | 0 (0.0%) | 0 (0.0%) |
| Utilities | 4 (100.0%) | 0 (0.0%) |
| Information | 0 (0.0%) | 0 (0.0%) |
| Finance & Insurance | 0 (0.0%) | 0 (0.0%) |
| Real Estate, Rental & Leasing | 0 (0.0%) | 0 (0.0%) |
| Professional & Scientific | 0 (0.0%) | 7 (100.0%) |
| Enterprise Management | 0 (0.0%) | 0 (0.0%) |
| Administrative & Support | 7 (14.6%) | 41 (85.4%) |
| Educational Services | 0 (0.0%) | 0 (0.0%) |
| Health Care & Social Assistance | 0 (0.0%) | 14 (100.0%) |
| Arts, Entertainment & Recreation | 0 (0.0%) | 0 (0.0%) |
| Accommodation & Food Services | 30 (52.6%) | 27 (47.4%) |
| Public Administration | 0 (0.0%) | 0 (0.0%) |
| Total | 185 (58.4%) | 132 (41.6%) |
Education in Quilcene
School Enrollment in Quilcene
The most common levels of schooling among the 89 students in Quilcene are high school (27 | 30.3%), middle school (21 | 23.6%), and college / undergraduate (18 | 20.2%).
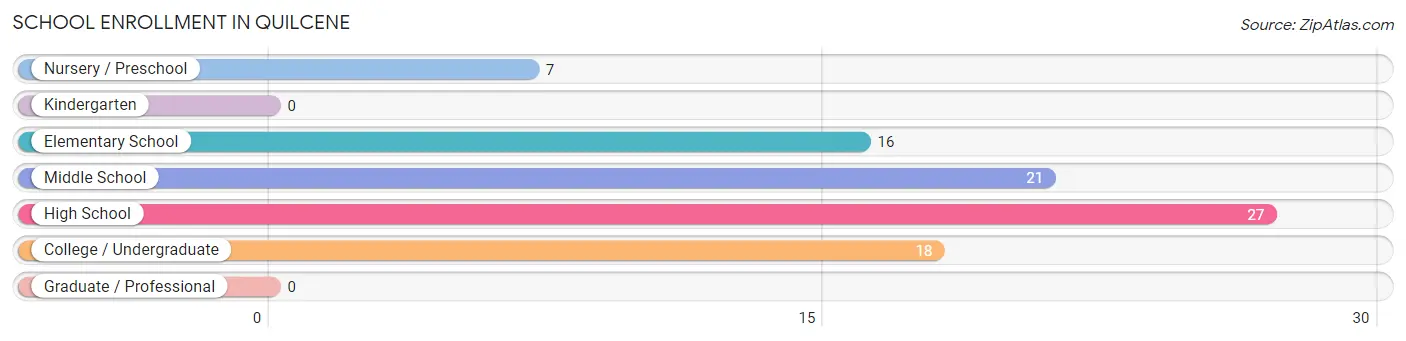
| School Level | # Students | % Students |
| Nursery / Preschool | 7 | 7.9% |
| Kindergarten | 0 | 0.0% |
| Elementary School | 16 | 18.0% |
| Middle School | 21 | 23.6% |
| High School | 27 | 30.3% |
| College / Undergraduate | 18 | 20.2% |
| Graduate / Professional | 0 | 0.0% |
| Total | 89 | 100.0% |
School Enrollment by Age by Funding Source in Quilcene
Out of a total of 89 students who are enrolled in schools in Quilcene, 20 (22.5%) attend a private institution, while the remaining 69 (77.5%) are enrolled in public schools. The age group of 3 to 4 year olds has the highest likelihood of being enrolled in private schools, with 7 (100.0% in the age bracket) enrolled. Conversely, the age group of 5 to 9 year old has the lowest likelihood of being enrolled in a private school, with 16 (100.0% in the age bracket) attending a public institution.
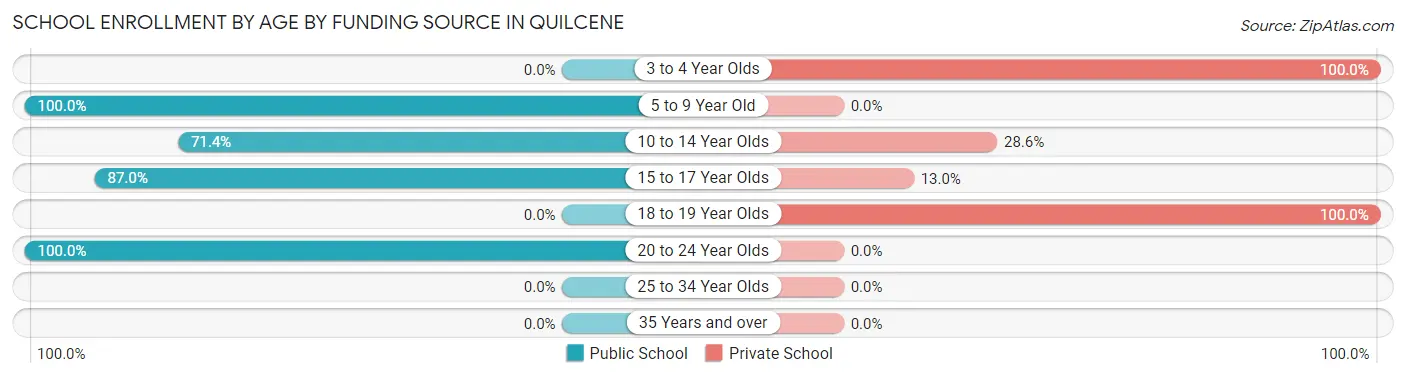
| Age Bracket | Public School | Private School |
| 3 to 4 Year Olds | 0 (0.0%) | 7 (100.0%) |
| 5 to 9 Year Old | 16 (100.0%) | 0 (0.0%) |
| 10 to 14 Year Olds | 15 (71.4%) | 6 (28.6%) |
| 15 to 17 Year Olds | 20 (87.0%) | 3 (13.0%) |
| 18 to 19 Year Olds | 0 (0.0%) | 4 (100.0%) |
| 20 to 24 Year Olds | 18 (100.0%) | 0 (0.0%) |
| 25 to 34 Year Olds | 0 (0.0%) | 0 (0.0%) |
| 35 Years and over | 0 (0.0%) | 0 (0.0%) |
| Total | 69 (77.5%) | 20 (22.5%) |
Educational Attainment by Field of Study in Quilcene
Liberal arts & history (18 | 19.4%), visual & performing arts (15 | 16.1%), arts & humanities (15 | 16.1%), education (14 | 15.0%), and literature & languages (14 | 15.0%) are the most common fields of study among 93 individuals in Quilcene who have obtained a bachelor's degree or higher.
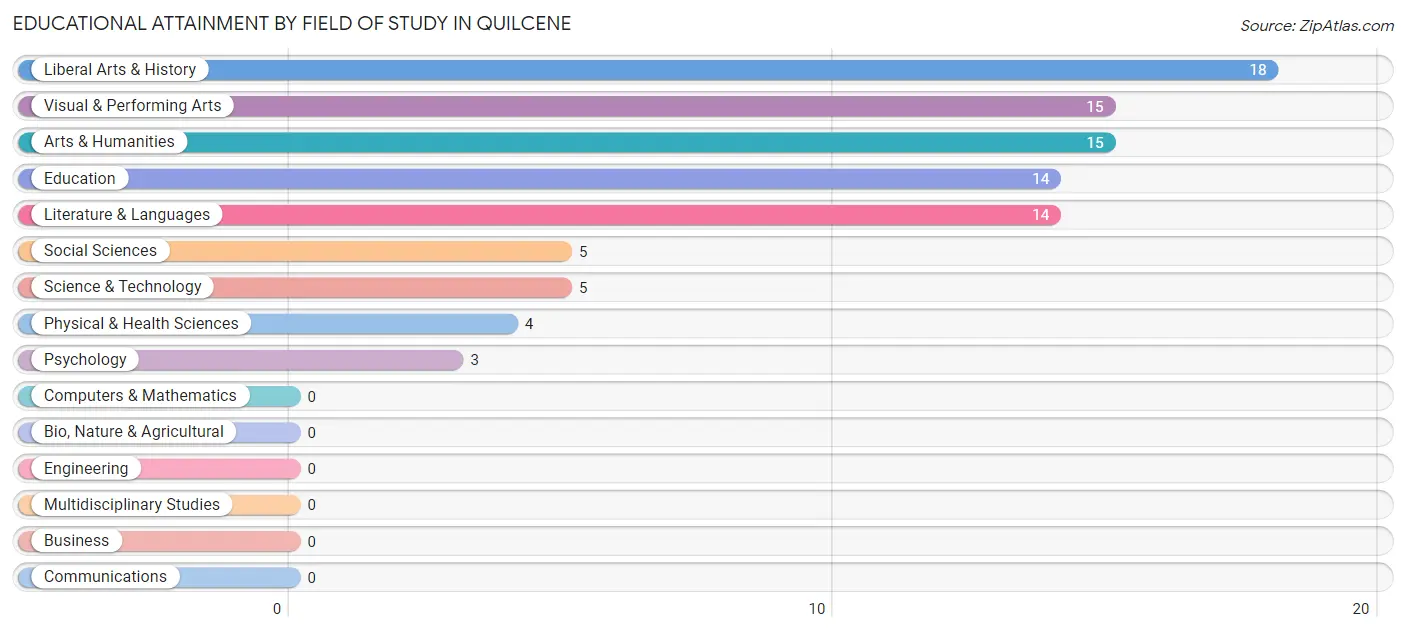
| Field of Study | # Graduates | % Graduates |
| Computers & Mathematics | 0 | 0.0% |
| Bio, Nature & Agricultural | 0 | 0.0% |
| Physical & Health Sciences | 4 | 4.3% |
| Psychology | 3 | 3.2% |
| Social Sciences | 5 | 5.4% |
| Engineering | 0 | 0.0% |
| Multidisciplinary Studies | 0 | 0.0% |
| Science & Technology | 5 | 5.4% |
| Business | 0 | 0.0% |
| Education | 14 | 15.0% |
| Literature & Languages | 14 | 15.0% |
| Liberal Arts & History | 18 | 19.4% |
| Visual & Performing Arts | 15 | 16.1% |
| Communications | 0 | 0.0% |
| Arts & Humanities | 15 | 16.1% |
| Total | 93 | 100.0% |
Transportation & Commute in Quilcene
Vehicle Availability by Sex in Quilcene
The most prevalent vehicle ownership categories in Quilcene are males with 2 vehicles (111, accounting for 60.0%) and females with 2 vehicles (78, making up 84.1%).
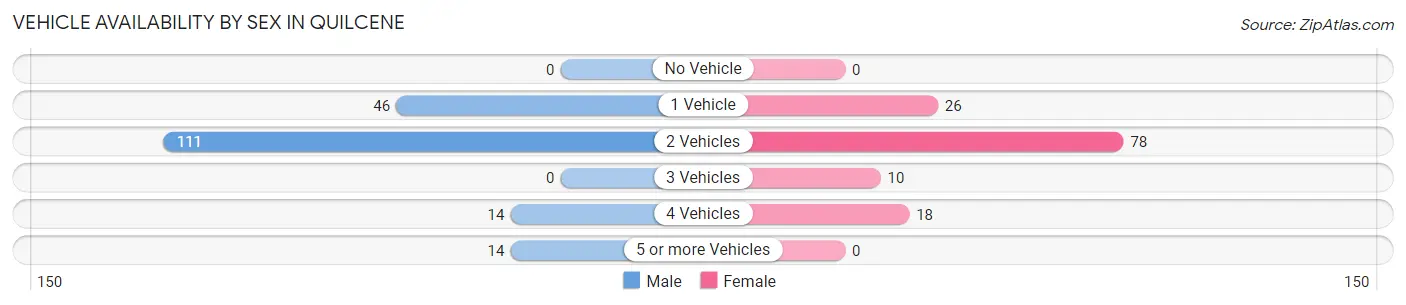
| Vehicles Available | Male | Female |
| No Vehicle | 0 (0.0%) | 0 (0.0%) |
| 1 Vehicle | 46 (24.9%) | 26 (19.7%) |
| 2 Vehicles | 111 (60.0%) | 78 (59.1%) |
| 3 Vehicles | 0 (0.0%) | 10 (7.6%) |
| 4 Vehicles | 14 (7.6%) | 18 (13.6%) |
| 5 or more Vehicles | 14 (7.6%) | 0 (0.0%) |
| Total | 185 (100.0%) | 132 (100.0%) |
Commute Time in Quilcene
The most frequently occuring commute durations in Quilcene are less than 5 minutes (62 commuters, 23.7%), 60 to 89 minutes (51 commuters, 19.5%), and 90 or more minutes (43 commuters, 16.5%).
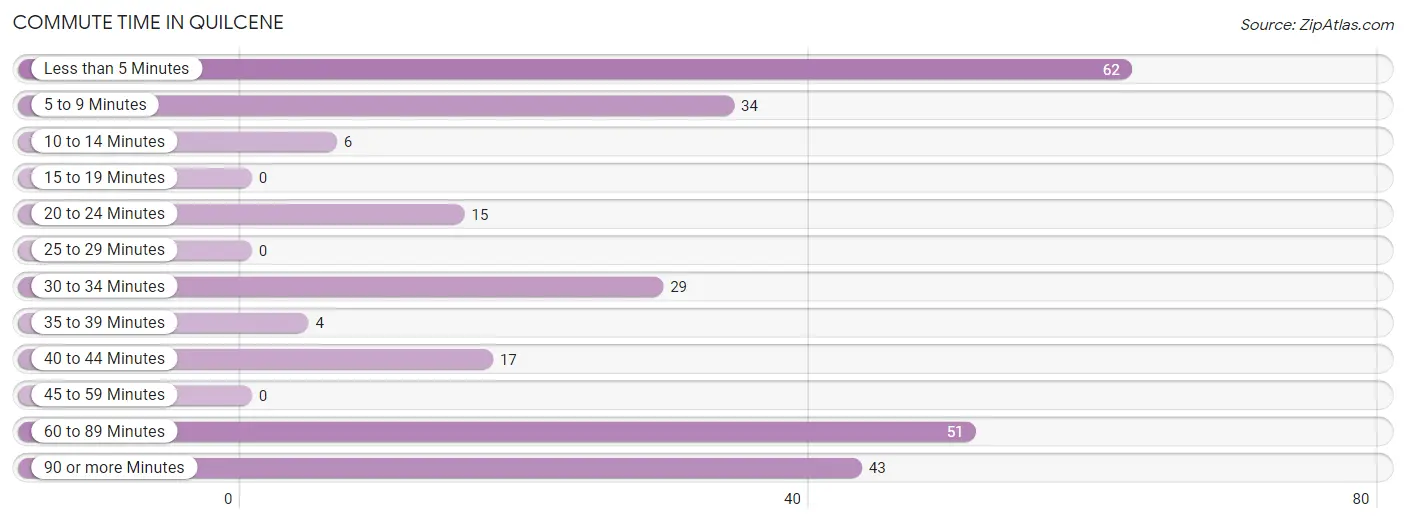
| Commute Time | # Commuters | % Commuters |
| Less than 5 Minutes | 62 | 23.7% |
| 5 to 9 Minutes | 34 | 13.0% |
| 10 to 14 Minutes | 6 | 2.3% |
| 15 to 19 Minutes | 0 | 0.0% |
| 20 to 24 Minutes | 15 | 5.8% |
| 25 to 29 Minutes | 0 | 0.0% |
| 30 to 34 Minutes | 29 | 11.1% |
| 35 to 39 Minutes | 4 | 1.5% |
| 40 to 44 Minutes | 17 | 6.5% |
| 45 to 59 Minutes | 0 | 0.0% |
| 60 to 89 Minutes | 51 | 19.5% |
| 90 or more Minutes | 43 | 16.5% |
Commute Time by Sex in Quilcene
The most common commute times in Quilcene are less than 5 minutes (62 commuters, 33.5%) for males and 5 to 9 minutes (34 commuters, 44.7%) for females.
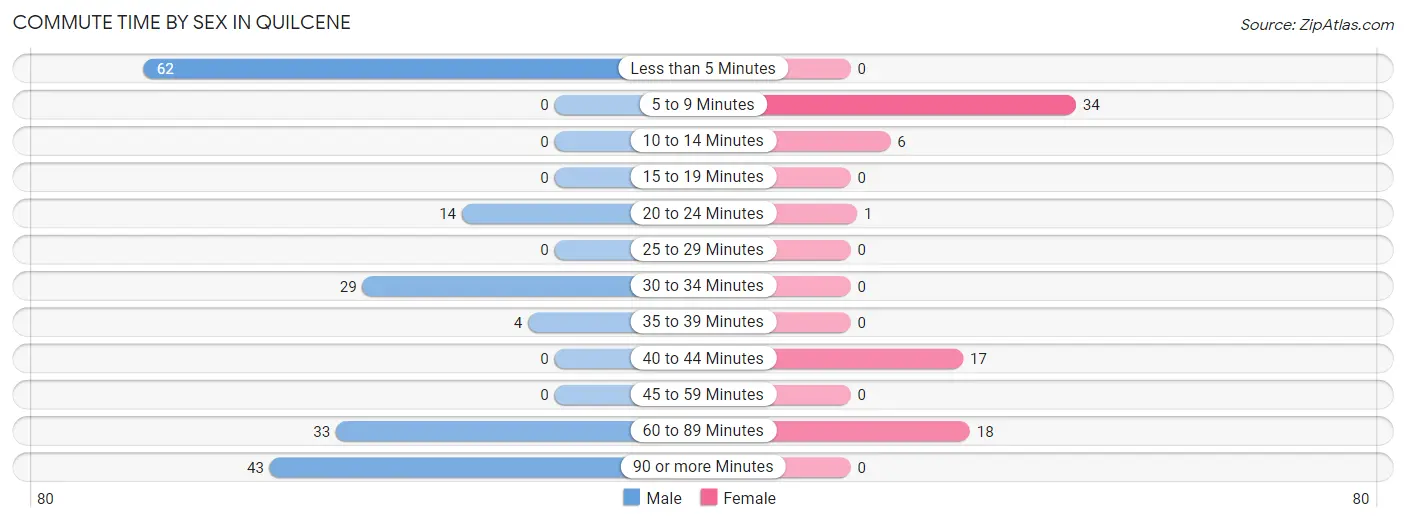
| Commute Time | Male | Female |
| Less than 5 Minutes | 62 (33.5%) | 0 (0.0%) |
| 5 to 9 Minutes | 0 (0.0%) | 34 (44.7%) |
| 10 to 14 Minutes | 0 (0.0%) | 6 (7.9%) |
| 15 to 19 Minutes | 0 (0.0%) | 0 (0.0%) |
| 20 to 24 Minutes | 14 (7.6%) | 1 (1.3%) |
| 25 to 29 Minutes | 0 (0.0%) | 0 (0.0%) |
| 30 to 34 Minutes | 29 (15.7%) | 0 (0.0%) |
| 35 to 39 Minutes | 4 (2.2%) | 0 (0.0%) |
| 40 to 44 Minutes | 0 (0.0%) | 17 (22.4%) |
| 45 to 59 Minutes | 0 (0.0%) | 0 (0.0%) |
| 60 to 89 Minutes | 33 (17.8%) | 18 (23.7%) |
| 90 or more Minutes | 43 (23.2%) | 0 (0.0%) |
Time of Departure to Work by Sex in Quilcene
The most frequent times of departure to work in Quilcene are 6:00 AM to 6:29 AM (67, 36.2%) for males and 6:30 AM to 6:59 AM (25, 32.9%) for females.
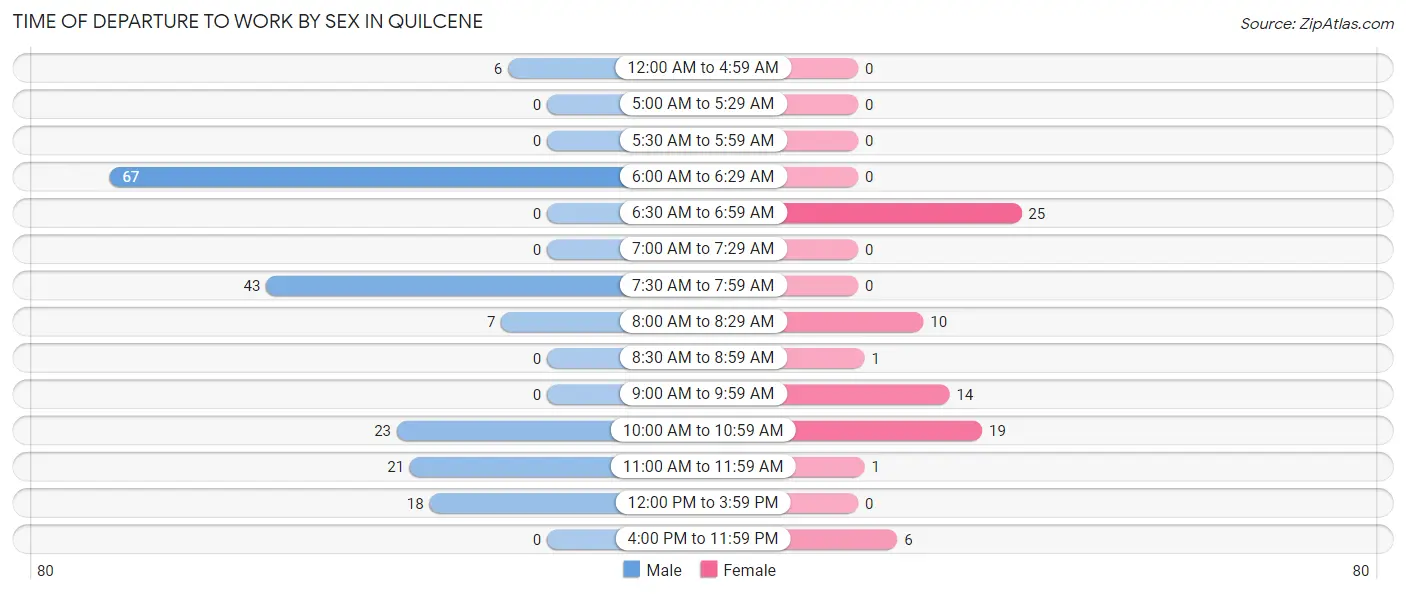
| Time of Departure | Male | Female |
| 12:00 AM to 4:59 AM | 6 (3.2%) | 0 (0.0%) |
| 5:00 AM to 5:29 AM | 0 (0.0%) | 0 (0.0%) |
| 5:30 AM to 5:59 AM | 0 (0.0%) | 0 (0.0%) |
| 6:00 AM to 6:29 AM | 67 (36.2%) | 0 (0.0%) |
| 6:30 AM to 6:59 AM | 0 (0.0%) | 25 (32.9%) |
| 7:00 AM to 7:29 AM | 0 (0.0%) | 0 (0.0%) |
| 7:30 AM to 7:59 AM | 43 (23.2%) | 0 (0.0%) |
| 8:00 AM to 8:29 AM | 7 (3.8%) | 10 (13.2%) |
| 8:30 AM to 8:59 AM | 0 (0.0%) | 1 (1.3%) |
| 9:00 AM to 9:59 AM | 0 (0.0%) | 14 (18.4%) |
| 10:00 AM to 10:59 AM | 23 (12.4%) | 19 (25.0%) |
| 11:00 AM to 11:59 AM | 21 (11.4%) | 1 (1.3%) |
| 12:00 PM to 3:59 PM | 18 (9.7%) | 0 (0.0%) |
| 4:00 PM to 11:59 PM | 0 (0.0%) | 6 (7.9%) |
| Total | 185 (100.0%) | 76 (100.0%) |
Housing Occupancy in Quilcene
Occupancy by Ownership in Quilcene
Of the total 256 dwellings in Quilcene, owner-occupied units account for 184 (71.9%), while renter-occupied units make up 72 (28.1%).
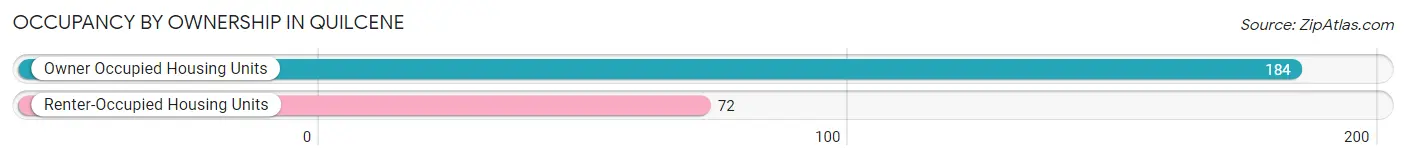
| Occupancy | # Housing Units | % Housing Units |
| Owner Occupied Housing Units | 184 | 71.9% |
| Renter-Occupied Housing Units | 72 | 28.1% |
| Total Occupied Housing Units | 256 | 100.0% |
Occupancy by Household Size in Quilcene
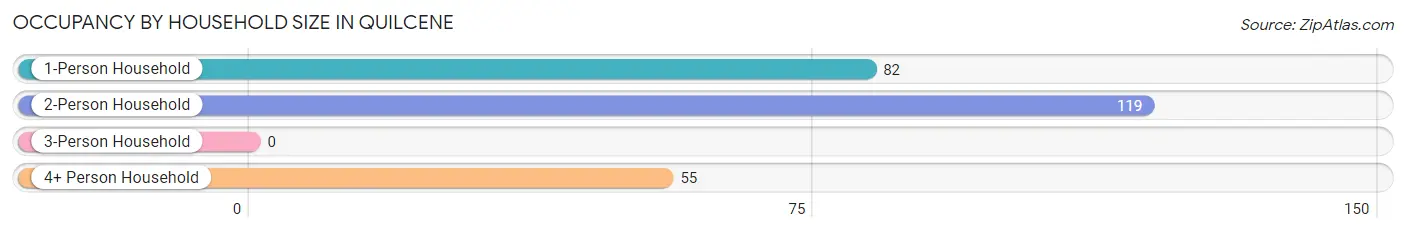
| Household Size | # Housing Units | % Housing Units |
| 1-Person Household | 82 | 32.0% |
| 2-Person Household | 119 | 46.5% |
| 3-Person Household | 0 | 0.0% |
| 4+ Person Household | 55 | 21.5% |
| Total Housing Units | 256 | 100.0% |
Occupancy by Ownership by Household Size in Quilcene
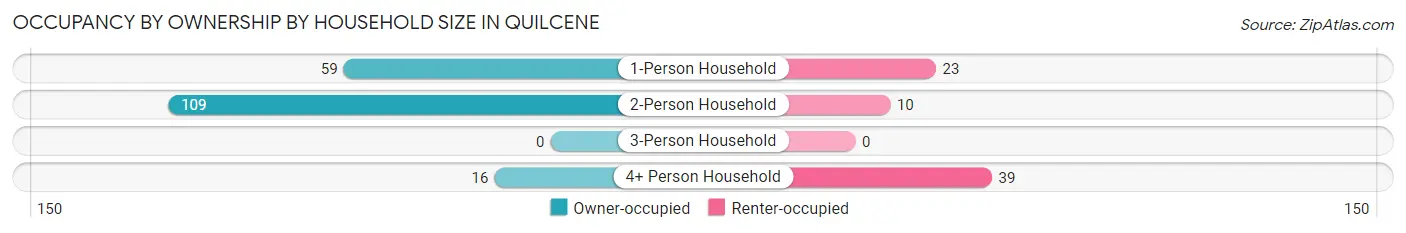
| Household Size | Owner-occupied | Renter-occupied |
| 1-Person Household | 59 (72.0%) | 23 (28.1%) |
| 2-Person Household | 109 (91.6%) | 10 (8.4%) |
| 3-Person Household | 0 (0.0%) | 0 (0.0%) |
| 4+ Person Household | 16 (29.1%) | 39 (70.9%) |
| Total Housing Units | 184 (71.9%) | 72 (28.1%) |
Occupancy by Educational Attainment in Quilcene
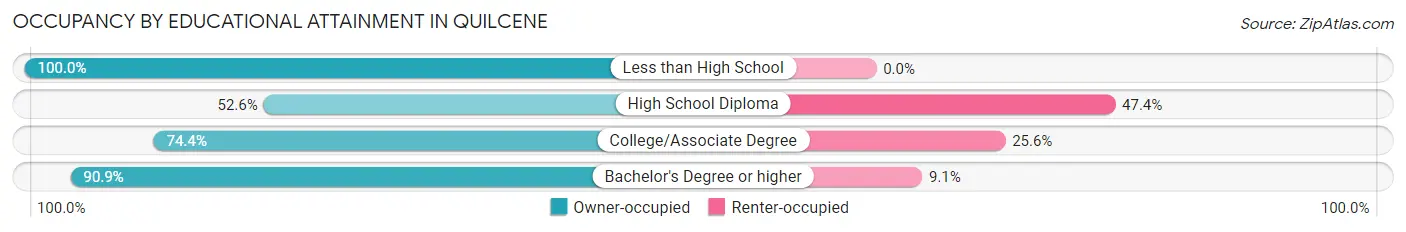
| Household Size | Owner-occupied | Renter-occupied |
| Less than High School | 20 (100.0%) | 0 (0.0%) |
| High School Diploma | 50 (52.6%) | 45 (47.4%) |
| College/Associate Degree | 64 (74.4%) | 22 (25.6%) |
| Bachelor's Degree or higher | 50 (90.9%) | 5 (9.1%) |
Occupancy by Age of Householder in Quilcene
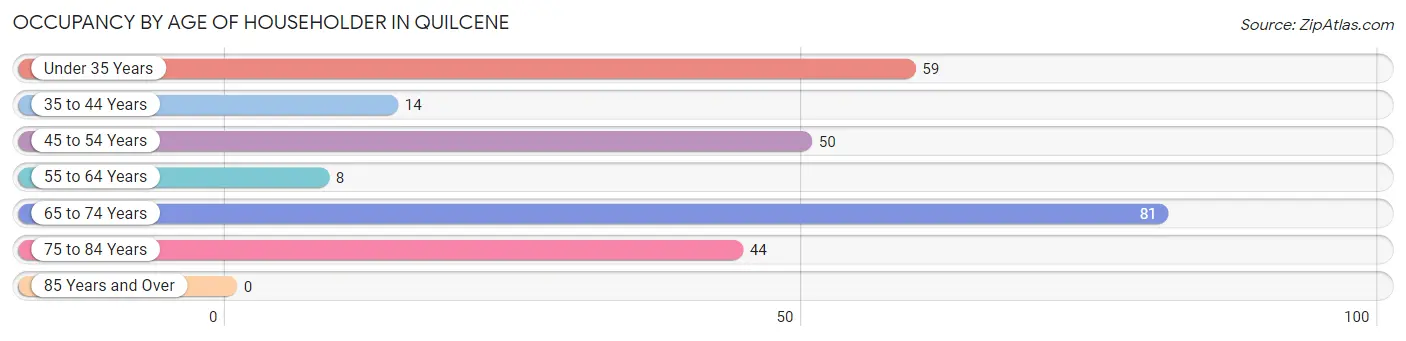
| Age Bracket | # Households | % Households |
| Under 35 Years | 59 | 23.1% |
| 35 to 44 Years | 14 | 5.5% |
| 45 to 54 Years | 50 | 19.5% |
| 55 to 64 Years | 8 | 3.1% |
| 65 to 74 Years | 81 | 31.6% |
| 75 to 84 Years | 44 | 17.2% |
| 85 Years and Over | 0 | 0.0% |
| Total | 256 | 100.0% |
Housing Finances in Quilcene
Median Income by Occupancy in Quilcene
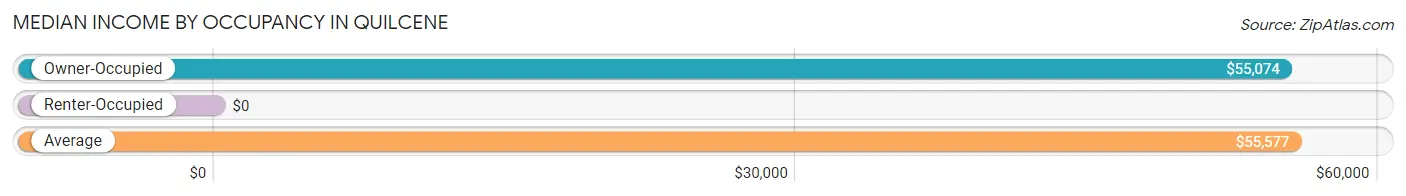
| Occupancy Type | # Households | Median Income |
| Owner-Occupied | 184 (71.9%) | $55,074 |
| Renter-Occupied | 72 (28.1%) | $0 |
| Average | 256 (100.0%) | $55,577 |
Occupancy by Householder Income Bracket in Quilcene
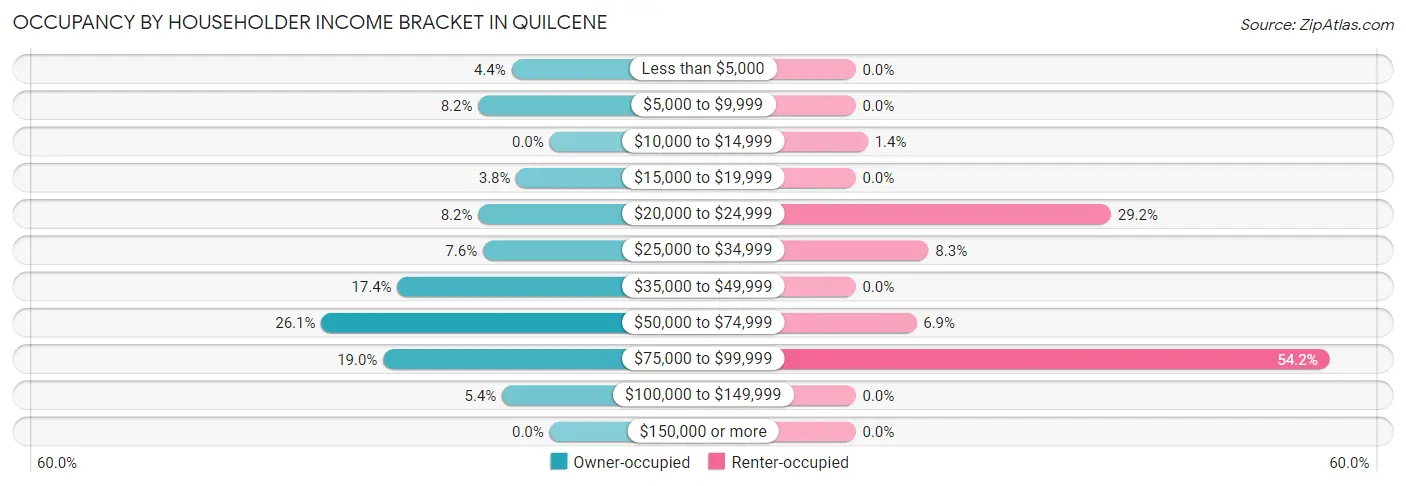
| Income Bracket | Owner-occupied | Renter-occupied |
| Less than $5,000 | 8 (4.3%) | 0 (0.0%) |
| $5,000 to $9,999 | 15 (8.2%) | 0 (0.0%) |
| $10,000 to $14,999 | 0 (0.0%) | 1 (1.4%) |
| $15,000 to $19,999 | 7 (3.8%) | 0 (0.0%) |
| $20,000 to $24,999 | 15 (8.2%) | 21 (29.2%) |
| $25,000 to $34,999 | 14 (7.6%) | 6 (8.3%) |
| $35,000 to $49,999 | 32 (17.4%) | 0 (0.0%) |
| $50,000 to $74,999 | 48 (26.1%) | 5 (6.9%) |
| $75,000 to $99,999 | 35 (19.0%) | 39 (54.2%) |
| $100,000 to $149,999 | 10 (5.4%) | 0 (0.0%) |
| $150,000 or more | 0 (0.0%) | 0 (0.0%) |
| Total | 184 (100.0%) | 72 (100.0%) |
Monthly Housing Cost Tiers in Quilcene
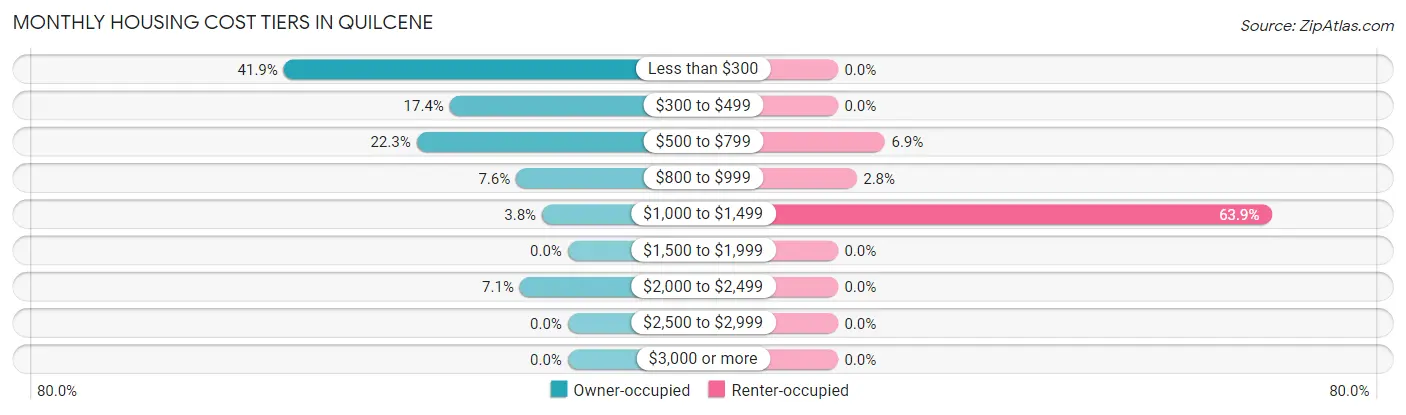
| Monthly Cost | Owner-occupied | Renter-occupied |
| Less than $300 | 77 (41.8%) | 0 (0.0%) |
| $300 to $499 | 32 (17.4%) | 0 (0.0%) |
| $500 to $799 | 41 (22.3%) | 5 (6.9%) |
| $800 to $999 | 14 (7.6%) | 2 (2.8%) |
| $1,000 to $1,499 | 7 (3.8%) | 46 (63.9%) |
| $1,500 to $1,999 | 0 (0.0%) | 0 (0.0%) |
| $2,000 to $2,499 | 13 (7.1%) | 0 (0.0%) |
| $2,500 to $2,999 | 0 (0.0%) | 0 (0.0%) |
| $3,000 or more | 0 (0.0%) | 0 (0.0%) |
| Total | 184 (100.0%) | 72 (100.0%) |
Physical Housing Characteristics in Quilcene
Housing Structures in Quilcene
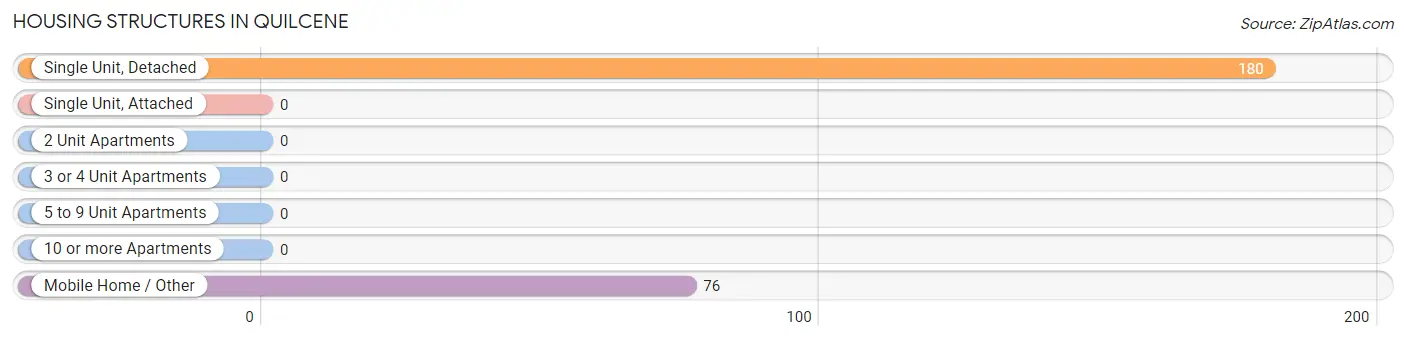
| Structure Type | # Housing Units | % Housing Units |
| Single Unit, Detached | 180 | 70.3% |
| Single Unit, Attached | 0 | 0.0% |
| 2 Unit Apartments | 0 | 0.0% |
| 3 or 4 Unit Apartments | 0 | 0.0% |
| 5 to 9 Unit Apartments | 0 | 0.0% |
| 10 or more Apartments | 0 | 0.0% |
| Mobile Home / Other | 76 | 29.7% |
| Total | 256 | 100.0% |
Housing Structures by Occupancy in Quilcene
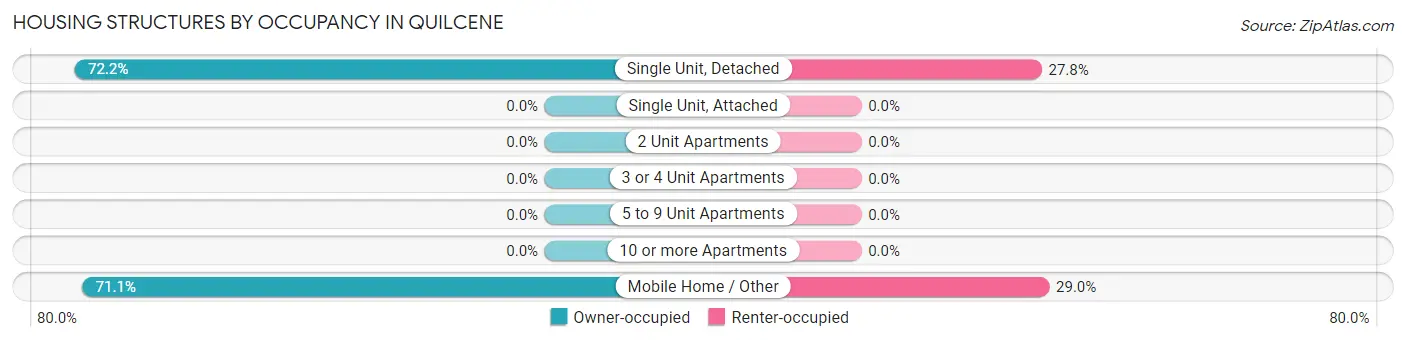
| Structure Type | Owner-occupied | Renter-occupied |
| Single Unit, Detached | 130 (72.2%) | 50 (27.8%) |
| Single Unit, Attached | 0 (0.0%) | 0 (0.0%) |
| 2 Unit Apartments | 0 (0.0%) | 0 (0.0%) |
| 3 or 4 Unit Apartments | 0 (0.0%) | 0 (0.0%) |
| 5 to 9 Unit Apartments | 0 (0.0%) | 0 (0.0%) |
| 10 or more Apartments | 0 (0.0%) | 0 (0.0%) |
| Mobile Home / Other | 54 (71.1%) | 22 (28.9%) |
| Total | 184 (71.9%) | 72 (28.1%) |
Housing Structures by Number of Rooms in Quilcene
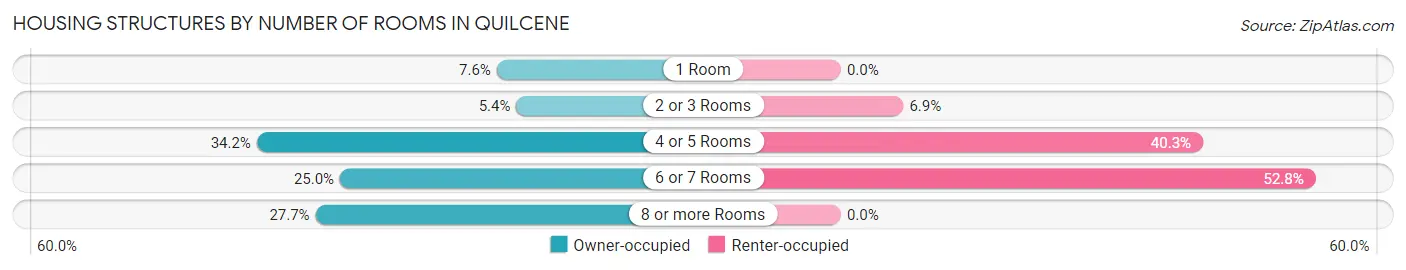
| Number of Rooms | Owner-occupied | Renter-occupied |
| 1 Room | 14 (7.6%) | 0 (0.0%) |
| 2 or 3 Rooms | 10 (5.4%) | 5 (6.9%) |
| 4 or 5 Rooms | 63 (34.2%) | 29 (40.3%) |
| 6 or 7 Rooms | 46 (25.0%) | 38 (52.8%) |
| 8 or more Rooms | 51 (27.7%) | 0 (0.0%) |
| Total | 184 (100.0%) | 72 (100.0%) |
Housing Structure by Heating Type in Quilcene
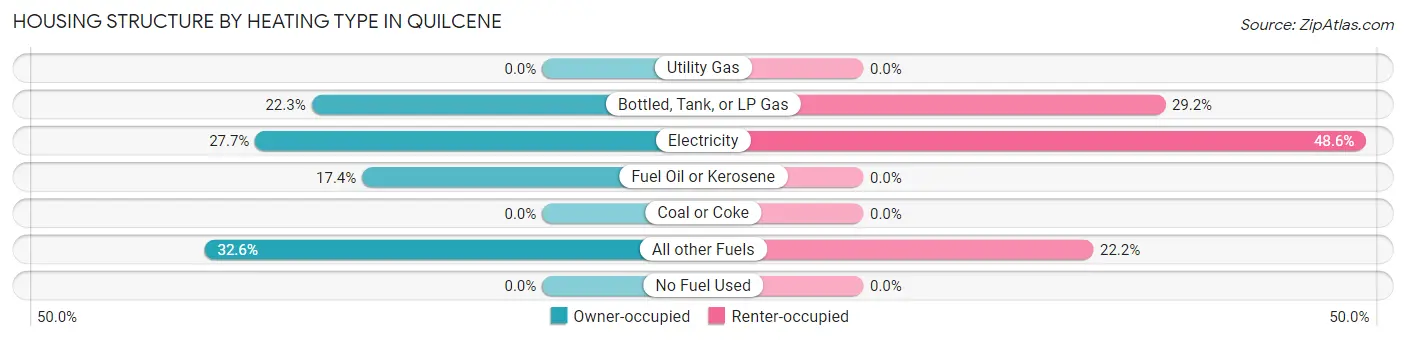
| Heating Type | Owner-occupied | Renter-occupied |
| Utility Gas | 0 (0.0%) | 0 (0.0%) |
| Bottled, Tank, or LP Gas | 41 (22.3%) | 21 (29.2%) |
| Electricity | 51 (27.7%) | 35 (48.6%) |
| Fuel Oil or Kerosene | 32 (17.4%) | 0 (0.0%) |
| Coal or Coke | 0 (0.0%) | 0 (0.0%) |
| All other Fuels | 60 (32.6%) | 16 (22.2%) |
| No Fuel Used | 0 (0.0%) | 0 (0.0%) |
| Total | 184 (100.0%) | 72 (100.0%) |
Household Vehicle Usage in Quilcene
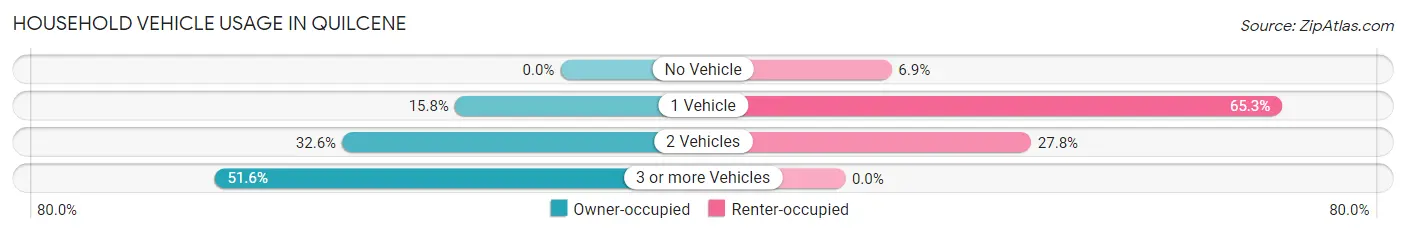
| Vehicles per Household | Owner-occupied | Renter-occupied |
| No Vehicle | 0 (0.0%) | 5 (6.9%) |
| 1 Vehicle | 29 (15.8%) | 47 (65.3%) |
| 2 Vehicles | 60 (32.6%) | 20 (27.8%) |
| 3 or more Vehicles | 95 (51.6%) | 0 (0.0%) |
| Total | 184 (100.0%) | 72 (100.0%) |
Real Estate & Mortgages in Quilcene
Real Estate and Mortgage Overview in Quilcene
| Characteristic | Without Mortgage | With Mortgage |
| Housing Units | 145 | 39 |
| Median Property Value | $272,800 | $457,700 |
| Median Household Income | $49,375 | $0 |
| Monthly Housing Costs | $292 | $0 |
| Real Estate Taxes | $1,237 | $5 |
Property Value by Mortgage Status in Quilcene
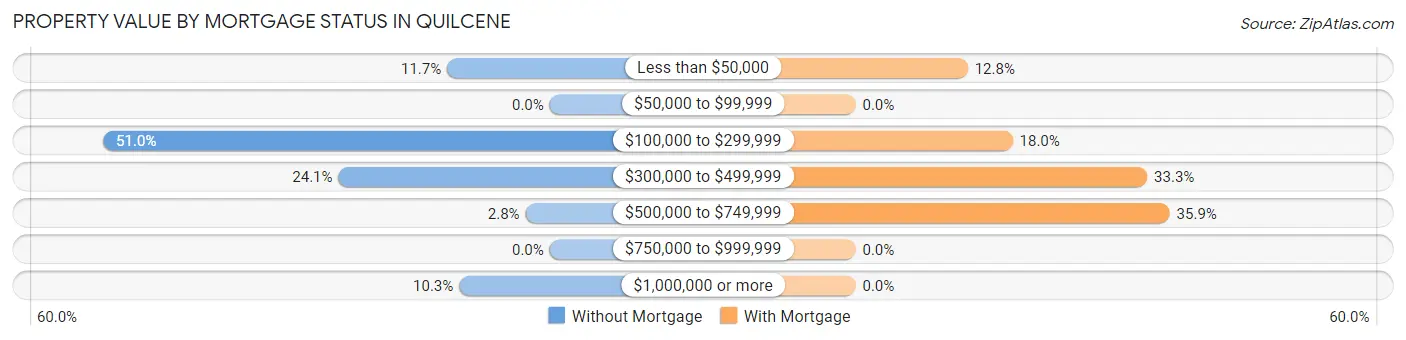
| Property Value | Without Mortgage | With Mortgage |
| Less than $50,000 | 17 (11.7%) | 5 (12.8%) |
| $50,000 to $99,999 | 0 (0.0%) | 0 (0.0%) |
| $100,000 to $299,999 | 74 (51.0%) | 7 (17.9%) |
| $300,000 to $499,999 | 35 (24.1%) | 13 (33.3%) |
| $500,000 to $749,999 | 4 (2.8%) | 14 (35.9%) |
| $750,000 to $999,999 | 0 (0.0%) | 0 (0.0%) |
| $1,000,000 or more | 15 (10.3%) | 0 (0.0%) |
| Total | 145 (100.0%) | 39 (100.0%) |
Household Income by Mortgage Status in Quilcene
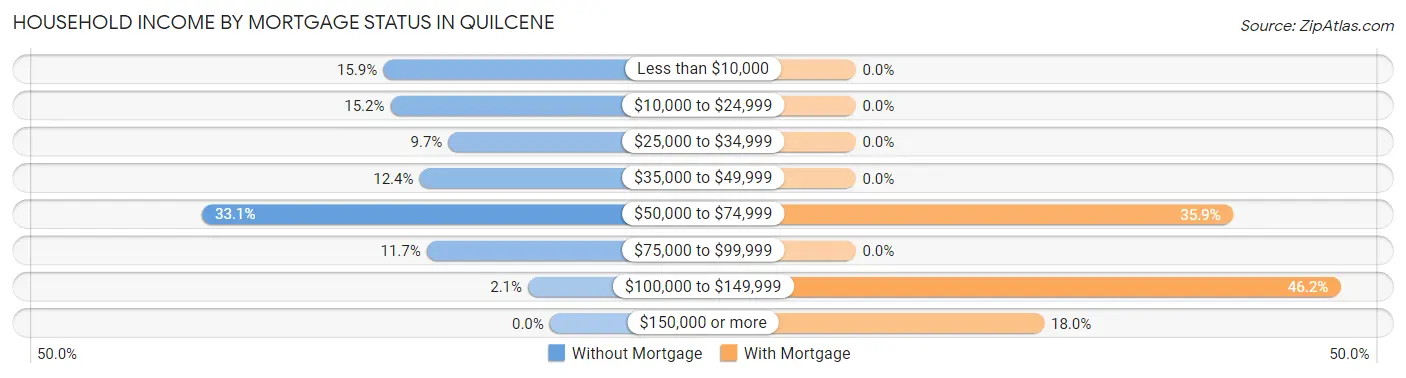
| Household Income | Without Mortgage | With Mortgage |
| Less than $10,000 | 23 (15.9%) | 0 (0.0%) |
| $10,000 to $24,999 | 22 (15.2%) | 0 (0.0%) |
| $25,000 to $34,999 | 14 (9.7%) | 0 (0.0%) |
| $35,000 to $49,999 | 18 (12.4%) | 0 (0.0%) |
| $50,000 to $74,999 | 48 (33.1%) | 14 (35.9%) |
| $75,000 to $99,999 | 17 (11.7%) | 0 (0.0%) |
| $100,000 to $149,999 | 3 (2.1%) | 18 (46.2%) |
| $150,000 or more | 0 (0.0%) | 7 (17.9%) |
| Total | 145 (100.0%) | 39 (100.0%) |
Property Value to Household Income Ratio in Quilcene
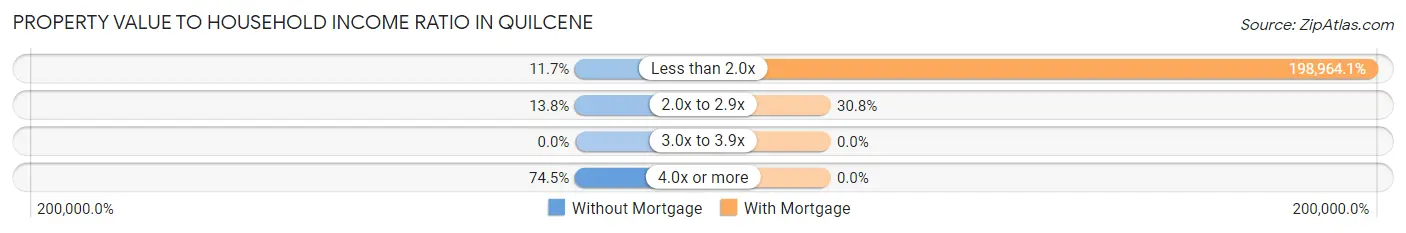
| Value-to-Income Ratio | Without Mortgage | With Mortgage |
| Less than 2.0x | 17 (11.7%) | 77,596 (198,964.1%) |
| 2.0x to 2.9x | 20 (13.8%) | 12 (30.8%) |
| 3.0x to 3.9x | 0 (0.0%) | 0 (0.0%) |
| 4.0x or more | 108 (74.5%) | 0 (0.0%) |
| Total | 145 (100.0%) | 39 (100.0%) |
Real Estate Taxes by Mortgage Status in Quilcene
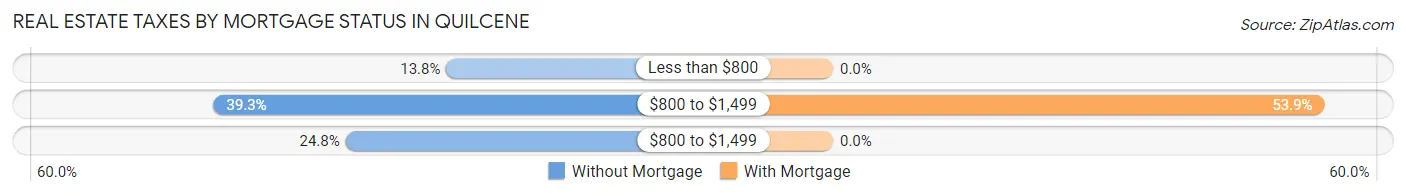
| Property Taxes | Without Mortgage | With Mortgage |
| Less than $800 | 20 (13.8%) | 0 (0.0%) |
| $800 to $1,499 | 57 (39.3%) | 21 (53.8%) |
| $800 to $1,499 | 36 (24.8%) | 0 (0.0%) |
| Total | 145 (100.0%) | 39 (100.0%) |
Health & Disability in Quilcene
Health Insurance Coverage by Age in Quilcene
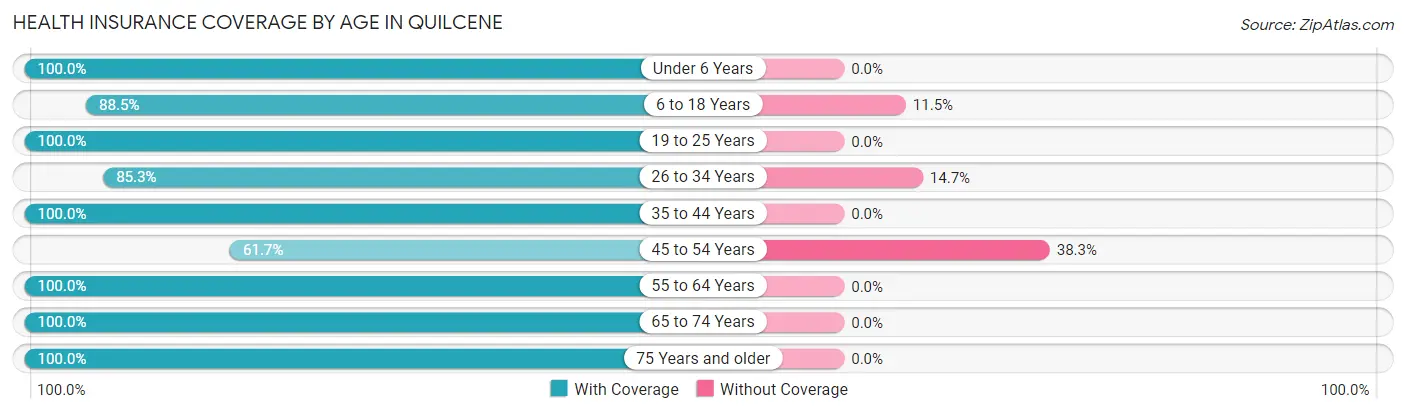
| Age Bracket | With Coverage | Without Coverage |
| Under 6 Years | 16 (100.0%) | 0 (0.0%) |
| 6 to 18 Years | 77 (88.5%) | 10 (11.5%) |
| 19 to 25 Years | 45 (100.0%) | 0 (0.0%) |
| 26 to 34 Years | 99 (85.3%) | 17 (14.7%) |
| 35 to 44 Years | 43 (100.0%) | 0 (0.0%) |
| 45 to 54 Years | 37 (61.7%) | 23 (38.3%) |
| 55 to 64 Years | 37 (100.0%) | 0 (0.0%) |
| 65 to 74 Years | 125 (100.0%) | 0 (0.0%) |
| 75 Years and older | 81 (100.0%) | 0 (0.0%) |
| Total | 560 (91.8%) | 50 (8.2%) |
Health Insurance Coverage by Citizenship Status in Quilcene
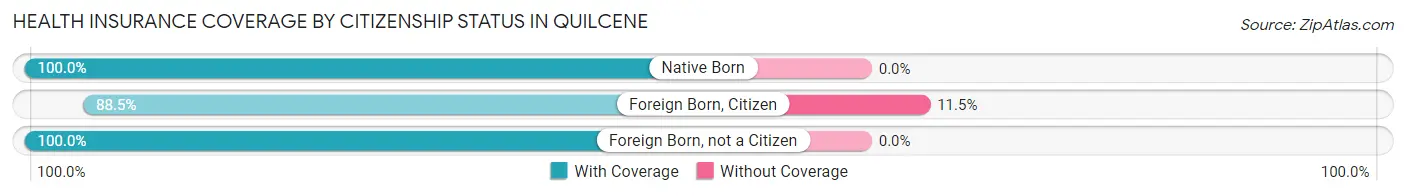
| Citizenship Status | With Coverage | Without Coverage |
| Native Born | 16 (100.0%) | 0 (0.0%) |
| Foreign Born, Citizen | 77 (88.5%) | 10 (11.5%) |
| Foreign Born, not a Citizen | 45 (100.0%) | 0 (0.0%) |
Health Insurance Coverage by Household Income in Quilcene
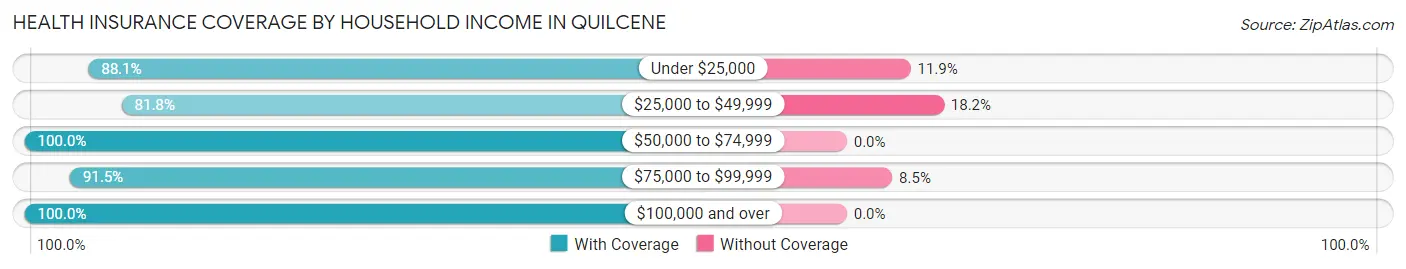
| Household Income | With Coverage | Without Coverage |
| Under $25,000 | 59 (88.1%) | 8 (11.9%) |
| $25,000 to $49,999 | 72 (81.8%) | 16 (18.2%) |
| $50,000 to $74,999 | 106 (100.0%) | 0 (0.0%) |
| $75,000 to $99,999 | 280 (91.5%) | 26 (8.5%) |
| $100,000 and over | 43 (100.0%) | 0 (0.0%) |
Public vs Private Health Insurance Coverage by Age in Quilcene
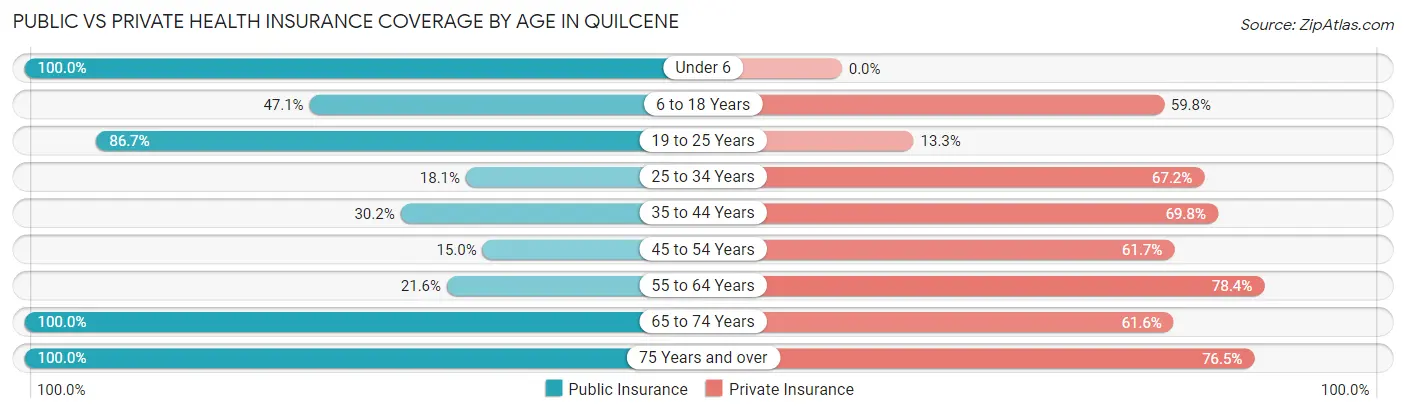
| Age Bracket | Public Insurance | Private Insurance |
| Under 6 | 16 (100.0%) | 0 (0.0%) |
| 6 to 18 Years | 41 (47.1%) | 52 (59.8%) |
| 19 to 25 Years | 39 (86.7%) | 6 (13.3%) |
| 25 to 34 Years | 21 (18.1%) | 78 (67.2%) |
| 35 to 44 Years | 13 (30.2%) | 30 (69.8%) |
| 45 to 54 Years | 9 (15.0%) | 37 (61.7%) |
| 55 to 64 Years | 8 (21.6%) | 29 (78.4%) |
| 65 to 74 Years | 125 (100.0%) | 77 (61.6%) |
| 75 Years and over | 81 (100.0%) | 62 (76.5%) |
| Total | 353 (57.9%) | 371 (60.8%) |
Disability Status by Sex by Age in Quilcene

| Age Bracket | Male | Female |
| Under 5 Years | 0 (0.0%) | 0 (0.0%) |
| 5 to 17 Years | 0 (0.0%) | 0 (0.0%) |
| 18 to 34 Years | 0 (0.0%) | 0 (0.0%) |
| 35 to 64 Years | 0 (0.0%) | 0 (0.0%) |
| 65 to 74 Years | 14 (41.2%) | 19 (20.9%) |
| 75 Years and over | 18 (29.0%) | 0 (0.0%) |
Disability Class by Sex by Age in Quilcene
Disability Class: Hearing Difficulty
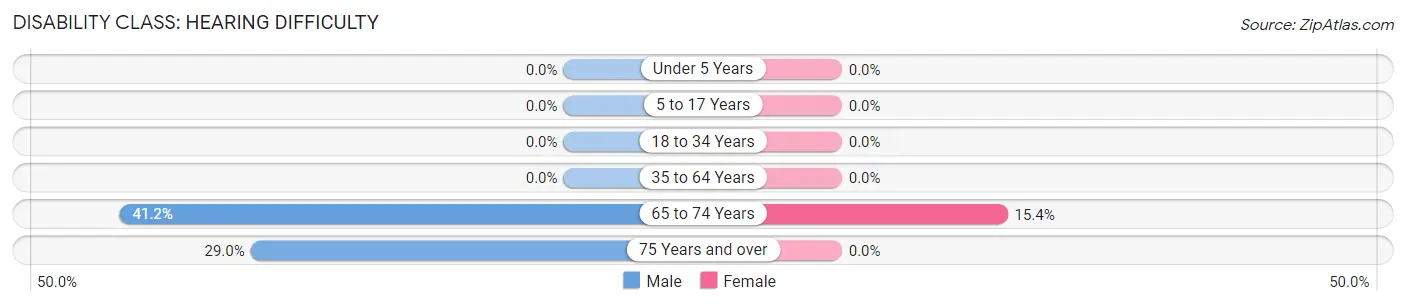
| Age Bracket | Male | Female |
| Under 5 Years | 0 (0.0%) | 0 (0.0%) |
| 5 to 17 Years | 0 (0.0%) | 0 (0.0%) |
| 18 to 34 Years | 0 (0.0%) | 0 (0.0%) |
| 35 to 64 Years | 0 (0.0%) | 0 (0.0%) |
| 65 to 74 Years | 14 (41.2%) | 14 (15.4%) |
| 75 Years and over | 18 (29.0%) | 0 (0.0%) |
Disability Class: Vision Difficulty
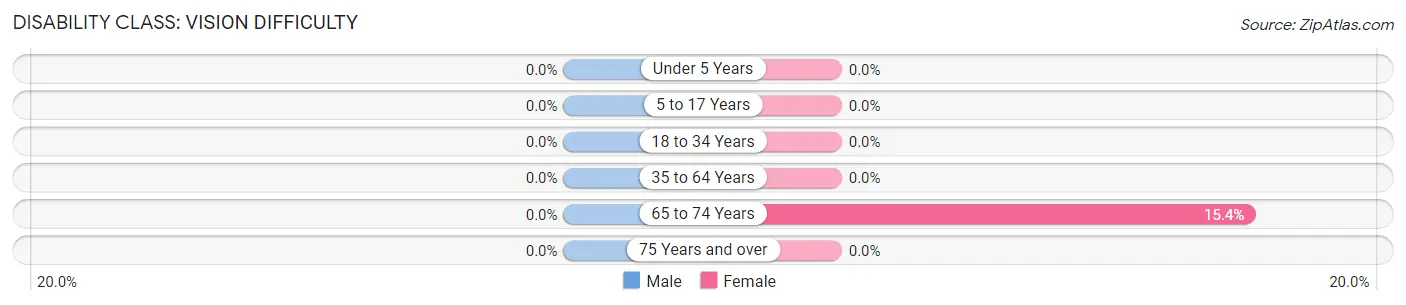
| Age Bracket | Male | Female |
| Under 5 Years | 0 (0.0%) | 0 (0.0%) |
| 5 to 17 Years | 0 (0.0%) | 0 (0.0%) |
| 18 to 34 Years | 0 (0.0%) | 0 (0.0%) |
| 35 to 64 Years | 0 (0.0%) | 0 (0.0%) |
| 65 to 74 Years | 0 (0.0%) | 14 (15.4%) |
| 75 Years and over | 0 (0.0%) | 0 (0.0%) |
Disability Class: Cognitive Difficulty
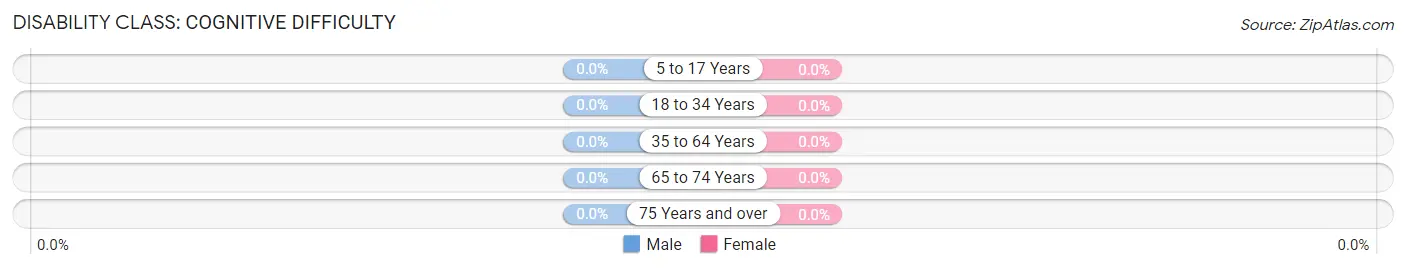
| Age Bracket | Male | Female |
| 5 to 17 Years | 0 (0.0%) | 0 (0.0%) |
| 18 to 34 Years | 0 (0.0%) | 0 (0.0%) |
| 35 to 64 Years | 0 (0.0%) | 0 (0.0%) |
| 65 to 74 Years | 0 (0.0%) | 0 (0.0%) |
| 75 Years and over | 0 (0.0%) | 0 (0.0%) |
Disability Class: Ambulatory Difficulty
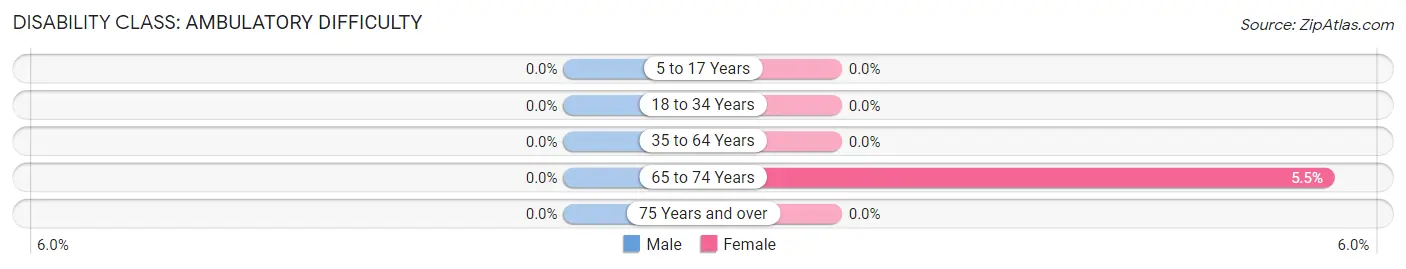
| Age Bracket | Male | Female |
| 5 to 17 Years | 0 (0.0%) | 0 (0.0%) |
| 18 to 34 Years | 0 (0.0%) | 0 (0.0%) |
| 35 to 64 Years | 0 (0.0%) | 0 (0.0%) |
| 65 to 74 Years | 0 (0.0%) | 5 (5.5%) |
| 75 Years and over | 0 (0.0%) | 0 (0.0%) |
Disability Class: Self-Care Difficulty
| Age Bracket | Male | Female |
| 5 to 17 Years | 0 (0.0%) | 0 (0.0%) |
| 18 to 34 Years | 0 (0.0%) | 0 (0.0%) |
| 35 to 64 Years | 0 (0.0%) | 0 (0.0%) |
| 65 to 74 Years | 0 (0.0%) | 0 (0.0%) |
| 75 Years and over | 0 (0.0%) | 0 (0.0%) |
Technology Access in Quilcene
Computing Device Access in Quilcene
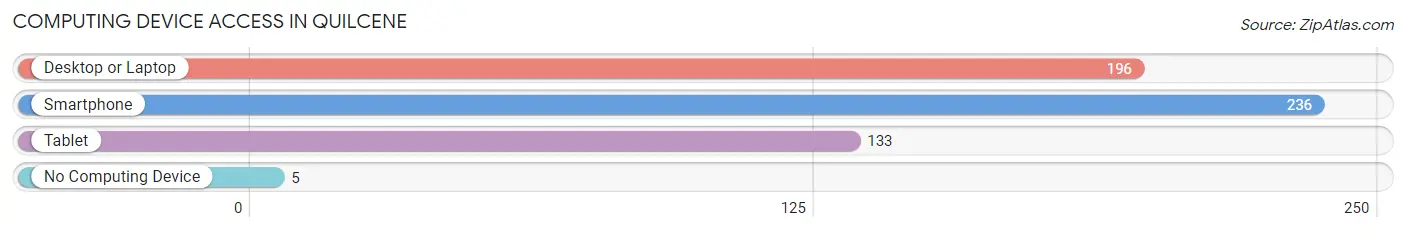
| Device Type | # Households | % Households |
| Desktop or Laptop | 196 | 76.6% |
| Smartphone | 236 | 92.2% |
| Tablet | 133 | 51.9% |
| No Computing Device | 5 | 1.9% |
| Total | 256 | 100.0% |
Internet Access in Quilcene
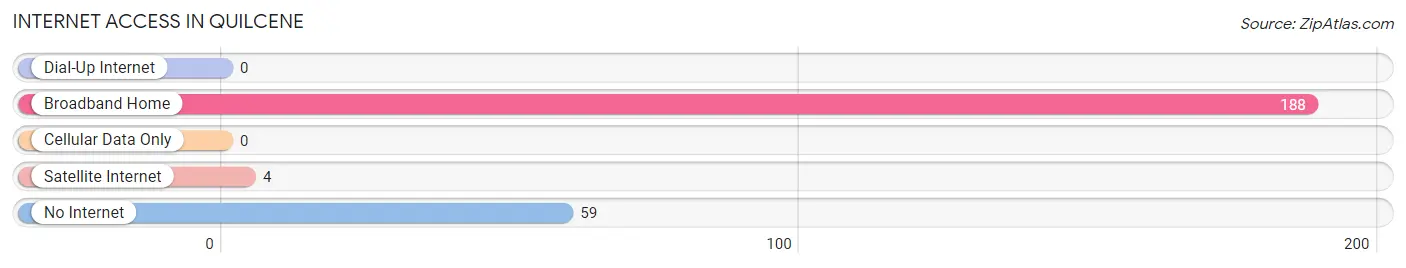
| Internet Type | # Households | % Households |
| Dial-Up Internet | 0 | 0.0% |
| Broadband Home | 188 | 73.4% |
| Cellular Data Only | 0 | 0.0% |
| Satellite Internet | 4 | 1.6% |
| No Internet | 59 | 23.1% |
| Total | 256 | 100.0% |
Quilcene Summary
Quilcene is a small town located in the Olympic Peninsula of Washington State, United States. It is situated in the foothills of the Olympic Mountains, about 25 miles (40 km) northwest of the city of Seattle. The population of Quilcene was 1,890 at the 2010 census.
History
The area that is now Quilcene was first inhabited by the Quilcene people, a Native American tribe of the Salishan linguistic family. The Quilcene people lived in the area for thousands of years before the arrival of European settlers in the late 19th century.
The first European settlers arrived in the area in the late 1880s, and the town of Quilcene was officially founded in 1890. The town was named after the Quilcene people, and the name is derived from the Quilcene language, meaning “place of the strong people”.
The town quickly grew in size and importance, and by the early 20th century it was a major logging and fishing center. The town was also home to a large salmon cannery, which operated until the 1950s.
Geography
Quilcene is located in the foothills of the Olympic Mountains, about 25 miles (40 km) northwest of the city of Seattle. The town is situated on the Quilcene River, which flows into the Hood Canal. The town is surrounded by forests and mountains, and is close to several popular outdoor recreation areas, including Olympic National Park and the Olympic National Forest.
The climate in Quilcene is mild and temperate, with warm summers and cool winters. The average annual temperature is around 50°F (10°C).
Economy
The economy of Quilcene is largely based on tourism and outdoor recreation. The town is a popular destination for hikers, campers, and other outdoor enthusiasts, and is home to several popular attractions, including the Quilcene Historical Museum and the Quilcene Oyster Farm.
The town is also home to several small businesses, including restaurants, cafes, and shops. The local economy is also supported by the nearby Hood Canal Salmon Hatchery, which provides jobs for many local residents.
Demographics
As of the 2010 census, the population of Quilcene was 1,890. The racial makeup of the town was 94.3% White, 0.7% African American, 0.7% Native American, 0.7% Asian, 0.2% Pacific Islander, 0.7% from other races, and 2.5% from two or more races. Hispanic or Latino of any race were 3.2% of the population.
The median household income in Quilcene was $41,250, and the median family income was $48,750. The per capita income for the town was $20,945. About 11.2% of families and 14.2% of the population were below the poverty line, including 18.2% of those under age 18 and 8.3% of those age 65 or over.
Common Questions
What is Per Capita Income in Quilcene?
Per Capita income in Quilcene is $25,680.
What is the Median Family Income in Quilcene?
Median Family Income in Quilcene is $66,429.
What is the Median Household income in Quilcene?
Median Household Income in Quilcene is $55,577.
What is Inequality or Gini Index in Quilcene?
Inequality or Gini Index in Quilcene is 0.32.
What is the Total Population of Quilcene?
Total Population of Quilcene is 610.
What is the Total Male Population of Quilcene?
Total Male Population of Quilcene is 343.
What is the Total Female Population of Quilcene?
Total Female Population of Quilcene is 267.
What is the Ratio of Males per 100 Females in Quilcene?
There are 128.46 Males per 100 Females in Quilcene.
What is the Ratio of Females per 100 Males in Quilcene?
There are 77.84 Females per 100 Males in Quilcene.
What is the Median Population Age in Quilcene?
Median Population Age in Quilcene is 38.9 Years.
What is the Average Family Size in Quilcene
Average Family Size in Quilcene is 2.8 People.
What is the Average Household Size in Quilcene
Average Household Size in Quilcene is 2.4 People.
How Large is the Labor Force in Quilcene?
There are 342 People in the Labor Forcein in Quilcene.
What is the Percentage of People in the Labor Force in Quilcene?
62.9% of People are in the Labor Force in Quilcene.
What is the Unemployment Rate in Quilcene?
Unemployment Rate in Quilcene is 7.3%.