Cities with the Highest Percentage of Moroccan Population in Washington
RELATED REPORTS & OPTIONS
Moroccan
Washington
Compare Cities
Map of Cities with the Highest Percentage of Moroccan Population in Washington
0.00%
1.00%
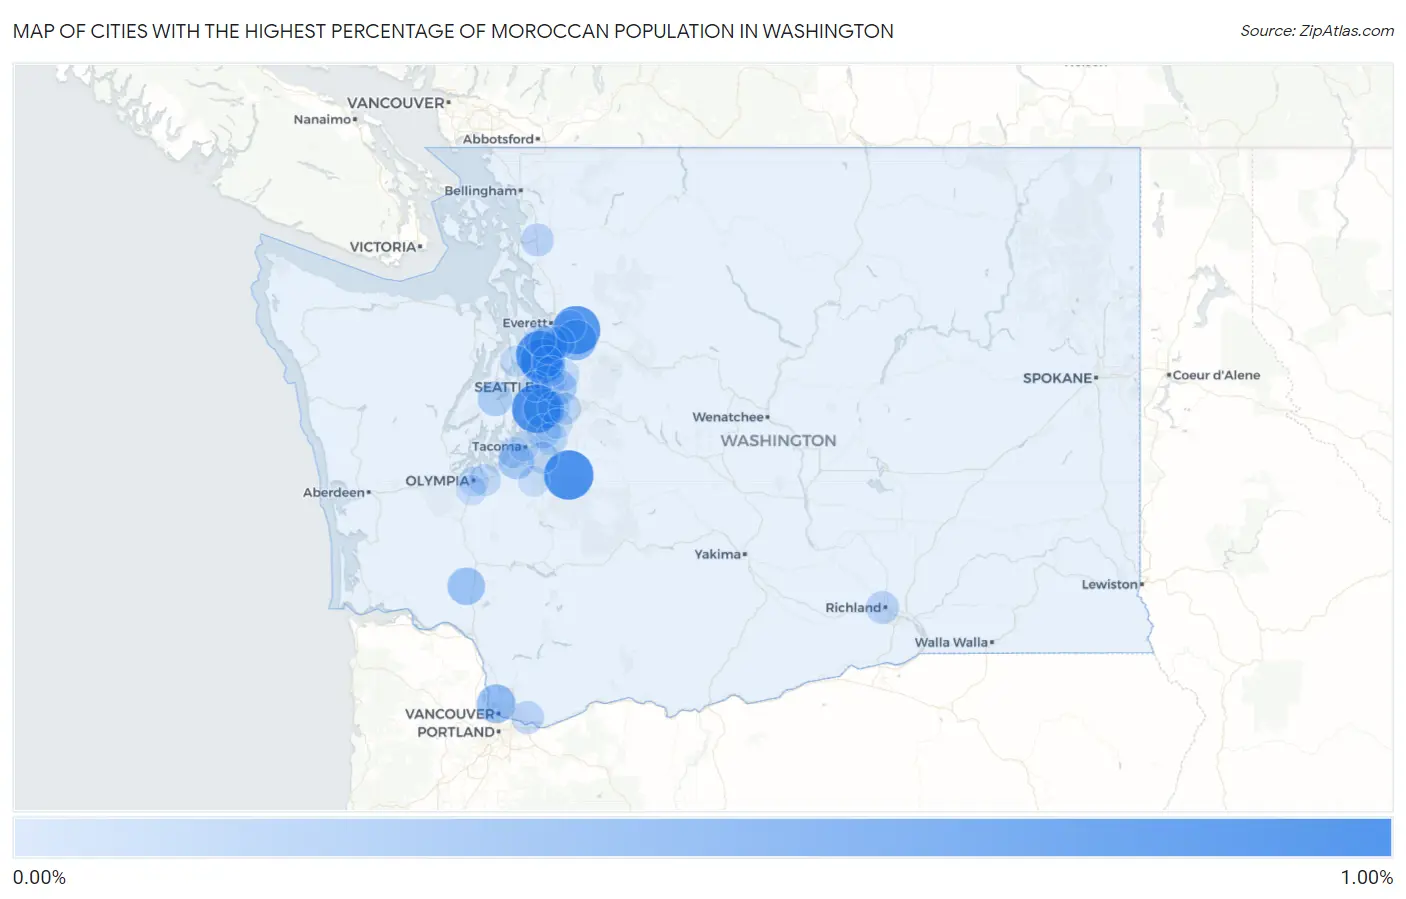
Cities with the Highest Percentage of Moroccan Population in Washington
| City | Moroccan | vs State | vs National | |
| 1. | Carbonado | 0.91% | 0.036%(+0.874)#1 | 0.039%(+0.870)#103 |
| 2. | Burien | 0.86% | 0.036%(+0.828)#2 | 0.039%(+0.825)#111 |
| 3. | Three Lakes | 0.84% | 0.036%(+0.805)#3 | 0.039%(+0.801)#117 |
| 4. | Mountlake Terrace | 0.83% | 0.036%(+0.793)#4 | 0.039%(+0.790)#118 |
| 5. | Lake Forest Park | 0.69% | 0.036%(+0.655)#5 | 0.039%(+0.651)#157 |
| 6. | Monroe North | 0.48% | 0.036%(+0.443)#6 | 0.039%(+0.439)#225 |
| 7. | Tukwila | 0.47% | 0.036%(+0.437)#7 | 0.039%(+0.434)#227 |
| 8. | Lake Shore | 0.39% | 0.036%(+0.359)#8 | 0.039%(+0.355)#275 |
| 9. | Martha Lake | 0.37% | 0.036%(+0.334)#9 | 0.039%(+0.330)#294 |
| 10. | Vader | 0.34% | 0.036%(+0.301)#10 | 0.039%(+0.297)#318 |
| 11. | Lakewood | 0.27% | 0.036%(+0.232)#11 | 0.039%(+0.228)#391 |
| 12. | Bellevue | 0.25% | 0.036%(+0.215)#12 | 0.039%(+0.212)#407 |
| 13. | Bremerton | 0.21% | 0.036%(+0.176)#13 | 0.039%(+0.172)#462 |
| 14. | Lakeland North | 0.19% | 0.036%(+0.152)#14 | 0.039%(+0.148)#511 |
| 15. | Medina | 0.17% | 0.036%(+0.135)#15 | 0.039%(+0.132)#553 |
| 16. | Richland | 0.13% | 0.036%(+0.097)#16 | 0.039%(+0.094)#655 |
| 17. | Camas | 0.13% | 0.036%(+0.093)#17 | 0.039%(+0.089)#667 |
| 18. | Burlington | 0.13% | 0.036%(+0.093)#18 | 0.039%(+0.089)#670 |
| 19. | Silver Firs | 0.11% | 0.036%(+0.072)#19 | 0.039%(+0.069)#741 |
| 20. | Auburn | 0.11% | 0.036%(+0.071)#20 | 0.039%(+0.067)#751 |
| 21. | Renton | 0.098% | 0.036%(+0.062)#21 | 0.039%(+0.058)#780 |
| 22. | East Renton Highlands | 0.091% | 0.036%(+0.055)#22 | 0.039%(+0.052)#806 |
| 23. | Picnic Point | 0.090% | 0.036%(+0.055)#23 | 0.039%(+0.051)#808 |
| 24. | Everett | 0.087% | 0.036%(+0.051)#24 | 0.039%(+0.047)#820 |
| 25. | Puyallup | 0.084% | 0.036%(+0.049)#25 | 0.039%(+0.045)#830 |
| 26. | Lacey | 0.084% | 0.036%(+0.048)#26 | 0.039%(+0.044)#836 |
| 27. | Redmond | 0.069% | 0.036%(+0.034)#27 | 0.039%(+0.030)#894 |
| 28. | Indianola | 0.056% | 0.036%(+0.021)#28 | 0.039%(+0.017)#953 |
| 29. | Fairwood Cdp King County | 0.054% | 0.036%(+0.018)#29 | 0.039%(+0.014)#967 |
| 30. | University Place | 0.052% | 0.036%(+0.016)#30 | 0.039%(+0.012)#978 |
| 31. | Elk Plain | 0.042% | 0.036%(+0.007)#31 | 0.039%(+0.003)#1,053 |
| 32. | Seattle | 0.033% | 0.036%(-0.003)#32 | 0.039%(-0.007)#1,131 |
| 33. | Kenmore | 0.030% | 0.036%(-0.006)#33 | 0.039%(-0.010)#1,159 |
| 34. | Olympia | 0.016% | 0.036%(-0.019)#34 | 0.039%(-0.023)#1,283 |
| 35. | Tumwater | 0.016% | 0.036%(-0.020)#35 | 0.039%(-0.024)#1,294 |
| 36. | Kirkland | 0.015% | 0.036%(-0.020)#36 | 0.039%(-0.024)#1,300 |
| 37. | Kent | 0.013% | 0.036%(-0.022)#37 | 0.039%(-0.026)#1,320 |
| 38. | Tacoma | 0.0078% | 0.036%(-0.028)#38 | 0.039%(-0.032)#1,377 |
Common Questions
What are the Top 10 Cities with the Highest Percentage of Moroccan Population in Washington?
Top 10 Cities with the Highest Percentage of Moroccan Population in Washington are:
#1
0.91%
#2
0.86%
#3
0.84%
#4
0.83%
#5
0.69%
#6
0.48%
#7
0.47%
#8
0.39%
#9
0.37%
#10
0.34%
What city has the Highest Percentage of Moroccan Population in Washington?
Carbonado has the Highest Percentage of Moroccan Population in Washington with 0.91%.
What is the Percentage of Moroccan Population in the State of Washington?
Percentage of Moroccan Population in Washington is 0.036%.
What is the Percentage of Moroccan Population in the United States?
Percentage of Moroccan Population in the United States is 0.039%.