Cities with the Largest Malaysian Community in Washington
RELATED REPORTS & OPTIONS
Malaysian
Washington
Compare Cities
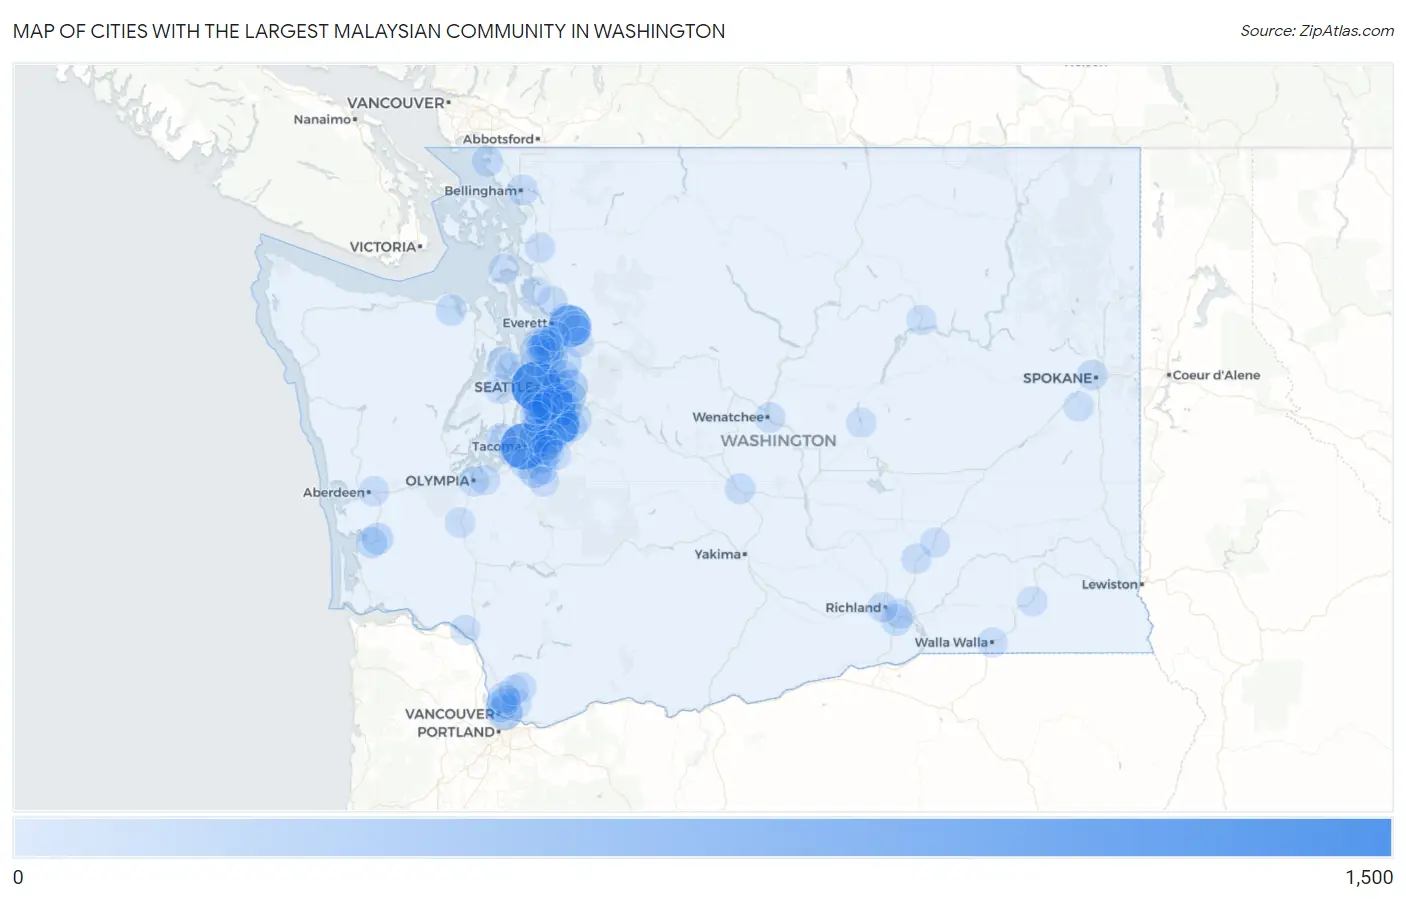
Map of Cities with the Largest Malaysian Community in Washington
0
1,500
Cities with the Largest Malaysian Community in Washington
| City | Malaysian | vs State | vs National | |
| 1. | Seattle | 1,390 | 11,855(11.73%)#1 | 250,948(0.55%)#24 |
| 2. | Tacoma | 1,119 | 11,855(9.44%)#2 | 250,948(0.45%)#33 |
| 3. | Renton | 944 | 11,855(7.96%)#3 | 250,948(0.38%)#46 |
| 4. | Kent | 914 | 11,855(7.71%)#4 | 250,948(0.36%)#48 |
| 5. | Everett | 849 | 11,855(7.16%)#5 | 250,948(0.34%)#54 |
| 6. | Vancouver | 356 | 11,855(3.00%)#6 | 250,948(0.14%)#112 |
| 7. | Bellevue | 273 | 11,855(2.30%)#7 | 250,948(0.11%)#146 |
| 8. | Federal Way | 268 | 11,855(2.26%)#8 | 250,948(0.11%)#149 |
| 9. | Sammamish | 234 | 11,855(1.97%)#9 | 250,948(0.09%)#180 |
| 10. | Frederickson | 210 | 11,855(1.77%)#10 | 250,948(0.08%)#203 |
| 11. | Fairwood Cdp King County | 210 | 11,855(1.77%)#11 | 250,948(0.08%)#204 |
| 12. | Des Moines | 198 | 11,855(1.67%)#12 | 250,948(0.08%)#220 |
| 13. | Algona | 192 | 11,855(1.62%)#13 | 250,948(0.08%)#229 |
| 14. | Mill Creek | 191 | 11,855(1.61%)#14 | 250,948(0.08%)#231 |
| 15. | East Renton Highlands | 191 | 11,855(1.61%)#15 | 250,948(0.08%)#232 |
| 16. | Larch Way | 168 | 11,855(1.42%)#16 | 250,948(0.07%)#258 |
| 17. | Hazel Dell | 162 | 11,855(1.37%)#17 | 250,948(0.06%)#266 |
| 18. | Puyallup | 144 | 11,855(1.21%)#18 | 250,948(0.06%)#291 |
| 19. | Covington | 142 | 11,855(1.20%)#19 | 250,948(0.06%)#293 |
| 20. | Issaquah | 140 | 11,855(1.18%)#20 | 250,948(0.06%)#300 |
| 21. | Kirkland | 119 | 11,855(1.00%)#21 | 250,948(0.05%)#359 |
| 22. | Seatac | 118 | 11,855(1.00%)#22 | 250,948(0.05%)#362 |
| 23. | Raymond | 112 | 11,855(0.94%)#23 | 250,948(0.04%)#383 |
| 24. | Tukwila | 106 | 11,855(0.89%)#24 | 250,948(0.04%)#397 |
| 25. | Parkland | 98 | 11,855(0.83%)#25 | 250,948(0.04%)#423 |
| 26. | South Bend | 93 | 11,855(0.78%)#26 | 250,948(0.04%)#448 |
| 27. | Maple Valley | 92 | 11,855(0.78%)#27 | 250,948(0.04%)#454 |
| 28. | Bryn Mawr Skyway | 92 | 11,855(0.78%)#28 | 250,948(0.04%)#456 |
| 29. | Mount Vista | 92 | 11,855(0.78%)#29 | 250,948(0.04%)#457 |
| 30. | Cottage Lake | 87 | 11,855(0.73%)#30 | 250,948(0.03%)#471 |
| 31. | Auburn | 82 | 11,855(0.69%)#31 | 250,948(0.03%)#491 |
| 32. | Kennewick | 82 | 11,855(0.69%)#32 | 250,948(0.03%)#492 |
| 33. | Hobart | 79 | 11,855(0.67%)#33 | 250,948(0.03%)#511 |
| 34. | Lake Stevens | 77 | 11,855(0.65%)#34 | 250,948(0.03%)#517 |
| 35. | North Lynnwood | 75 | 11,855(0.63%)#35 | 250,948(0.03%)#530 |
| 36. | Poulsbo | 74 | 11,855(0.62%)#36 | 250,948(0.03%)#540 |
| 37. | Picnic Point | 74 | 11,855(0.62%)#37 | 250,948(0.03%)#541 |
| 38. | Bothell | 73 | 11,855(0.62%)#38 | 250,948(0.03%)#550 |
| 39. | Birch Bay | 71 | 11,855(0.60%)#39 | 250,948(0.03%)#561 |
| 40. | Artondale | 69 | 11,855(0.58%)#40 | 250,948(0.03%)#573 |
| 41. | Bell Hill | 67 | 11,855(0.57%)#41 | 250,948(0.03%)#586 |
| 42. | Burien | 59 | 11,855(0.50%)#42 | 250,948(0.02%)#644 |
| 43. | Alderwood Manor | 59 | 11,855(0.50%)#43 | 250,948(0.02%)#650 |
| 44. | Lakeland South | 56 | 11,855(0.47%)#44 | 250,948(0.02%)#667 |
| 45. | Bellingham | 52 | 11,855(0.44%)#45 | 250,948(0.02%)#695 |
| 46. | South Hill | 52 | 11,855(0.44%)#46 | 250,948(0.02%)#698 |
| 47. | Spokane | 42 | 11,855(0.35%)#47 | 250,948(0.02%)#795 |
| 48. | Bothell West | 42 | 11,855(0.35%)#48 | 250,948(0.02%)#801 |
| 49. | Ellensburg | 42 | 11,855(0.35%)#49 | 250,948(0.02%)#802 |
| 50. | East Wenatchee | 41 | 11,855(0.35%)#50 | 250,948(0.02%)#810 |
| 51. | Olympia | 38 | 11,855(0.32%)#51 | 250,948(0.02%)#837 |
| 52. | Graham | 35 | 11,855(0.30%)#52 | 250,948(0.01%)#882 |
| 53. | Oak Harbor | 33 | 11,855(0.28%)#53 | 250,948(0.01%)#912 |
| 54. | Lake Stickney | 33 | 11,855(0.28%)#54 | 250,948(0.01%)#913 |
| 55. | Orchards | 32 | 11,855(0.27%)#55 | 250,948(0.01%)#921 |
| 56. | Snohomish | 32 | 11,855(0.27%)#56 | 250,948(0.01%)#925 |
| 57. | Grand Mound | 28 | 11,855(0.24%)#57 | 250,948(0.01%)#991 |
| 58. | Lake Morton Berrydale | 27 | 11,855(0.23%)#58 | 250,948(0.01%)#1,009 |
| 59. | Pasco | 26 | 11,855(0.22%)#59 | 250,948(0.01%)#1,022 |
| 60. | Venersborg | 26 | 11,855(0.22%)#60 | 250,948(0.01%)#1,033 |
| 61. | Longview | 25 | 11,855(0.21%)#61 | 250,948(0.01%)#1,042 |
| 62. | Marysville | 24 | 11,855(0.20%)#62 | 250,948(0.01%)#1,064 |
| 63. | Richland | 24 | 11,855(0.20%)#63 | 250,948(0.01%)#1,067 |
| 64. | White Center | 24 | 11,855(0.20%)#64 | 250,948(0.01%)#1,077 |
| 65. | Edgewood | 24 | 11,855(0.20%)#65 | 250,948(0.01%)#1,078 |
| 66. | Mount Vernon | 23 | 11,855(0.19%)#66 | 250,948(0.01%)#1,096 |
| 67. | University Place | 23 | 11,855(0.19%)#67 | 250,948(0.01%)#1,097 |
| 68. | Newcastle | 21 | 11,855(0.18%)#68 | 250,948(0.01%)#1,140 |
| 69. | Pacific | 20 | 11,855(0.17%)#69 | 250,948(0.01%)#1,160 |
| 70. | Normandy Park | 20 | 11,855(0.17%)#70 | 250,948(0.01%)#1,161 |
| 71. | Rocky Point | 20 | 11,855(0.17%)#71 | 250,948(0.01%)#1,170 |
| 72. | Aberdeen | 19 | 11,855(0.16%)#72 | 250,948(0.01%)#1,180 |
| 73. | Three Lakes | 19 | 11,855(0.16%)#73 | 250,948(0.01%)#1,190 |
| 74. | Edmonds | 18 | 11,855(0.15%)#74 | 250,948(0.01%)#1,203 |
| 75. | Lynnwood | 18 | 11,855(0.15%)#75 | 250,948(0.01%)#1,204 |
| 76. | Battle Ground | 16 | 11,855(0.13%)#76 | 250,948(0.01%)#1,268 |
| 77. | Mesa | 16 | 11,855(0.13%)#77 | 250,948(0.01%)#1,283 |
| 78. | Redmond | 14 | 11,855(0.12%)#78 | 250,948(0.01%)#1,316 |
| 79. | Barberton | 13 | 11,855(0.11%)#79 | 250,948(0.01%)#1,361 |
| 80. | Shoreline | 12 | 11,855(0.10%)#80 | 250,948(0.00%)#1,372 |
| 81. | Walla Walla | 11 | 11,855(0.09%)#81 | 250,948(0.00%)#1,411 |
| 82. | Sumner | 11 | 11,855(0.09%)#82 | 250,948(0.00%)#1,422 |
| 83. | Bonney Lake | 10 | 11,855(0.08%)#83 | 250,948(0.00%)#1,454 |
| 84. | Monroe | 10 | 11,855(0.08%)#84 | 250,948(0.00%)#1,457 |
| 85. | Lacey | 9 | 11,855(0.08%)#85 | 250,948(0.00%)#1,492 |
| 86. | Eastmont | 9 | 11,855(0.08%)#86 | 250,948(0.00%)#1,501 |
| 87. | Soap Lake | 8 | 11,855(0.07%)#87 | 250,948(0.00%)#1,549 |
| 88. | Cheney | 7 | 11,855(0.06%)#88 | 250,948(0.00%)#1,565 |
| 89. | Warm Beach | 6 | 11,855(0.05%)#89 | 250,948(0.00%)#1,610 |
| 90. | Elmer City | 5 | 11,855(0.04%)#90 | 250,948(0.00%)#1,657 |
| 91. | Connell | 4 | 11,855(0.03%)#91 | 250,948(0.00%)#1,679 |
| 92. | Suquamish | 2 | 11,855(0.02%)#92 | 250,948(0.00%)#1,744 |
| 93. | Dayton | 2 | 11,855(0.02%)#93 | 250,948(0.00%)#1,747 |
Common Questions
What are the Top 10 Cities with the Largest Malaysian Community in Washington?
Top 10 Cities with the Largest Malaysian Community in Washington are:
#1
1,390
#2
1,119
#3
944
#4
914
#5
849
#6
356
#7
273
#8
268
#9
234
#10
210
What city has the Largest Malaysian Community in Washington?
Seattle has the Largest Malaysian Community in Washington with 1,390.
What is the Total Malaysian Population in the State of Washington?
Total Malaysian Population in Washington is 11,855.
What is the Total Malaysian Population in the United States?
Total Malaysian Population in the United States is 250,948.