Fort Lewis, WA Map & Demographics
Fort Lewis Map
Fort Lewis Overview
$21,202
PER CAPITA INCOME
$51,716
AVG FAMILY INCOME
$51,679
AVG HOUSEHOLD INCOME
16.1%
WAGE / INCOME GAP [ % ]
83.9¢/ $1
WAGE / INCOME GAP [ $ ]
0.34
INEQUALITY / GINI INDEX
13,440
TOTAL POPULATION
7,948
MALE POPULATION
5,492
FEMALE POPULATION
144.72
MALES / 100 FEMALES
69.10
FEMALES / 100 MALES
22.8
MEDIAN AGE
3.3
AVG FAMILY SIZE
3.1
AVG HOUSEHOLD SIZE
7,650
LABOR FORCE [ PEOPLE ]
79.7%
PERCENT IN LABOR FORCE
2.6%
UNEMPLOYMENT RATE
Fort Lewis Area Codes
Income in Fort Lewis
Income Overview in Fort Lewis
Per Capita Income in Fort Lewis is $21,202, while median incomes of families and households are $51,716 and $51,679 respectively.
| Characteristic | Number | Measure |
| Per Capita Income | 13,440 | $21,202 |
| Median Family Income | 2,996 | $51,716 |
| Mean Family Income | 2,996 | $57,566 |
| Median Household Income | 3,214 | $51,679 |
| Mean Household Income | 3,214 | $56,862 |
| Income Deficit | 2,996 | $0 |
| Wage / Income Gap (%) | 13,440 | 16.13% |
| Wage / Income Gap ($) | 13,440 | 83.87¢ per $1 |
| Gini / Inequality Index | 13,440 | 0.34 |
Earnings by Sex in Fort Lewis
Average Earnings in Fort Lewis are $29,766, $31,574 for men and $26,480 for women, a difference of 16.1%.
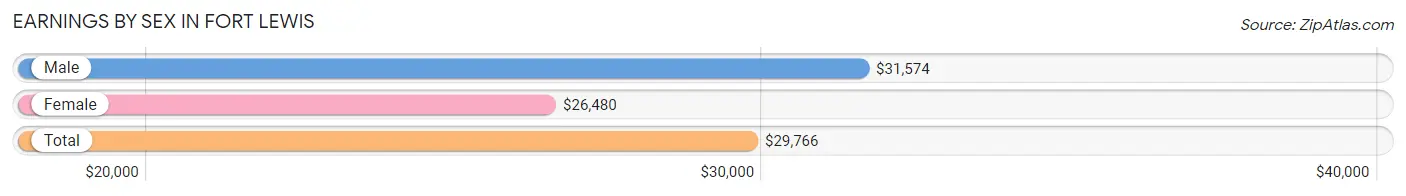
| Sex | Number | Average Earnings |
| Male | 5,713 (73.1%) | $31,574 |
| Female | 2,099 (26.9%) | $26,480 |
| Total | 7,812 (100.0%) | $29,766 |
Earnings by Sex by Income Bracket in Fort Lewis
The most common earnings brackets in Fort Lewis are $30,000 to $34,999 for men (864 | 15.1%) and $25,000 to $29,999 for women (346 | 16.5%).
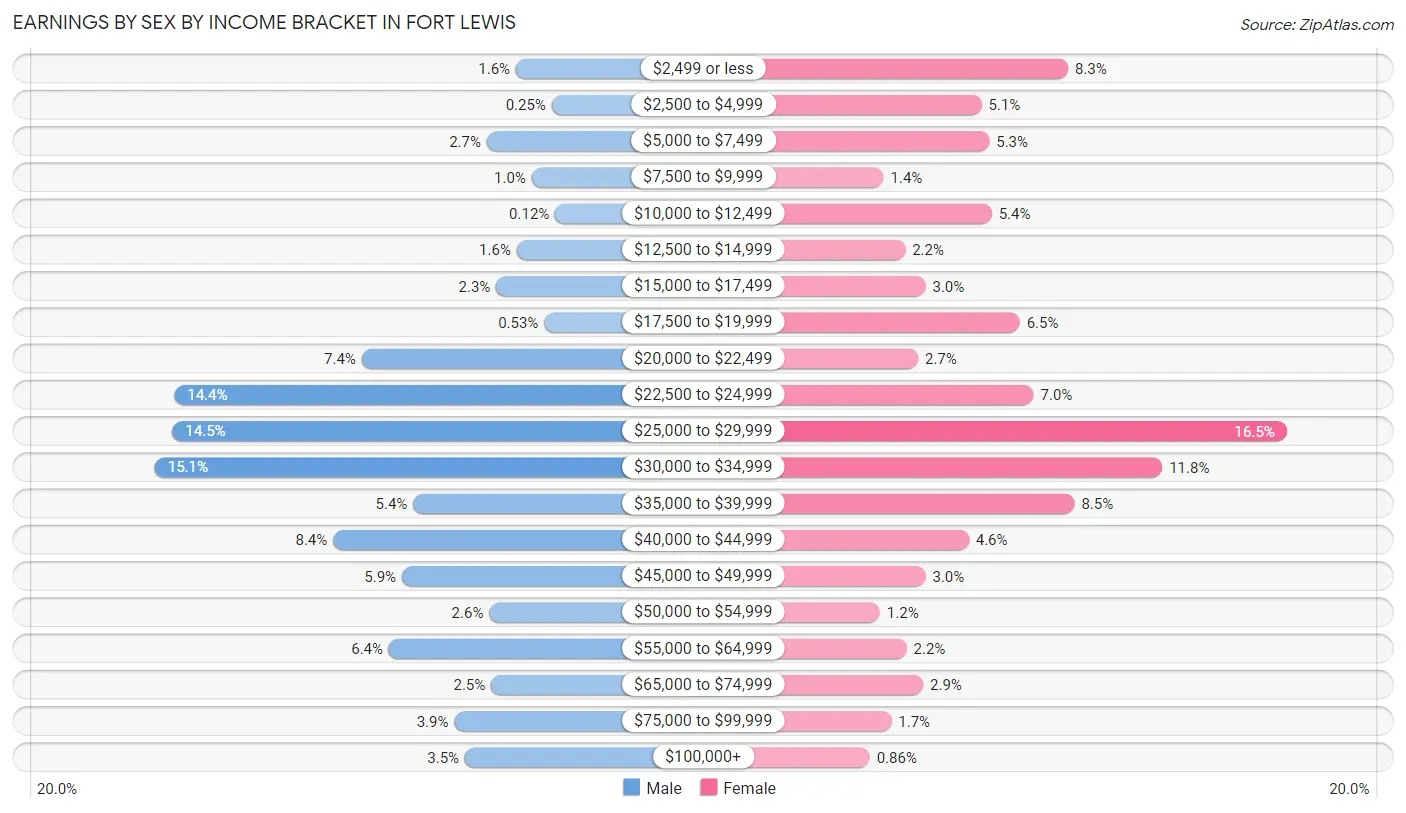
| Income | Male | Female |
| $2,499 or less | 91 (1.6%) | 174 (8.3%) |
| $2,500 to $4,999 | 14 (0.3%) | 106 (5.1%) |
| $5,000 to $7,499 | 153 (2.7%) | 112 (5.3%) |
| $7,500 to $9,999 | 57 (1.0%) | 29 (1.4%) |
| $10,000 to $12,499 | 7 (0.1%) | 114 (5.4%) |
| $12,500 to $14,999 | 89 (1.6%) | 46 (2.2%) |
| $15,000 to $17,499 | 133 (2.3%) | 62 (2.9%) |
| $17,500 to $19,999 | 30 (0.5%) | 136 (6.5%) |
| $20,000 to $22,499 | 421 (7.4%) | 56 (2.7%) |
| $22,500 to $24,999 | 822 (14.4%) | 147 (7.0%) |
| $25,000 to $29,999 | 826 (14.5%) | 346 (16.5%) |
| $30,000 to $34,999 | 864 (15.1%) | 248 (11.8%) |
| $35,000 to $39,999 | 311 (5.4%) | 179 (8.5%) |
| $40,000 to $44,999 | 482 (8.4%) | 96 (4.6%) |
| $45,000 to $49,999 | 335 (5.9%) | 62 (2.9%) |
| $50,000 to $54,999 | 148 (2.6%) | 26 (1.2%) |
| $55,000 to $64,999 | 363 (6.4%) | 47 (2.2%) |
| $65,000 to $74,999 | 144 (2.5%) | 60 (2.9%) |
| $75,000 to $99,999 | 223 (3.9%) | 35 (1.7%) |
| $100,000+ | 200 (3.5%) | 18 (0.9%) |
| Total | 5,713 (100.0%) | 2,099 (100.0%) |
Earnings by Sex by Educational Attainment in Fort Lewis
Average earnings in Fort Lewis are $41,477 for men and $28,212 for women, a difference of 32.0%. Men with an educational attainment of graduate degree enjoy the highest average annual earnings of $111,633, while those with college or associate's degree education earn the least with $38,401. Women with an educational attainment of high school diploma earn the most with the average annual earnings of $30,521, while those with college or associate's degree education have the smallest earnings of $26,921.
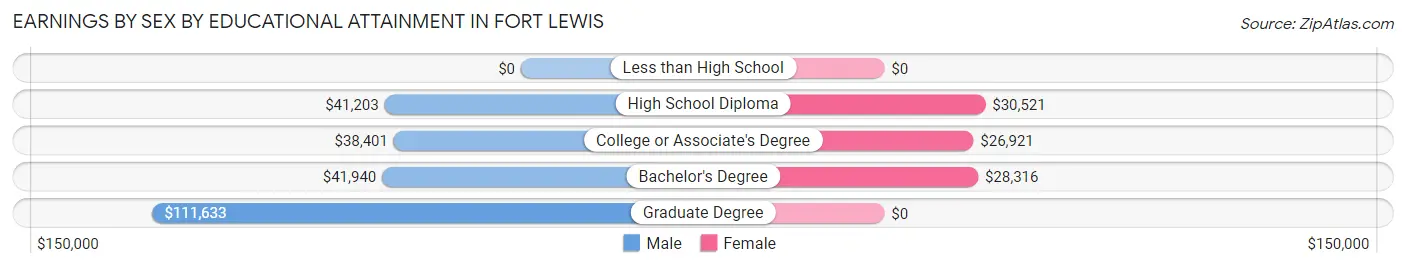
| Educational Attainment | Male Income | Female Income |
| Less than High School | - | - |
| High School Diploma | $41,203 | $30,521 |
| College or Associate's Degree | $38,401 | $26,921 |
| Bachelor's Degree | $41,940 | $28,316 |
| Graduate Degree | $111,633 | $0 |
| Total | $41,477 | $28,212 |
Family Income in Fort Lewis
Family Income Brackets in Fort Lewis
According to the Fort Lewis family income data, there are 875 families falling into the $50,000 to $74,999 income range, which is the most common income bracket and makes up 29.2% of all families. Conversely, the $150,000 to $199,999 income bracket is the least frequent group with only 21 families (0.7%) belonging to this category.
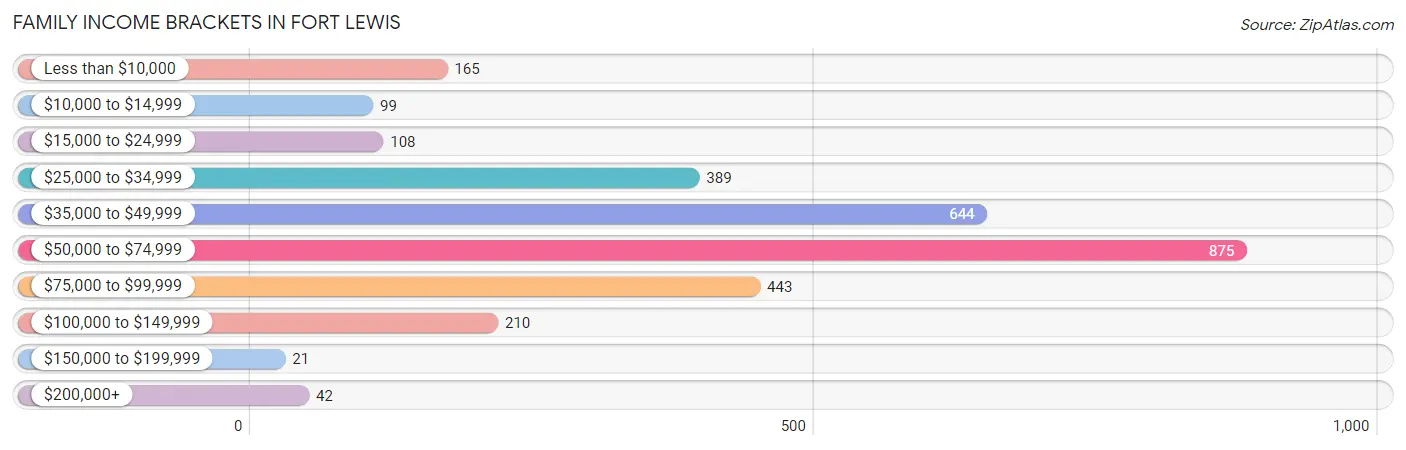
| Income Bracket | # Families | % Families |
| Less than $10,000 | 165 | 5.5% |
| $10,000 to $14,999 | 99 | 3.3% |
| $15,000 to $24,999 | 108 | 3.6% |
| $25,000 to $34,999 | 389 | 13.0% |
| $35,000 to $49,999 | 644 | 21.5% |
| $50,000 to $74,999 | 875 | 29.2% |
| $75,000 to $99,999 | 443 | 14.8% |
| $100,000 to $149,999 | 210 | 7.0% |
| $150,000 to $199,999 | 21 | 0.7% |
| $200,000+ | 42 | 1.4% |
Family Income by Famaliy Size in Fort Lewis
6-person families (198 | 6.6%) account for the highest median family income in Fort Lewis with $58,429 per family, while 2-person families (826 | 27.6%) have the highest median income of $28,428 per family member.
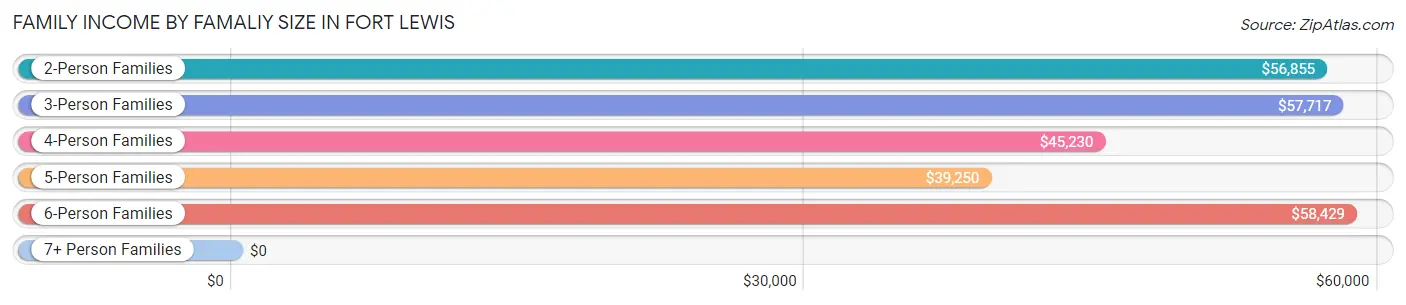
| Income Bracket | # Families | Median Income |
| 2-Person Families | 826 (27.6%) | $56,855 |
| 3-Person Families | 932 (31.1%) | $57,717 |
| 4-Person Families | 785 (26.2%) | $45,230 |
| 5-Person Families | 251 (8.4%) | $39,250 |
| 6-Person Families | 198 (6.6%) | $58,429 |
| 7+ Person Families | 4 (0.1%) | $0 |
| Total | 2,996 (100.0%) | $51,716 |
Family Income by Number of Earners in Fort Lewis
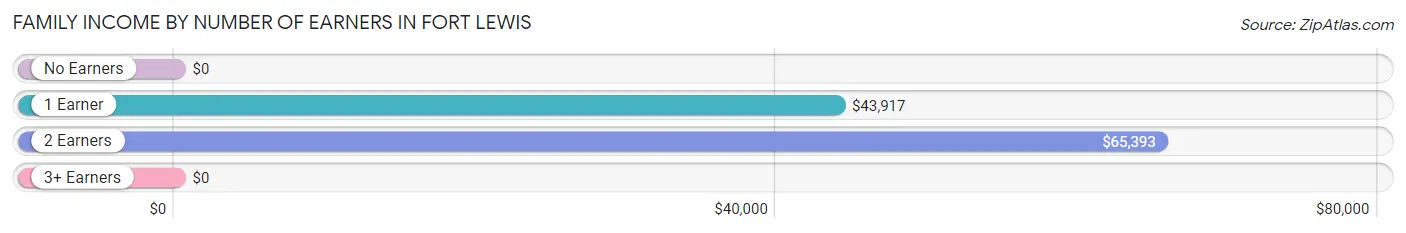
| Number of Earners | # Families | Median Income |
| No Earners | 295 (9.9%) | $0 |
| 1 Earner | 1,236 (41.3%) | $43,917 |
| 2 Earners | 1,447 (48.3%) | $65,393 |
| 3+ Earners | 18 (0.6%) | $0 |
| Total | 2,996 (100.0%) | $51,716 |
Household Income in Fort Lewis
Household Income Brackets in Fort Lewis
With 967 households falling in the category, the $50,000 to $74,999 income range is the most frequent in Fort Lewis, accounting for 30.1% of all households. In contrast, only 22 households (0.7%) fall into the $150,000 to $199,999 income bracket, making it the least populous group.

| Income Bracket | # Households | % Households |
| Less than $10,000 | 186 | 5.8% |
| $10,000 to $14,999 | 93 | 2.9% |
| $15,000 to $24,999 | 125 | 3.9% |
| $25,000 to $34,999 | 427 | 13.3% |
| $35,000 to $49,999 | 685 | 21.3% |
| $50,000 to $74,999 | 967 | 30.1% |
| $75,000 to $99,999 | 460 | 14.3% |
| $100,000 to $149,999 | 209 | 6.5% |
| $150,000 to $199,999 | 22 | 0.7% |
| $200,000+ | 42 | 1.3% |
Household Income by Householder Age in Fort Lewis
The median household income in Fort Lewis is $51,679, with the highest median household income of $59,075 found in the 45 to 64 years age bracket for the primary householder. A total of 182 households (5.7%) fall into this category.
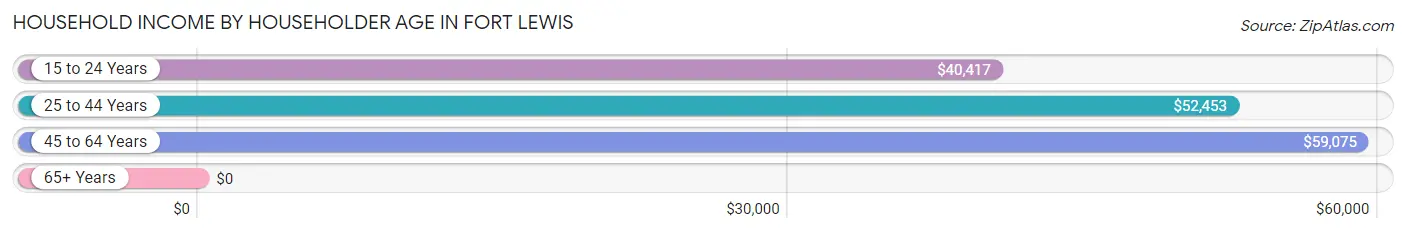
| Income Bracket | # Households | Median Income |
| 15 to 24 Years | 929 (28.9%) | $40,417 |
| 25 to 44 Years | 2,103 (65.4%) | $52,453 |
| 45 to 64 Years | 182 (5.7%) | $59,075 |
| 65+ Years | 0 (0.0%) | $0 |
| Total | 3,214 (100.0%) | $51,679 |
Poverty in Fort Lewis
Income Below Poverty by Sex and Age in Fort Lewis
With 12.0% poverty level for males and 20.5% for females among the residents of Fort Lewis, 55 to 64 year old males and 16 and 17 year old females are the most vulnerable to poverty, with 29 males (100.0%) and 35 females (58.3%) in their respective age groups living below the poverty level.
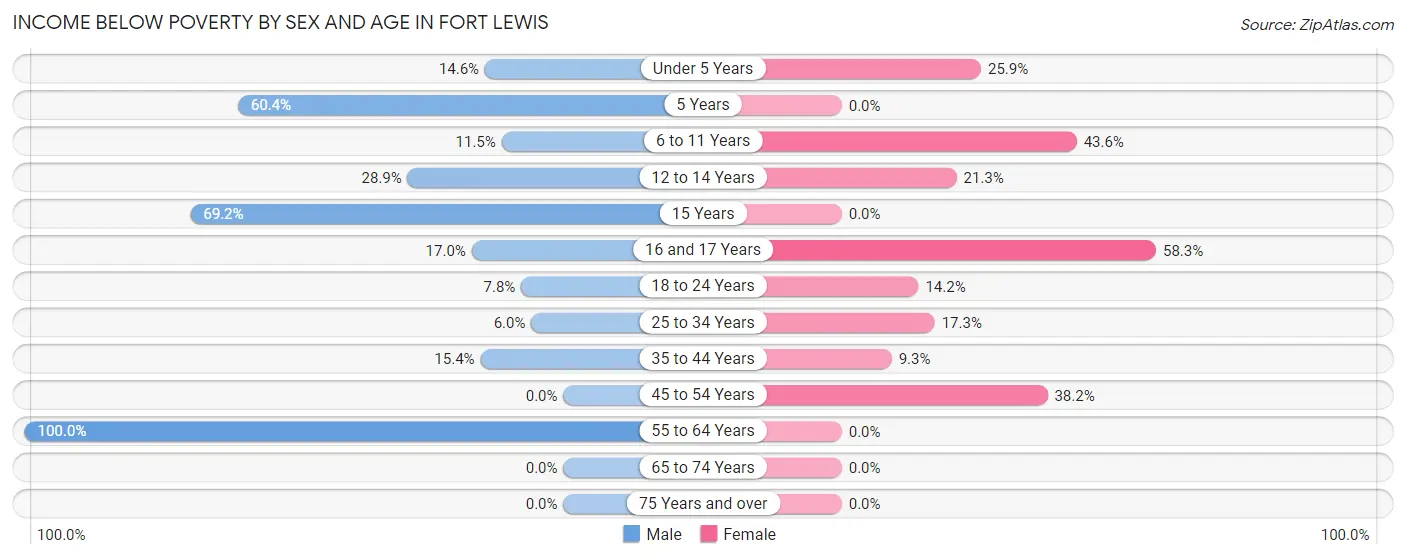
| Age Bracket | Male | Female |
| Under 5 Years | 179 (14.5%) | 298 (25.9%) |
| 5 Years | 58 (60.4%) | 0 (0.0%) |
| 6 to 11 Years | 58 (11.5%) | 160 (43.6%) |
| 12 to 14 Years | 37 (28.9%) | 52 (21.3%) |
| 15 Years | 9 (69.2%) | 0 (0.0%) |
| 16 and 17 Years | 8 (17.0%) | 35 (58.3%) |
| 18 to 24 Years | 69 (7.8%) | 159 (14.2%) |
| 25 to 34 Years | 92 (5.9%) | 243 (17.2%) |
| 35 to 44 Years | 65 (15.4%) | 40 (9.3%) |
| 45 to 54 Years | 0 (0.0%) | 42 (38.2%) |
| 55 to 64 Years | 29 (100.0%) | 0 (0.0%) |
| 65 to 74 Years | 0 (0.0%) | 0 (0.0%) |
| 75 Years and over | 0 (0.0%) | 0 (0.0%) |
| Total | 604 (12.0%) | 1,029 (20.5%) |
Income Above Poverty by Sex and Age in Fort Lewis
According to the poverty statistics in Fort Lewis, males aged 45 to 54 years and females aged 5 years are the age groups that are most secure financially, with 100.0% of males and 100.0% of females in these age groups living above the poverty line.
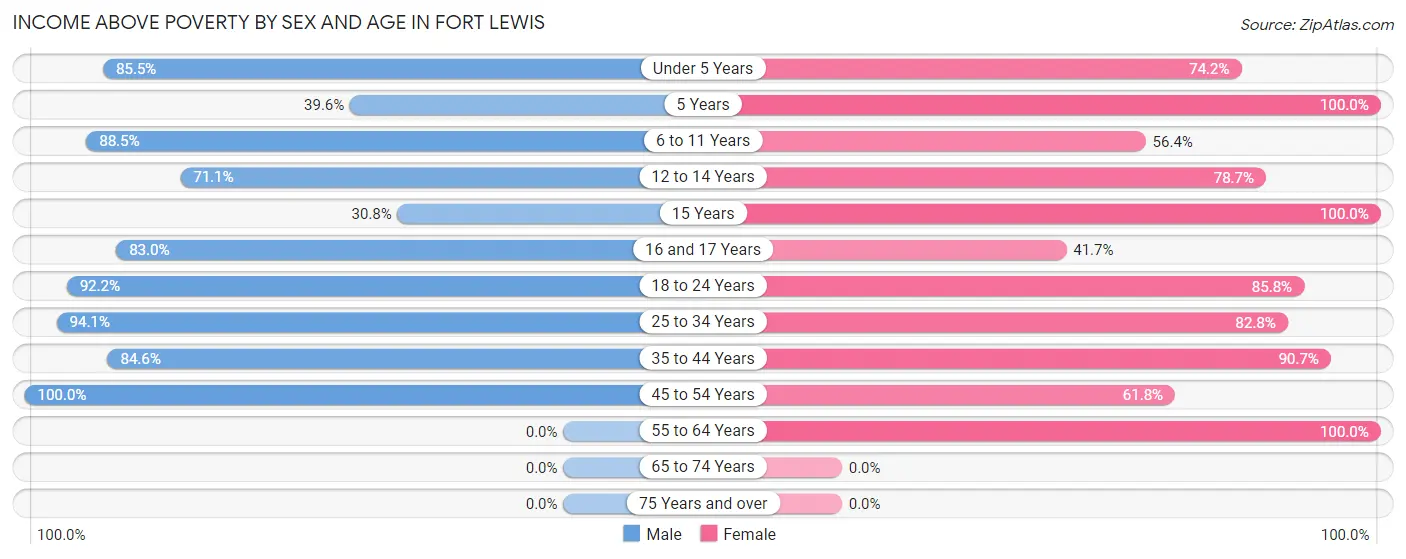
| Age Bracket | Male | Female |
| Under 5 Years | 1,051 (85.5%) | 855 (74.2%) |
| 5 Years | 38 (39.6%) | 67 (100.0%) |
| 6 to 11 Years | 448 (88.5%) | 207 (56.4%) |
| 12 to 14 Years | 91 (71.1%) | 192 (78.7%) |
| 15 Years | 4 (30.8%) | 38 (100.0%) |
| 16 and 17 Years | 39 (83.0%) | 25 (41.7%) |
| 18 to 24 Years | 812 (92.2%) | 958 (85.8%) |
| 25 to 34 Years | 1,453 (94.1%) | 1,166 (82.8%) |
| 35 to 44 Years | 357 (84.6%) | 392 (90.7%) |
| 45 to 54 Years | 137 (100.0%) | 68 (61.8%) |
| 55 to 64 Years | 0 (0.0%) | 17 (100.0%) |
| 65 to 74 Years | 0 (0.0%) | 0 (0.0%) |
| 75 Years and over | 0 (0.0%) | 0 (0.0%) |
| Total | 4,430 (88.0%) | 3,985 (79.5%) |
Income Below Poverty Among Married-Couple Families in Fort Lewis
The poverty statistics for married-couple families in Fort Lewis show that 8.5% or 227 of the total 2,684 families live below the poverty line. Families with 3 or 4 children have the highest poverty rate of 30.2%, comprising of 123 families. On the other hand, families with 5 or more children have the lowest poverty rate of 0.0%, which includes 0 families.
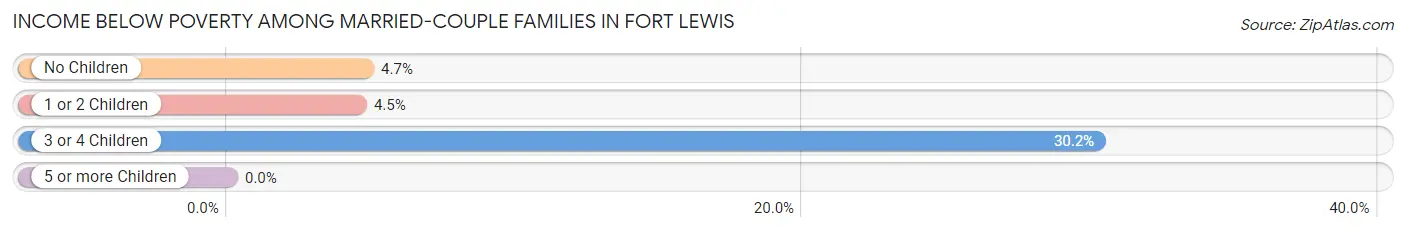
| Children | Above Poverty | Below Poverty |
| No Children | 743 (95.3%) | 37 (4.7%) |
| 1 or 2 Children | 1,426 (95.5%) | 67 (4.5%) |
| 3 or 4 Children | 284 (69.8%) | 123 (30.2%) |
| 5 or more Children | 4 (100.0%) | 0 (0.0%) |
| Total | 2,457 (91.5%) | 227 (8.5%) |
Income Below Poverty Among Single-Parent Households in Fort Lewis
According to the poverty data in Fort Lewis, 20.6% or 19 single-father households and 80.4% or 177 single-mother households are living below the poverty line. Among single-father households, those with 1 or 2 children have the highest poverty rate, with 19 households (20.6%) experiencing poverty. Likewise, among single-mother households, those with 3 or 4 children have the highest poverty rate, with 84 households (100.0%) falling below the poverty line.
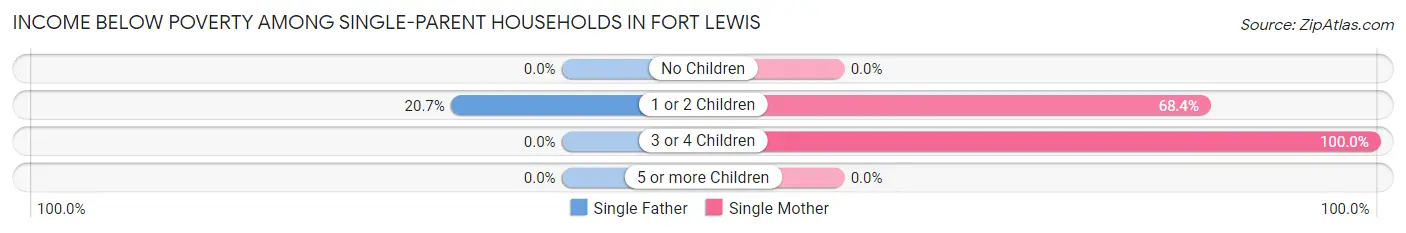
| Children | Single Father | Single Mother |
| No Children | 0 (0.0%) | 0 (0.0%) |
| 1 or 2 Children | 19 (20.6%) | 93 (68.4%) |
| 3 or 4 Children | 0 (0.0%) | 84 (100.0%) |
| 5 or more Children | 0 (0.0%) | 0 (0.0%) |
| Total | 19 (20.6%) | 177 (80.4%) |
Income Below Poverty Among Married-Couple vs Single-Parent Households in Fort Lewis
The poverty data for Fort Lewis shows that 227 of the married-couple family households (8.5%) and 196 of the single-parent households (62.8%) are living below the poverty level. Within the married-couple family households, those with 3 or 4 children have the highest poverty rate, with 123 households (30.2%) falling below the poverty line. Among the single-parent households, those with 3 or 4 children have the highest poverty rate, with 84 household (100.0%) living below poverty.
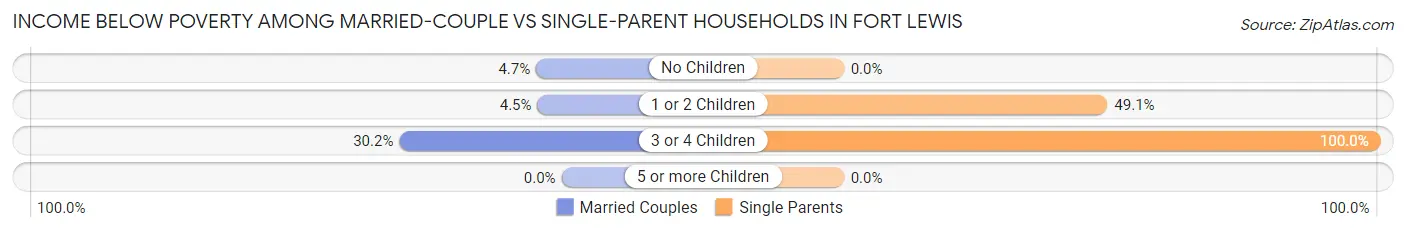
| Children | Married-Couple Families | Single-Parent Households |
| No Children | 37 (4.7%) | 0 (0.0%) |
| 1 or 2 Children | 67 (4.5%) | 112 (49.1%) |
| 3 or 4 Children | 123 (30.2%) | 84 (100.0%) |
| 5 or more Children | 0 (0.0%) | 0 (0.0%) |
| Total | 227 (8.5%) | 196 (62.8%) |
Race in Fort Lewis
The most populous races in Fort Lewis are White / Caucasian (8,062 | 60.0%), Hispanic or Latino (3,290 | 24.5%), and Two or more Races (1,883 | 14.0%).
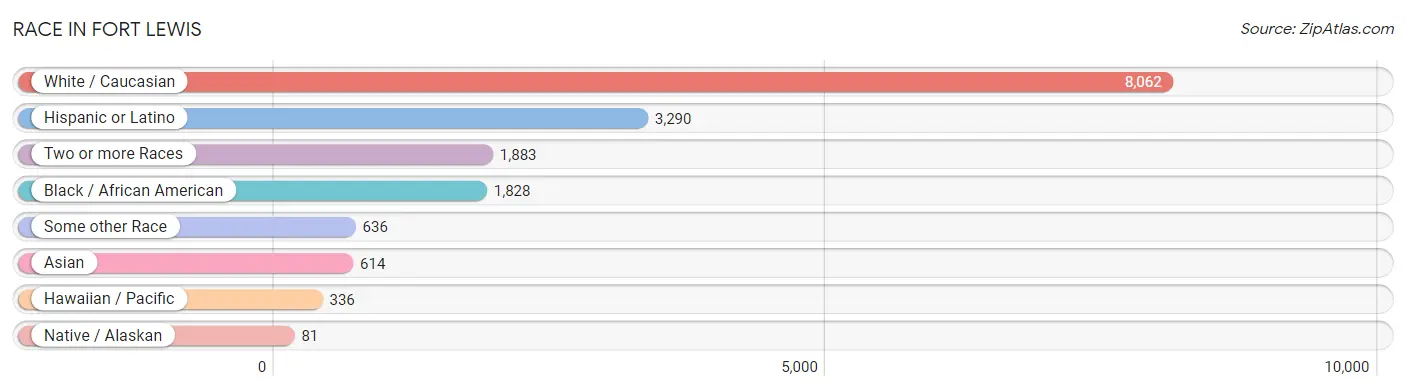
| Race | # Population | % Population |
| Asian | 614 | 4.6% |
| Black / African American | 1,828 | 13.6% |
| Hawaiian / Pacific | 336 | 2.5% |
| Hispanic or Latino | 3,290 | 24.5% |
| Native / Alaskan | 81 | 0.6% |
| White / Caucasian | 8,062 | 60.0% |
| Two or more Races | 1,883 | 14.0% |
| Some other Race | 636 | 4.7% |
| Total | 13,440 | 100.0% |
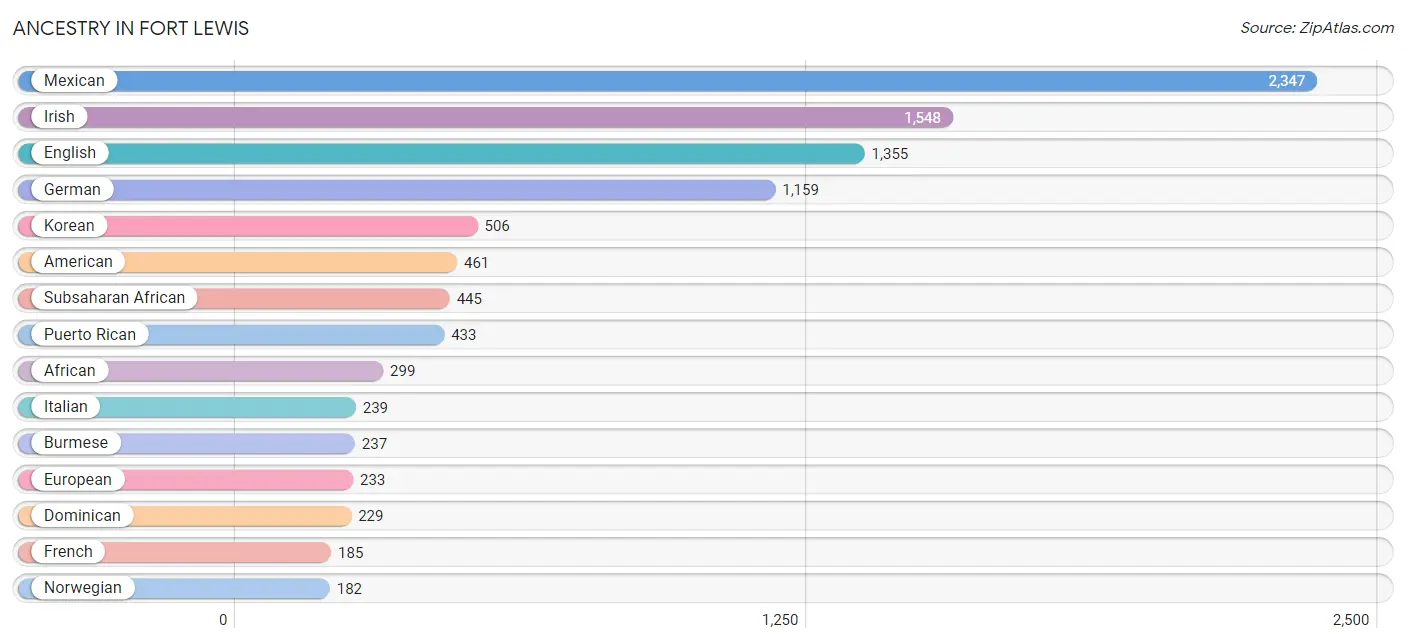
Ancestry in Fort Lewis
The most populous ancestries reported in Fort Lewis are Mexican (2,347 | 17.5%), Irish (1,548 | 11.5%), English (1,355 | 10.1%), German (1,159 | 8.6%), and Korean (506 | 3.8%), together accounting for 51.4% of all Fort Lewis residents.
| Ancestry | # Population | % Population |
| African | 299 | 2.2% |
| American | 461 | 3.4% |
| Arab | 30 | 0.2% |
| Armenian | 9 | 0.1% |
| Austrian | 26 | 0.2% |
| Bangladeshi | 31 | 0.2% |
| Bhutanese | 126 | 0.9% |
| Blackfeet | 10 | 0.1% |
| British | 24 | 0.2% |
| Burmese | 237 | 1.8% |
| Central American | 90 | 0.7% |
| Cherokee | 35 | 0.3% |
| Chippewa | 8 | 0.1% |
| Czech | 26 | 0.2% |
| Danish | 20 | 0.2% |
| Dominican | 229 | 1.7% |
| Dutch | 61 | 0.4% |
| Eastern European | 11 | 0.1% |
| Ecuadorian | 36 | 0.3% |
| English | 1,355 | 10.1% |
| Ethiopian | 40 | 0.3% |
| European | 233 | 1.7% |
| French | 185 | 1.4% |
| French Canadian | 36 | 0.3% |
| German | 1,159 | 8.6% |
| Ghanaian | 13 | 0.1% |
| Guamanian / Chamorro | 153 | 1.1% |
| Guatemalan | 73 | 0.5% |
| Haitian | 3 | 0.0% |
| Hungarian | 31 | 0.2% |
| Indian (Asian) | 99 | 0.7% |
| Indonesian | 19 | 0.1% |
| Irish | 1,548 | 11.5% |
| Israeli | 17 | 0.1% |
| Italian | 239 | 1.8% |
| Jamaican | 117 | 0.9% |
| Korean | 506 | 3.8% |
| Laotian | 8 | 0.1% |
| Lithuanian | 6 | 0.0% |
| Mexican | 2,347 | 17.5% |
| Mexican American Indian | 62 | 0.5% |
| Native Hawaiian | 54 | 0.4% |
| Navajo | 5 | 0.0% |
| Nigerian | 26 | 0.2% |
| Norwegian | 182 | 1.3% |
| Peruvian | 14 | 0.1% |
| Polish | 58 | 0.4% |
| Portuguese | 39 | 0.3% |
| Puerto Rican | 433 | 3.2% |
| Russian | 12 | 0.1% |
| Salvadoran | 17 | 0.1% |
| Samoan | 36 | 0.3% |
| Scandinavian | 168 | 1.3% |
| Scotch-Irish | 46 | 0.3% |
| Scottish | 106 | 0.8% |
| Sioux | 11 | 0.1% |
| Slovak | 10 | 0.1% |
| South African | 14 | 0.1% |
| South American | 70 | 0.5% |
| Spaniard | 42 | 0.3% |
| Sri Lankan | 152 | 1.1% |
| Subsaharan African | 445 | 3.3% |
| Swedish | 47 | 0.4% |
| Swiss | 18 | 0.1% |
| Turkish | 9 | 0.1% |
| Venezuelan | 20 | 0.2% |
| Vietnamese | 26 | 0.2% |
| Welsh | 116 | 0.9% |
| Yugoslavian | 12 | 0.1% |
| Yuman | 12 | 0.1% |
| Zimbabwean | 27 | 0.2% | View All 71 Rows |
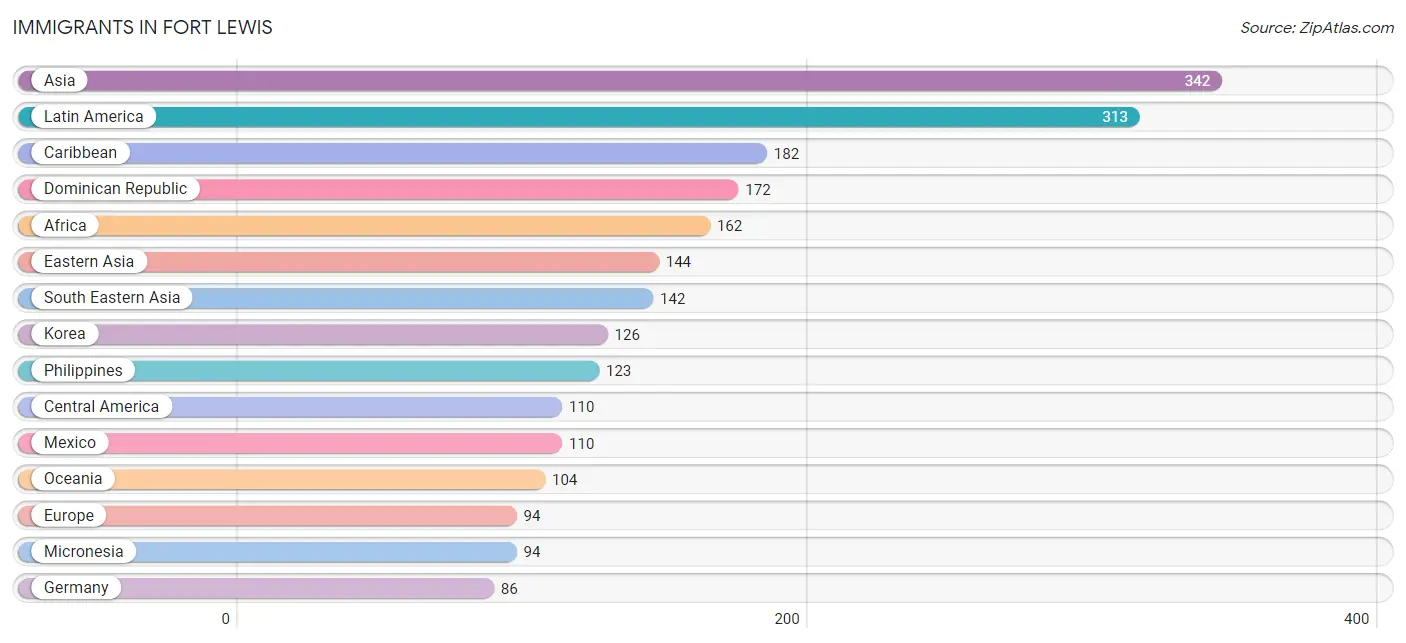
Immigrants in Fort Lewis
The most numerous immigrant groups reported in Fort Lewis came from Asia (342 | 2.5%), Latin America (313 | 2.3%), Caribbean (182 | 1.3%), Dominican Republic (172 | 1.3%), and Africa (162 | 1.2%), together accounting for 8.7% of all Fort Lewis residents.
| Immigration Origin | # Population | % Population |
| Africa | 162 | 1.2% |
| Asia | 342 | 2.5% |
| Bangladesh | 26 | 0.2% |
| Cameroon | 23 | 0.2% |
| Caribbean | 182 | 1.3% |
| Central America | 110 | 0.8% |
| China | 18 | 0.1% |
| Dominican Republic | 172 | 1.3% |
| Eastern Africa | 70 | 0.5% |
| Eastern Asia | 144 | 1.1% |
| Eastern Europe | 8 | 0.1% |
| Ecuador | 11 | 0.1% |
| Europe | 94 | 0.7% |
| Germany | 86 | 0.6% |
| Ghana | 26 | 0.2% |
| Haiti | 3 | 0.0% |
| Israel | 17 | 0.1% |
| Jamaica | 7 | 0.1% |
| Korea | 126 | 0.9% |
| Latin America | 313 | 2.3% |
| Mexico | 110 | 0.8% |
| Micronesia | 94 | 0.7% |
| Middle Africa | 23 | 0.2% |
| Oceania | 104 | 0.8% |
| Philippines | 123 | 0.9% |
| Russia | 8 | 0.1% |
| South Africa | 14 | 0.1% |
| South America | 21 | 0.2% |
| South Central Asia | 30 | 0.2% |
| South Eastern Asia | 142 | 1.1% |
| Turkey | 9 | 0.1% |
| Uzbekistan | 4 | 0.0% |
| Venezuela | 10 | 0.1% |
| Western Africa | 55 | 0.4% |
| Western Asia | 26 | 0.2% |
| Western Europe | 86 | 0.6% |
| Zimbabwe | 56 | 0.4% | View All 37 Rows |
Sex and Age in Fort Lewis
Sex and Age in Fort Lewis
The most populous age groups in Fort Lewis are 20 to 24 Years (2,719 | 34.2%) for men and Under 5 Years (1,153 | 21.0%) for women.
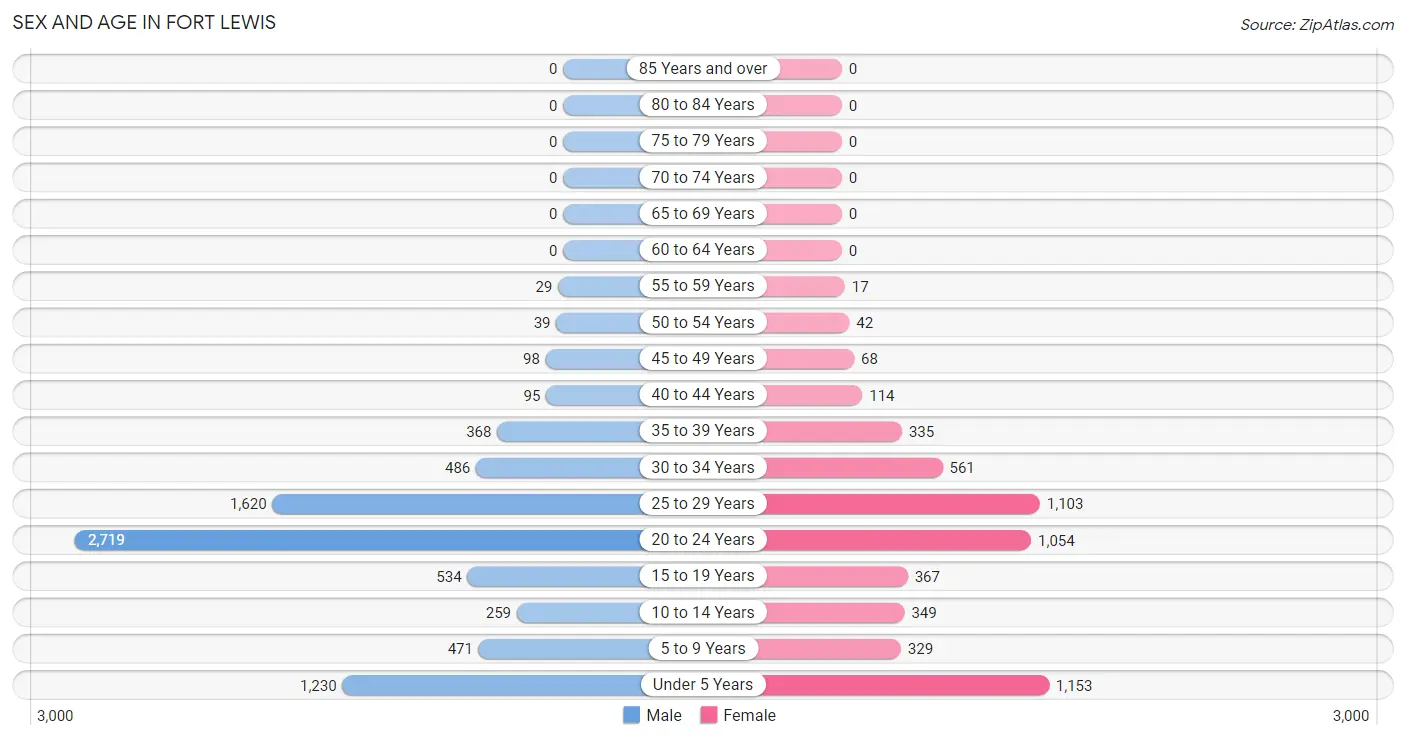
| Age Bracket | Male | Female |
| Under 5 Years | 1,230 (15.5%) | 1,153 (21.0%) |
| 5 to 9 Years | 471 (5.9%) | 329 (6.0%) |
| 10 to 14 Years | 259 (3.3%) | 349 (6.4%) |
| 15 to 19 Years | 534 (6.7%) | 367 (6.7%) |
| 20 to 24 Years | 2,719 (34.2%) | 1,054 (19.2%) |
| 25 to 29 Years | 1,620 (20.4%) | 1,103 (20.1%) |
| 30 to 34 Years | 486 (6.1%) | 561 (10.2%) |
| 35 to 39 Years | 368 (4.6%) | 335 (6.1%) |
| 40 to 44 Years | 95 (1.2%) | 114 (2.1%) |
| 45 to 49 Years | 98 (1.2%) | 68 (1.2%) |
| 50 to 54 Years | 39 (0.5%) | 42 (0.8%) |
| 55 to 59 Years | 29 (0.4%) | 17 (0.3%) |
| 60 to 64 Years | 0 (0.0%) | 0 (0.0%) |
| 65 to 69 Years | 0 (0.0%) | 0 (0.0%) |
| 70 to 74 Years | 0 (0.0%) | 0 (0.0%) |
| 75 to 79 Years | 0 (0.0%) | 0 (0.0%) |
| 80 to 84 Years | 0 (0.0%) | 0 (0.0%) |
| 85 Years and over | 0 (0.0%) | 0 (0.0%) |
| Total | 7,948 (100.0%) | 5,492 (100.0%) |
Families and Households in Fort Lewis
Median Family Size in Fort Lewis
The median family size in Fort Lewis is 3.26 persons per family, with married-couple families (2,684 | 89.6%) accounting for the largest median family size of 3.3 persons per family. On the other hand, single male/father families (92 | 3.1%) represent the smallest median family size with 2.95 persons per family.
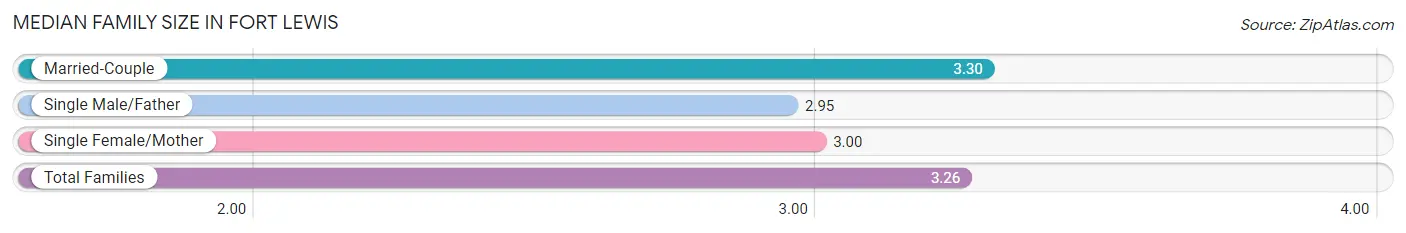
| Family Type | # Families | Family Size |
| Married-Couple | 2,684 (89.6%) | 3.30 |
| Single Male/Father | 92 (3.1%) | 2.95 |
| Single Female/Mother | 220 (7.3%) | 3.00 |
| Total Families | 2,996 (100.0%) | 3.26 |
Median Household Size in Fort Lewis
The median household size in Fort Lewis is 3.13 persons per household, with married-couple households (2,684 | 83.5%) accounting for the largest median household size of 3.3 persons per household. non-family households (218 | 6.8%) represent the smallest median household size with 1.17 persons per household.
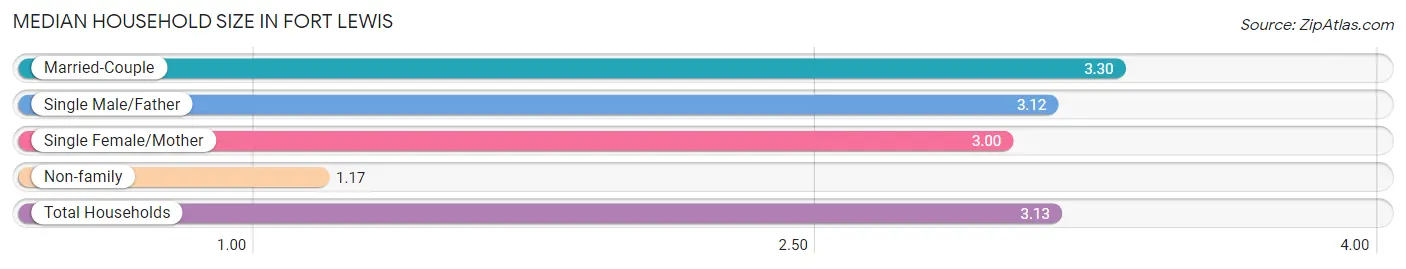
| Household Type | # Households | Household Size |
| Married-Couple | 2,684 (83.5%) | 3.30 |
| Single Male/Father | 92 (2.9%) | 3.12 |
| Single Female/Mother | 220 (6.9%) | 3.00 |
| Non-family | 218 (6.8%) | 1.17 |
| Total Households | 3,214 (100.0%) | 3.13 |
Household Size by Marriage Status in Fort Lewis
Out of a total of 3,214 households in Fort Lewis, 2,996 (93.2%) are family households, while 218 (6.8%) are nonfamily households. The most numerous type of family households are 3-person households, comprising 923, and the most common type of nonfamily households are 1-person households, comprising 191.
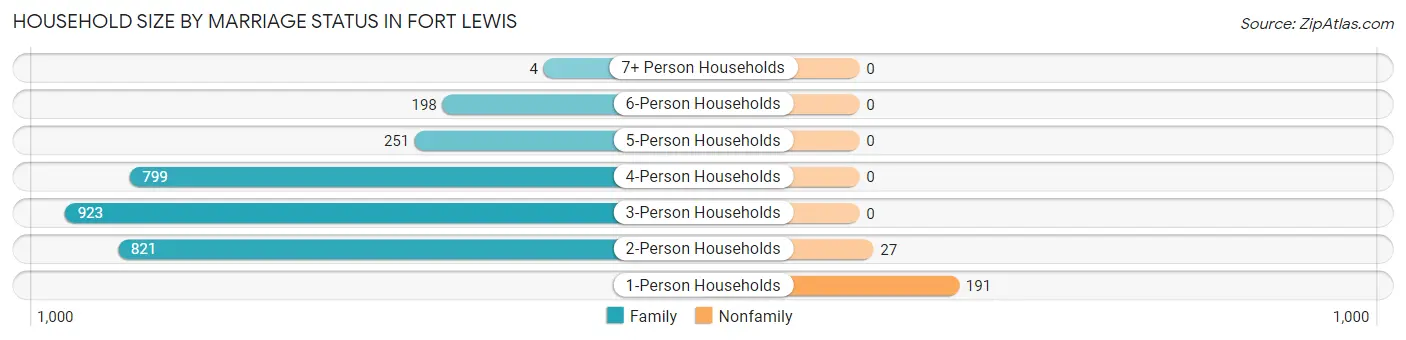
| Household Size | Family Households | Nonfamily Households |
| 1-Person Households | - | 191 (5.9%) |
| 2-Person Households | 821 (25.5%) | 27 (0.8%) |
| 3-Person Households | 923 (28.7%) | 0 (0.0%) |
| 4-Person Households | 799 (24.9%) | 0 (0.0%) |
| 5-Person Households | 251 (7.8%) | 0 (0.0%) |
| 6-Person Households | 198 (6.2%) | 0 (0.0%) |
| 7+ Person Households | 4 (0.1%) | 0 (0.0%) |
| Total | 2,996 (93.2%) | 218 (6.8%) |
Female Fertility in Fort Lewis
Fertility by Age in Fort Lewis
Average fertility rate in Fort Lewis is 152.0 births per 1,000 women. Women in the age bracket of 20 to 34 years have the highest fertility rate with 195.0 births per 1,000 women. Women in the age bracket of 20 to 34 years acount for 96.5% of all women with births.
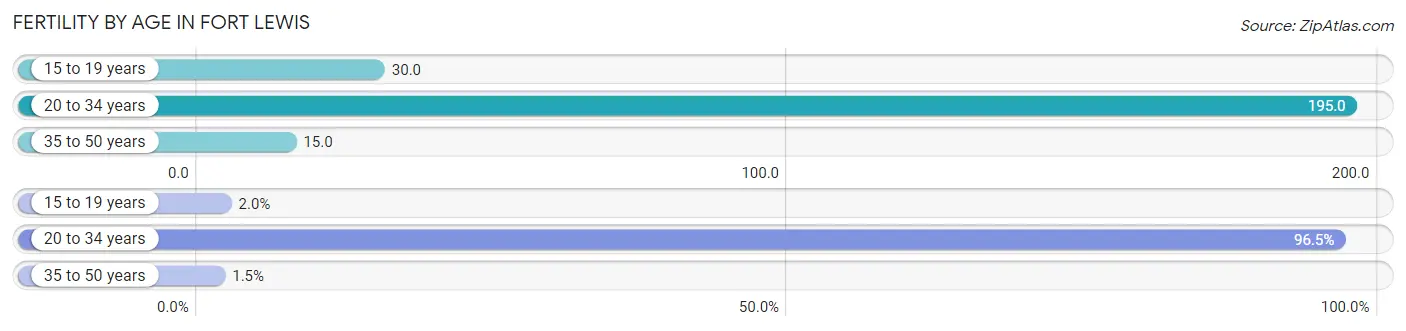
| Age Bracket | Women with Births | Births / 1,000 Women |
| 15 to 19 years | 11 (2.0%) | 30.0 |
| 20 to 34 years | 530 (96.5%) | 195.0 |
| 35 to 50 years | 8 (1.5%) | 15.0 |
| Total | 549 (100.0%) | 152.0 |
Fertility by Age by Marriage Status in Fort Lewis
96.0% of women with births (549) in Fort Lewis are married. The highest percentage of unmarried women with births falls into 20 to 34 years age bracket with 4.2% of them unmarried at the time of birth, while the lowest percentage of unmarried women with births belong to 15 to 19 years age bracket with 0.0% of them unmarried.
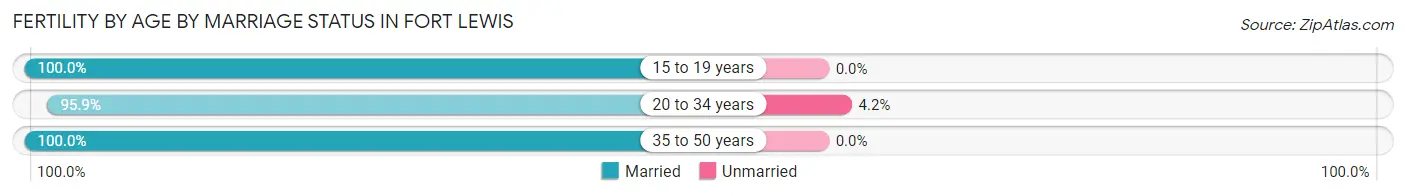
| Age Bracket | Married | Unmarried |
| 15 to 19 years | 11 (100.0%) | 0 (0.0%) |
| 20 to 34 years | 508 (95.9%) | 22 (4.2%) |
| 35 to 50 years | 8 (100.0%) | 0 (0.0%) |
| Total | 527 (96.0%) | 22 (4.0%) |
Fertility by Education in Fort Lewis
Average fertility rate in Fort Lewis is 152.0 births per 1,000 women. Women with the education attainment of high school diploma have the highest fertility rate of 197.0 births per 1,000 women, while women with the education attainment of less than high school have the lowest fertility at 40.0 births per 1,000 women. Women with the education attainment of college or associate's degree represent 55.9% of all women with births.
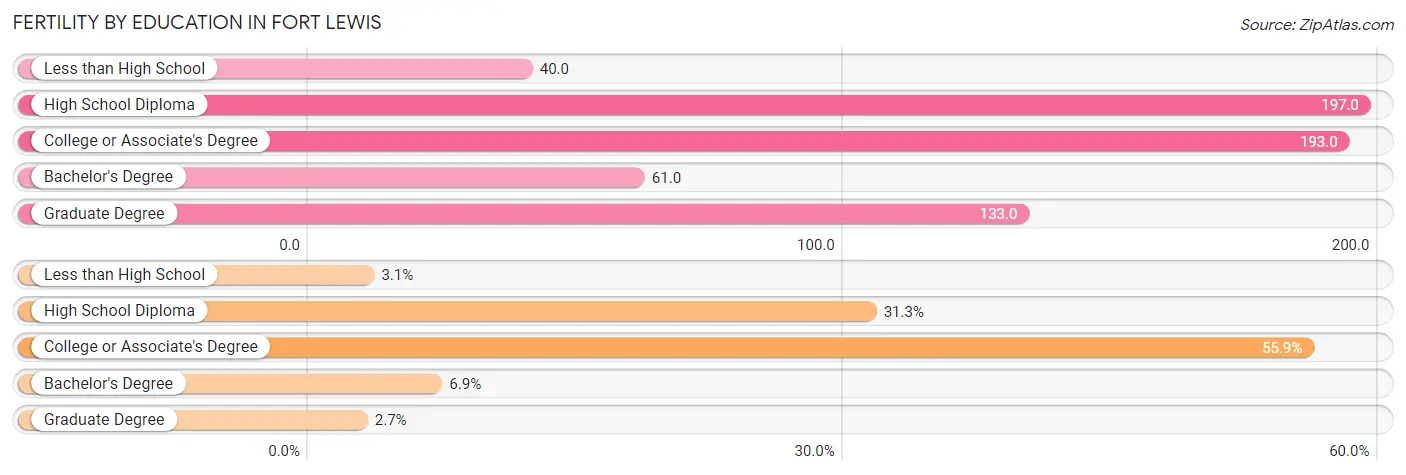
| Educational Attainment | Women with Births | Births / 1,000 Women |
| Less than High School | 17 (3.1%) | 40.0 |
| High School Diploma | 172 (31.3%) | 197.0 |
| College or Associate's Degree | 307 (55.9%) | 193.0 |
| Bachelor's Degree | 38 (6.9%) | 61.0 |
| Graduate Degree | 15 (2.7%) | 133.0 |
| Total | 549 (100.0%) | 152.0 |
Fertility by Education by Marriage Status in Fort Lewis
4.0% of women with births in Fort Lewis are unmarried. Women with the educational attainment of less than high school are most likely to be married with 100.0% of them married at childbirth, while women with the educational attainment of high school diploma are least likely to be married with 12.8% of them unmarried at childbirth.
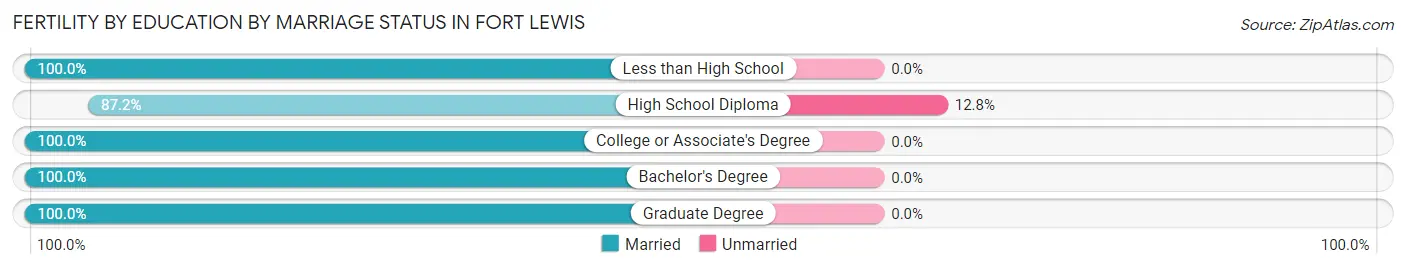
| Educational Attainment | Married | Unmarried |
| Less than High School | 17 (100.0%) | 0 (0.0%) |
| High School Diploma | 150 (87.2%) | 22 (12.8%) |
| College or Associate's Degree | 307 (100.0%) | 0 (0.0%) |
| Bachelor's Degree | 38 (100.0%) | 0 (0.0%) |
| Graduate Degree | 15 (100.0%) | 0 (0.0%) |
| Total | 527 (96.0%) | 22 (4.0%) |
Employment Characteristics in Fort Lewis
Employment by Class of Employer in Fort Lewis
Among the 7,521 employed individuals in Fort Lewis, federal government employees (6,057 | 80.5%), private company employees (962 | 12.8%), and not-for-profit organizations (198 | 2.6%) make up the most common classes of employment.
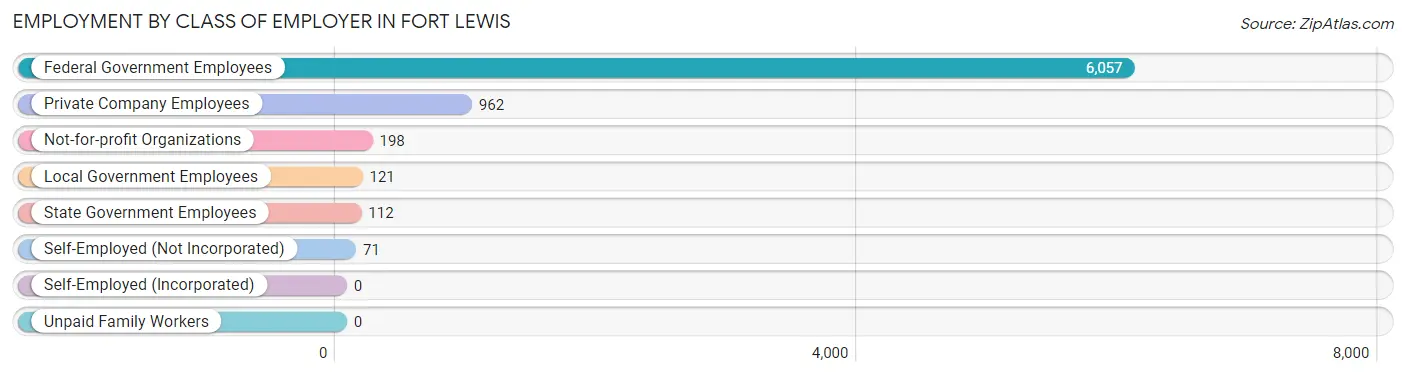
| Employer Class | # Employees | % Employees |
| Private Company Employees | 962 | 12.8% |
| Self-Employed (Incorporated) | 0 | 0.0% |
| Self-Employed (Not Incorporated) | 71 | 0.9% |
| Not-for-profit Organizations | 198 | 2.6% |
| Local Government Employees | 121 | 1.6% |
| State Government Employees | 112 | 1.5% |
| Federal Government Employees | 6,057 | 80.5% |
| Unpaid Family Workers | 0 | 0.0% |
| Total | 7,521 | 100.0% |
Employment Status by Age in Fort Lewis
According to the labor force statistics for Fort Lewis, out of the total population over 16 years of age (9,598), 79.7% or 7,650 individuals are in the labor force, with 2.6% or 199 of them unemployed. The age group with the highest labor force participation rate is 20 to 24 years, with 86.3% or 3,256 individuals in the labor force. Within the labor force, the 35 to 44 years age range has the highest percentage of unemployed individuals, with 5.5% or 38 of them being unemployed.
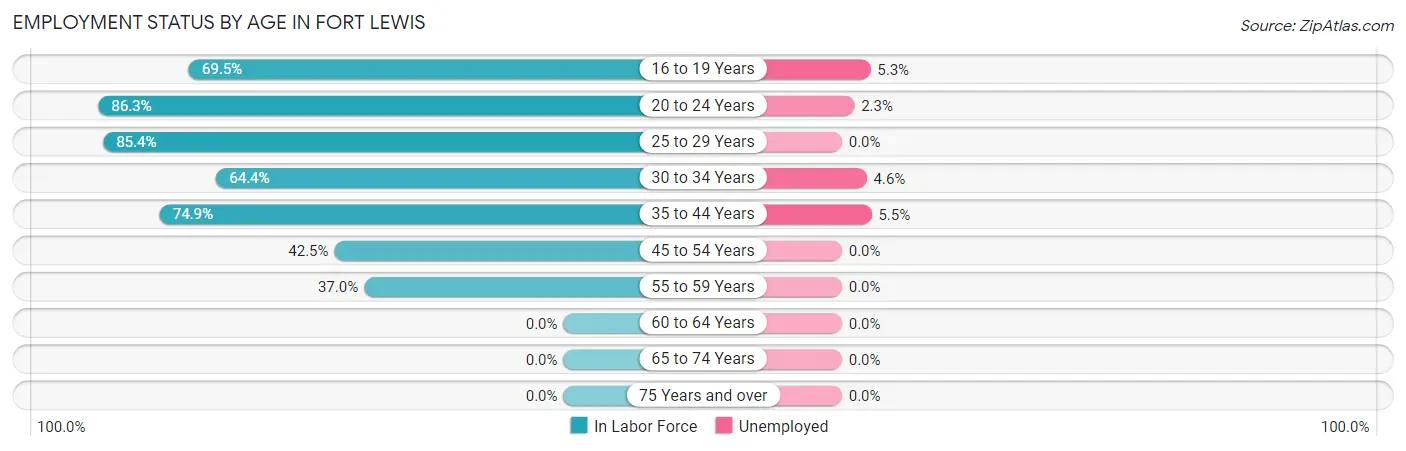
| Age Bracket | In Labor Force | Unemployed |
| 16 to 19 Years | 591 (69.5%) | 31 (5.3%) |
| 20 to 24 Years | 3,256 (86.3%) | 75 (2.3%) |
| 25 to 29 Years | 2,325 (85.4%) | 0 (0.0%) |
| 30 to 34 Years | 674 (64.4%) | 31 (4.6%) |
| 35 to 44 Years | 683 (74.9%) | 38 (5.5%) |
| 45 to 54 Years | 105 (42.5%) | 0 (0.0%) |
| 55 to 59 Years | 17 (37.0%) | 0 (0.0%) |
| 60 to 64 Years | 0 (0.0%) | 0 (0.0%) |
| 65 to 74 Years | 0 (0.0%) | 0 (0.0%) |
| 75 Years and over | 0 (0.0%) | 0 (0.0%) |
| Total | 7,650 (79.7%) | 199 (2.6%) |
Employment Status by Educational Attainment in Fort Lewis
According to labor force statistics for Fort Lewis, 76.5% of individuals (3,806) out of the total population between 25 and 64 years of age (4,975) are in the labor force, with 2.5% or 95 of them being unemployed. The group with the highest labor force participation rate are those with the educational attainment of college / associate degree, with 84.0% or 1,956 individuals in the labor force. Within the labor force, individuals with high school diploma education have the highest percentage of unemployment, with 5.2% or 47 of them being unemployed.
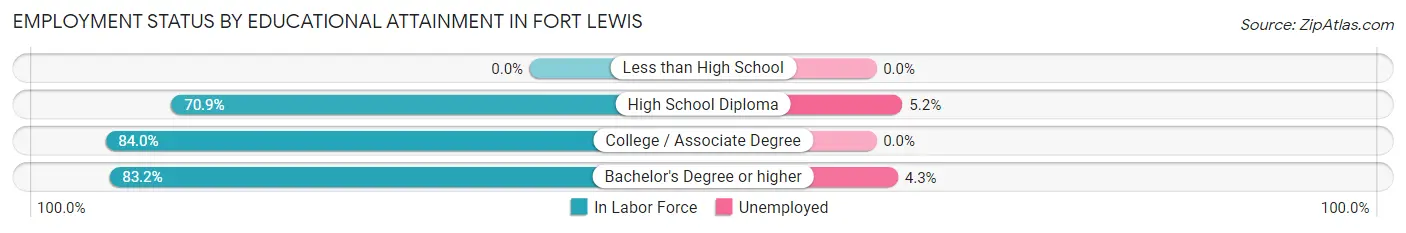
| Educational Attainment | In Labor Force | Unemployed |
| Less than High School | 0 (0.0%) | 0 (0.0%) |
| High School Diploma | 910 (70.9%) | 67 (5.2%) |
| College / Associate Degree | 1,956 (84.0%) | 0 (0.0%) |
| Bachelor's Degree or higher | 938 (83.2%) | 49 (4.3%) |
| Total | 3,806 (76.5%) | 124 (2.5%) |
Employment Occupations by Sex in Fort Lewis
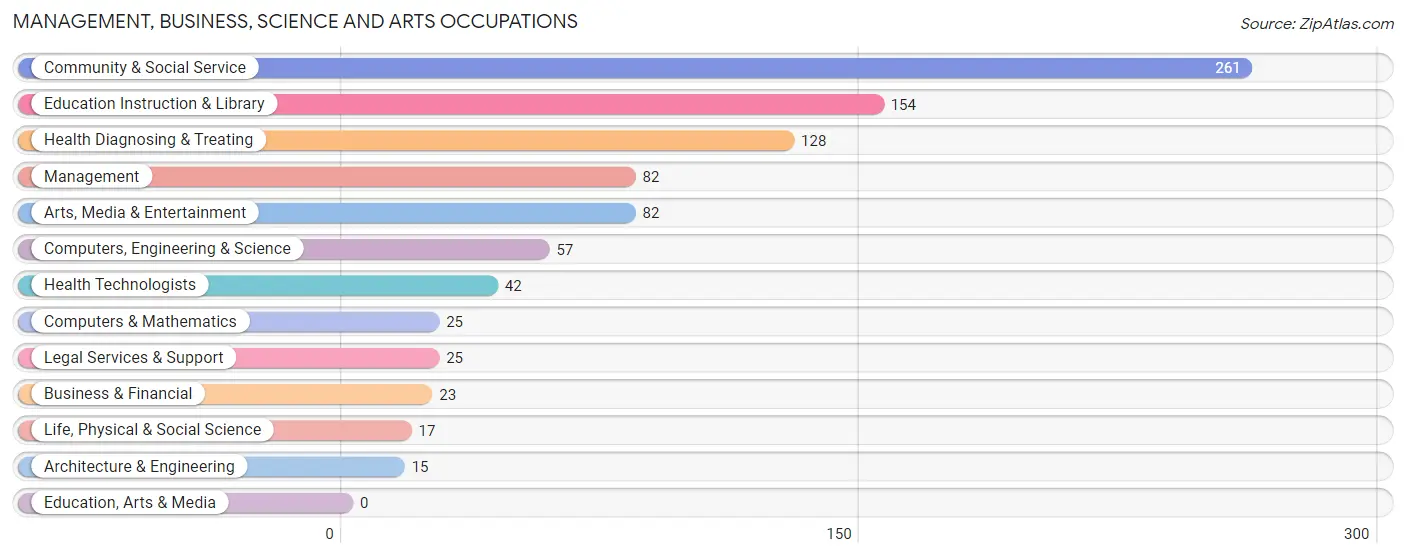
Management, Business, Science and Arts Occupations
The most common Management, Business, Science and Arts occupations in Fort Lewis are Community & Social Service (261 | 13.3%), Education Instruction & Library (154 | 7.8%), Health Diagnosing & Treating (128 | 6.5%), Management (82 | 4.2%), and Arts, Media & Entertainment (82 | 4.2%).
Management, Business, Science and Arts Occupations by Sex
Within the Management, Business, Science and Arts occupations in Fort Lewis, the most male-oriented occupations are Architecture & Engineering (100.0%), Life, Physical & Social Science (64.7%), and Computers, Engineering & Science (45.6%), while the most female-oriented occupations are Business & Financial (100.0%), Computers & Mathematics (100.0%), and Legal Services & Support (100.0%).
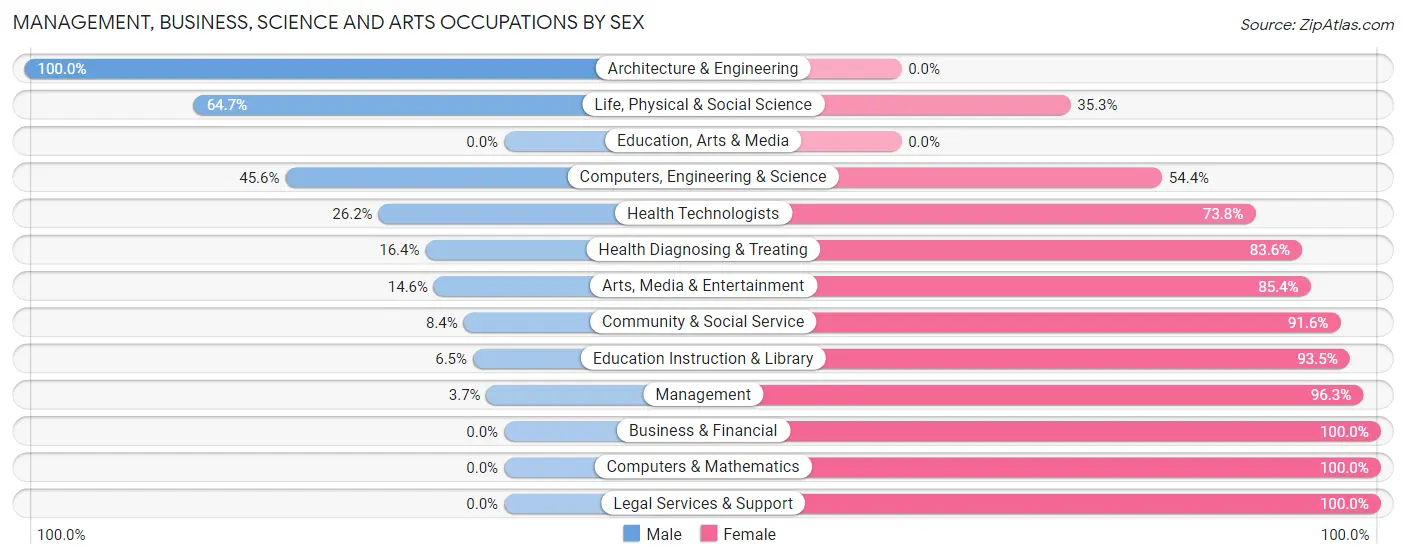
| Occupation | Male | Female |
| Management | 3 (3.7%) | 79 (96.3%) |
| Business & Financial | 0 (0.0%) | 23 (100.0%) |
| Computers, Engineering & Science | 26 (45.6%) | 31 (54.4%) |
| Computers & Mathematics | 0 (0.0%) | 25 (100.0%) |
| Architecture & Engineering | 15 (100.0%) | 0 (0.0%) |
| Life, Physical & Social Science | 11 (64.7%) | 6 (35.3%) |
| Community & Social Service | 22 (8.4%) | 239 (91.6%) |
| Education, Arts & Media | 0 (0.0%) | 0 (0.0%) |
| Legal Services & Support | 0 (0.0%) | 25 (100.0%) |
| Education Instruction & Library | 10 (6.5%) | 144 (93.5%) |
| Arts, Media & Entertainment | 12 (14.6%) | 70 (85.4%) |
| Health Diagnosing & Treating | 21 (16.4%) | 107 (83.6%) |
| Health Technologists | 11 (26.2%) | 31 (73.8%) |
| Total (Category) | 72 (13.1%) | 479 (86.9%) |
| Total (Overall) | 648 (33.0%) | 1,317 (67.0%) |
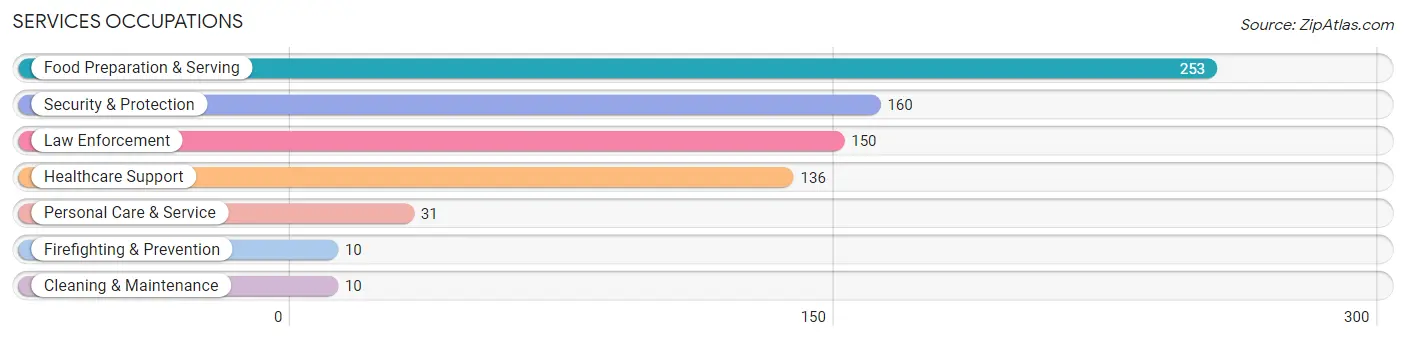
Services Occupations
The most common Services occupations in Fort Lewis are Food Preparation & Serving (253 | 12.9%), Security & Protection (160 | 8.1%), Law Enforcement (150 | 7.6%), Healthcare Support (136 | 6.9%), and Personal Care & Service (31 | 1.6%).
Services Occupations by Sex
Within the Services occupations in Fort Lewis, the most male-oriented occupations are Law Enforcement (100.0%), Security & Protection (93.8%), and Personal Care & Service (38.7%), while the most female-oriented occupations are Firefighting & Prevention (100.0%), Cleaning & Maintenance (100.0%), and Healthcare Support (89.7%).
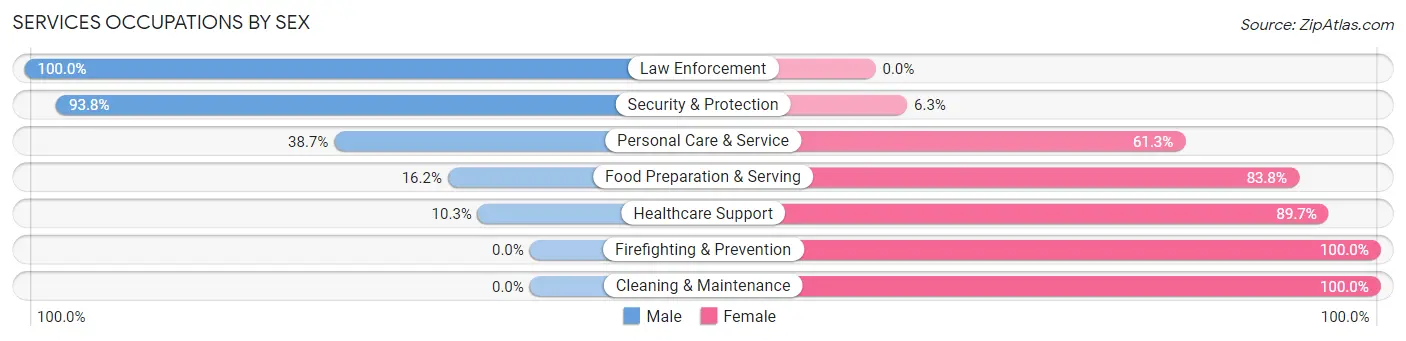
| Occupation | Male | Female |
| Healthcare Support | 14 (10.3%) | 122 (89.7%) |
| Security & Protection | 150 (93.8%) | 10 (6.2%) |
| Firefighting & Prevention | 0 (0.0%) | 10 (100.0%) |
| Law Enforcement | 150 (100.0%) | 0 (0.0%) |
| Food Preparation & Serving | 41 (16.2%) | 212 (83.8%) |
| Cleaning & Maintenance | 0 (0.0%) | 10 (100.0%) |
| Personal Care & Service | 12 (38.7%) | 19 (61.3%) |
| Total (Category) | 217 (36.8%) | 373 (63.2%) |
| Total (Overall) | 648 (33.0%) | 1,317 (67.0%) |
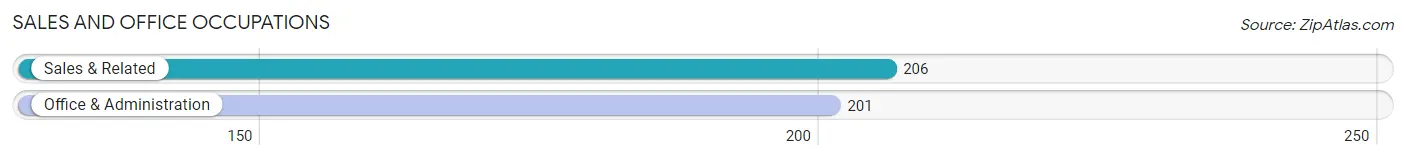
Sales and Office Occupations
The most common Sales and Office occupations in Fort Lewis are Sales & Related (206 | 10.5%), and Office & Administration (201 | 10.2%).
Sales and Office Occupations by Sex
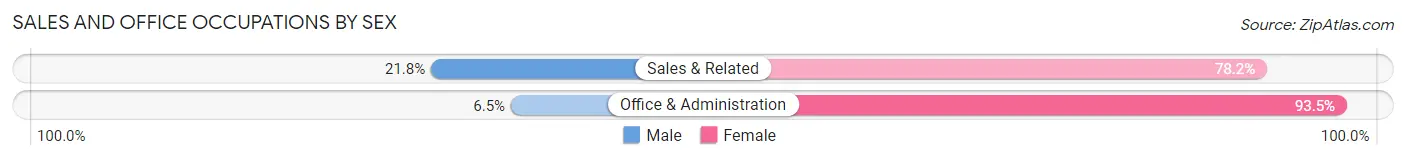
| Occupation | Male | Female |
| Sales & Related | 45 (21.8%) | 161 (78.2%) |
| Office & Administration | 13 (6.5%) | 188 (93.5%) |
| Total (Category) | 58 (14.2%) | 349 (85.8%) |
| Total (Overall) | 648 (33.0%) | 1,317 (67.0%) |
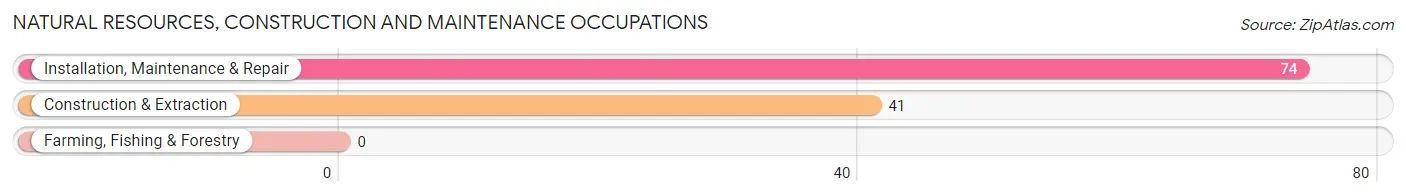
Natural Resources, Construction and Maintenance Occupations
The most common Natural Resources, Construction and Maintenance occupations in Fort Lewis are Installation, Maintenance & Repair (74 | 3.8%), and Construction & Extraction (41 | 2.1%).
Natural Resources, Construction and Maintenance Occupations by Sex
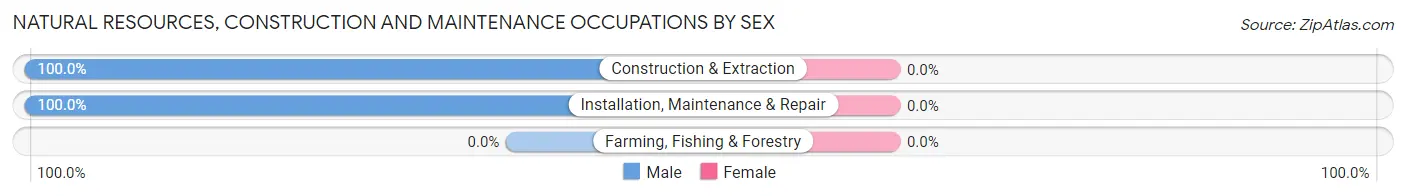
| Occupation | Male | Female |
| Farming, Fishing & Forestry | 0 (0.0%) | 0 (0.0%) |
| Construction & Extraction | 41 (100.0%) | 0 (0.0%) |
| Installation, Maintenance & Repair | 74 (100.0%) | 0 (0.0%) |
| Total (Category) | 115 (100.0%) | 0 (0.0%) |
| Total (Overall) | 648 (33.0%) | 1,317 (67.0%) |
Production, Transportation and Moving Occupations
The most common Production, Transportation and Moving occupations in Fort Lewis are Material Moving (157 | 8.0%), Production (117 | 5.9%), and Transportation (28 | 1.4%).
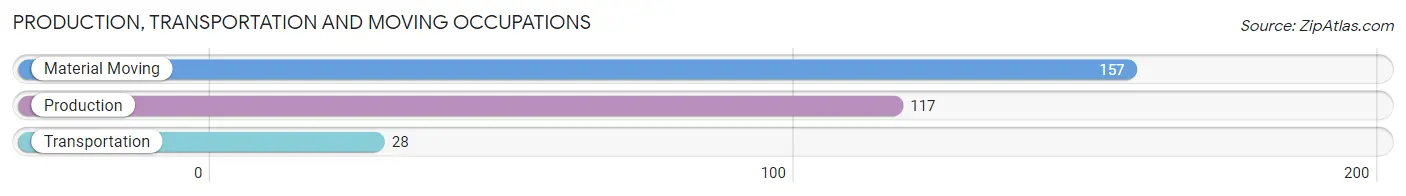
Production, Transportation and Moving Occupations by Sex
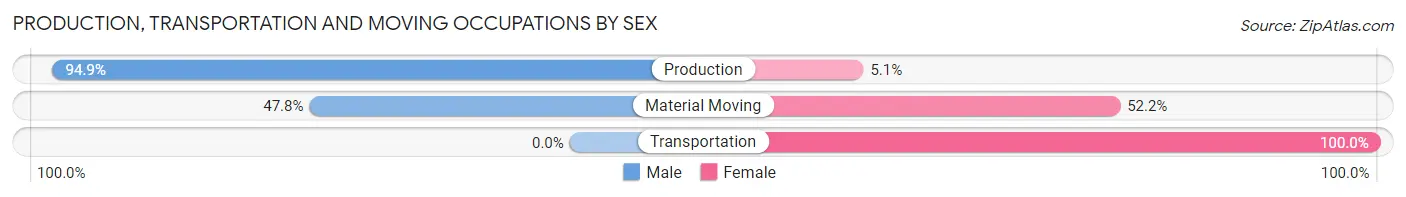
| Occupation | Male | Female |
| Production | 111 (94.9%) | 6 (5.1%) |
| Transportation | 0 (0.0%) | 28 (100.0%) |
| Material Moving | 75 (47.8%) | 82 (52.2%) |
| Total (Category) | 186 (61.6%) | 116 (38.4%) |
| Total (Overall) | 648 (33.0%) | 1,317 (67.0%) |
Employment Industries by Sex in Fort Lewis
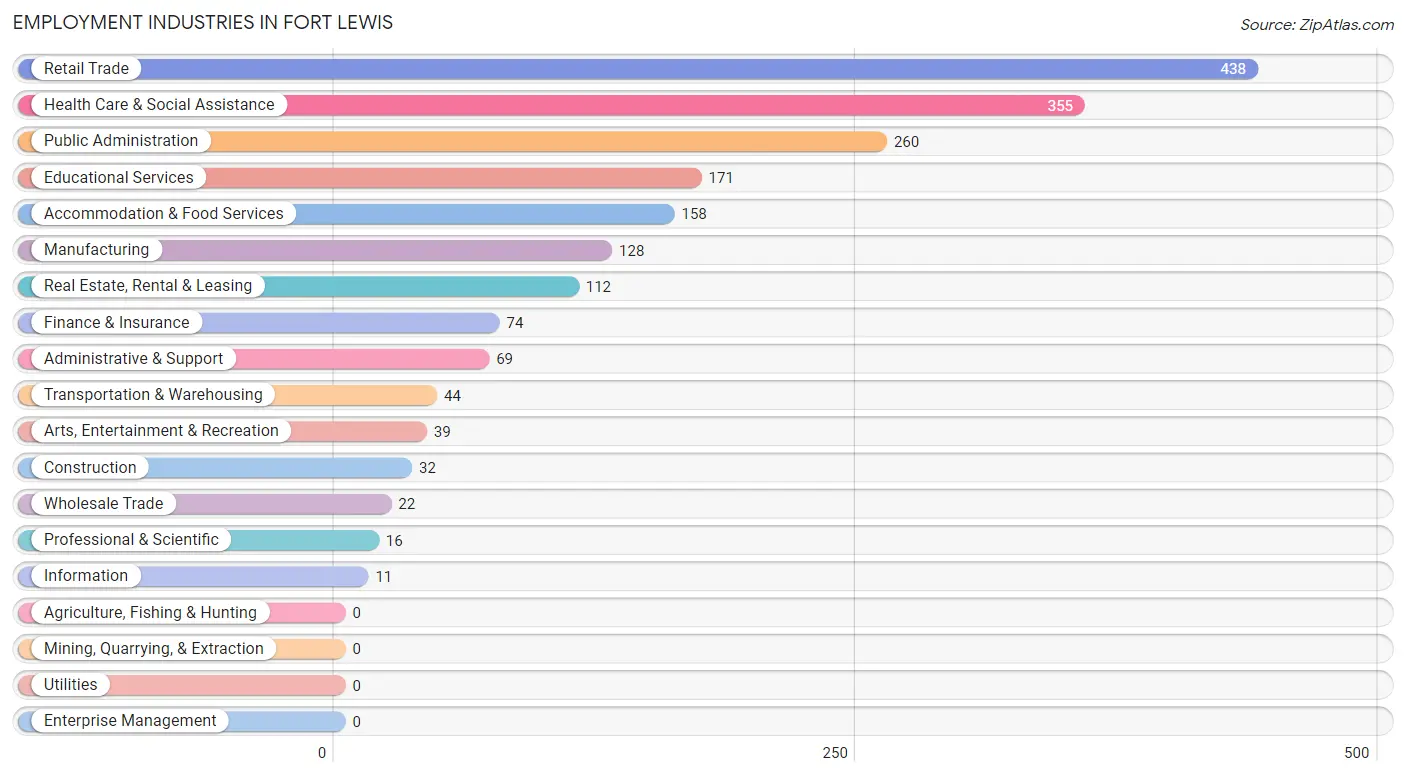
Employment Industries in Fort Lewis
The major employment industries in Fort Lewis include Retail Trade (438 | 22.3%), Health Care & Social Assistance (355 | 18.1%), Public Administration (260 | 13.2%), Educational Services (171 | 8.7%), and Accommodation & Food Services (158 | 8.0%).
Employment Industries by Sex in Fort Lewis
The Fort Lewis industries that see more men than women are Construction (100.0%), Information (100.0%), and Manufacturing (93.0%), whereas the industries that tend to have a higher number of women are Transportation & Warehousing (100.0%), Finance & Insurance (100.0%), and Professional & Scientific (100.0%).
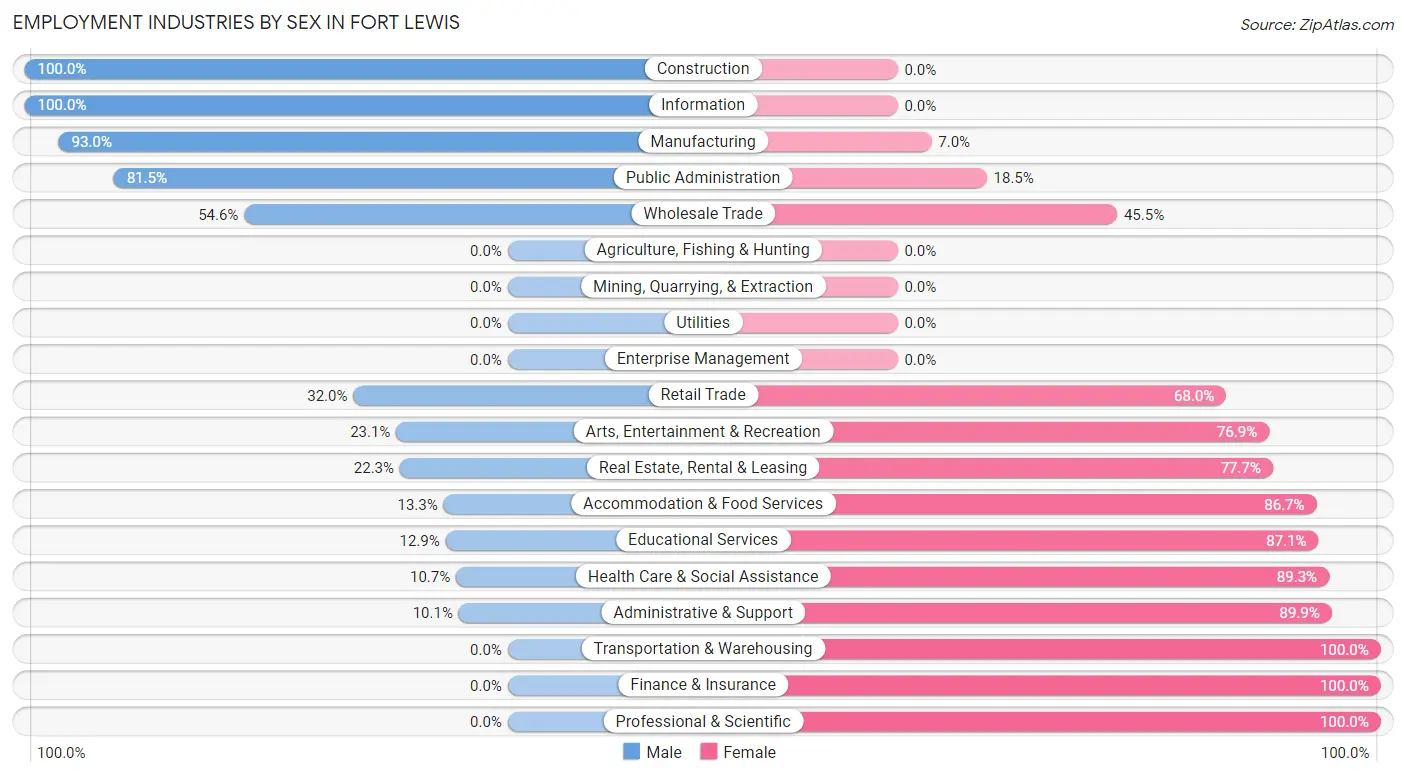
| Industry | Male | Female |
| Agriculture, Fishing & Hunting | 0 (0.0%) | 0 (0.0%) |
| Mining, Quarrying, & Extraction | 0 (0.0%) | 0 (0.0%) |
| Construction | 32 (100.0%) | 0 (0.0%) |
| Manufacturing | 119 (93.0%) | 9 (7.0%) |
| Wholesale Trade | 12 (54.5%) | 10 (45.5%) |
| Retail Trade | 140 (32.0%) | 298 (68.0%) |
| Transportation & Warehousing | 0 (0.0%) | 44 (100.0%) |
| Utilities | 0 (0.0%) | 0 (0.0%) |
| Information | 11 (100.0%) | 0 (0.0%) |
| Finance & Insurance | 0 (0.0%) | 74 (100.0%) |
| Real Estate, Rental & Leasing | 25 (22.3%) | 87 (77.7%) |
| Professional & Scientific | 0 (0.0%) | 16 (100.0%) |
| Enterprise Management | 0 (0.0%) | 0 (0.0%) |
| Administrative & Support | 7 (10.1%) | 62 (89.9%) |
| Educational Services | 22 (12.9%) | 149 (87.1%) |
| Health Care & Social Assistance | 38 (10.7%) | 317 (89.3%) |
| Arts, Entertainment & Recreation | 9 (23.1%) | 30 (76.9%) |
| Accommodation & Food Services | 21 (13.3%) | 137 (86.7%) |
| Public Administration | 212 (81.5%) | 48 (18.5%) |
| Total | 648 (33.0%) | 1,317 (67.0%) |
Education in Fort Lewis
School Enrollment in Fort Lewis
The most common levels of schooling among the 2,686 students in Fort Lewis are college / undergraduate (858 | 31.9%), elementary school (554 | 20.6%), and middle school (461 | 17.2%).
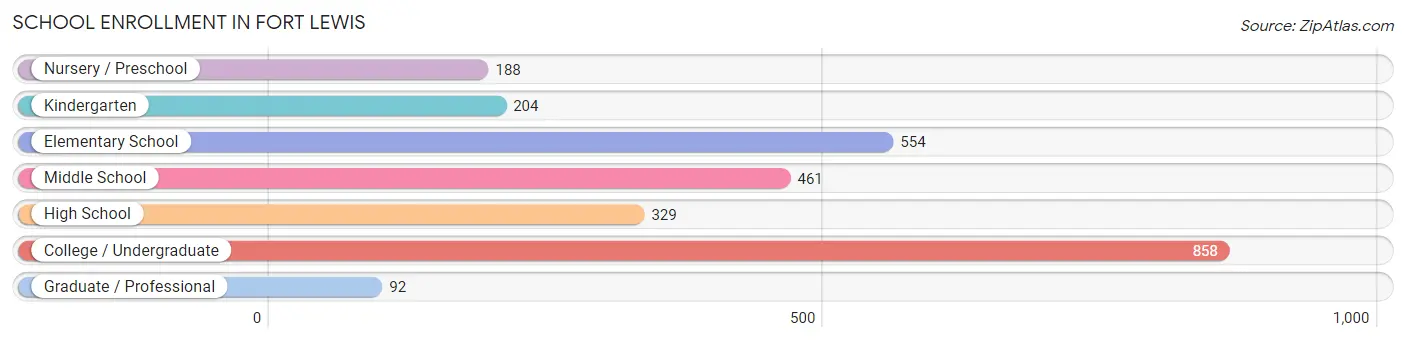
| School Level | # Students | % Students |
| Nursery / Preschool | 188 | 7.0% |
| Kindergarten | 204 | 7.6% |
| Elementary School | 554 | 20.6% |
| Middle School | 461 | 17.2% |
| High School | 329 | 12.2% |
| College / Undergraduate | 858 | 31.9% |
| Graduate / Professional | 92 | 3.4% |
| Total | 2,686 | 100.0% |
School Enrollment by Age by Funding Source in Fort Lewis
Out of a total of 2,686 students who are enrolled in schools in Fort Lewis, 752 (28.0%) attend a private institution, while the remaining 1,934 (72.0%) are enrolled in public schools. The age group of 10 to 14 year olds has the highest likelihood of being enrolled in private schools, with 281 (49.2% in the age bracket) enrolled. Conversely, the age group of 35 years and over has the lowest likelihood of being enrolled in a private school, with 12 (100.0% in the age bracket) attending a public institution.
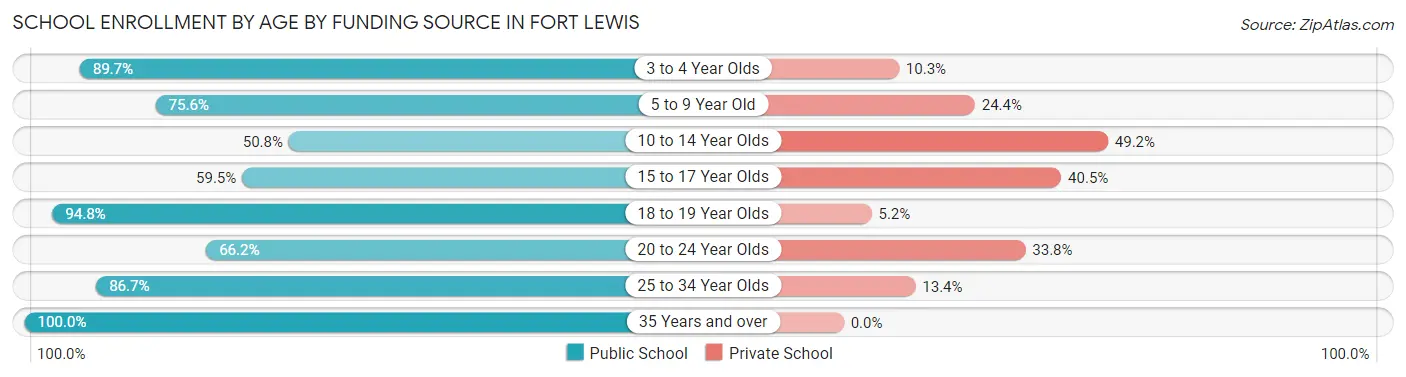
| Age Bracket | Public School | Private School |
| 3 to 4 Year Olds | 157 (89.7%) | 18 (10.3%) |
| 5 to 9 Year Old | 520 (75.6%) | 168 (24.4%) |
| 10 to 14 Year Olds | 290 (50.8%) | 281 (49.2%) |
| 15 to 17 Year Olds | 94 (59.5%) | 64 (40.5%) |
| 18 to 19 Year Olds | 201 (94.8%) | 11 (5.2%) |
| 20 to 24 Year Olds | 303 (66.2%) | 155 (33.8%) |
| 25 to 34 Year Olds | 357 (86.7%) | 55 (13.4%) |
| 35 Years and over | 12 (100.0%) | 0 (0.0%) |
| Total | 1,934 (72.0%) | 752 (28.0%) |
Educational Attainment by Field of Study in Fort Lewis
Social sciences (177 | 13.5%), literature & languages (175 | 13.3%), business (154 | 11.7%), liberal arts & history (122 | 9.3%), and visual & performing arts (114 | 8.7%) are the most common fields of study among 1,315 individuals in Fort Lewis who have obtained a bachelor's degree or higher.
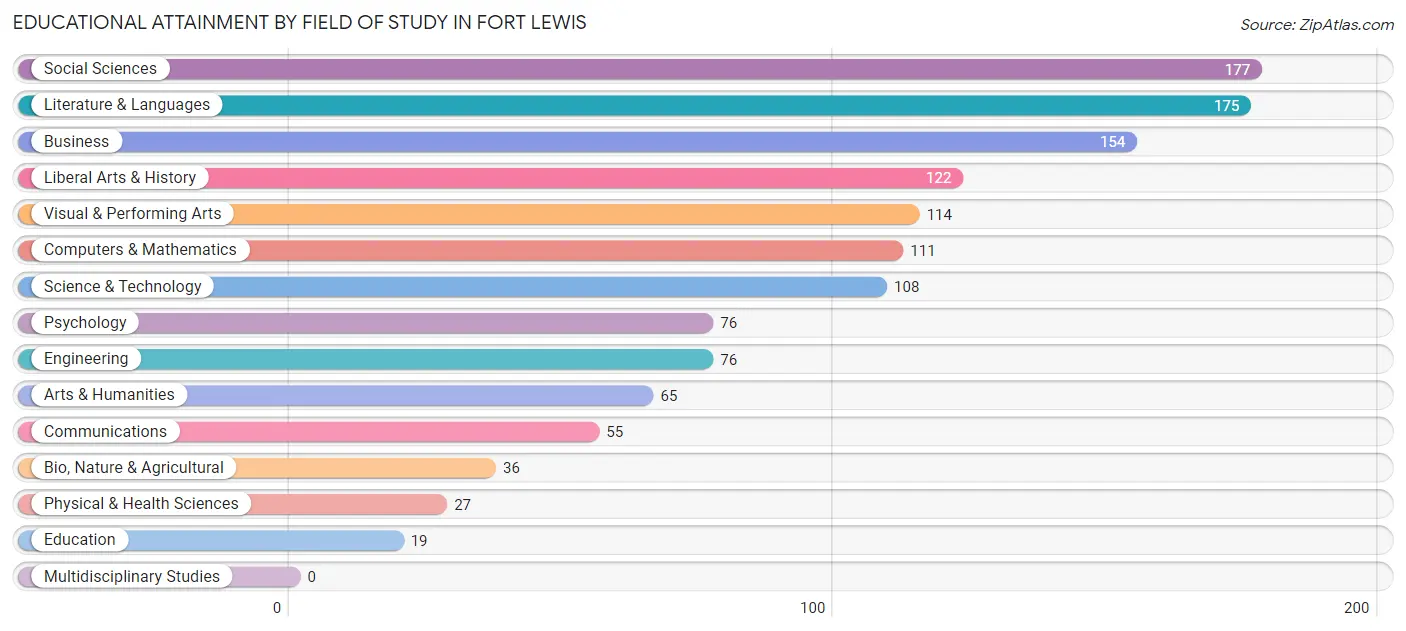
| Field of Study | # Graduates | % Graduates |
| Computers & Mathematics | 111 | 8.4% |
| Bio, Nature & Agricultural | 36 | 2.7% |
| Physical & Health Sciences | 27 | 2.1% |
| Psychology | 76 | 5.8% |
| Social Sciences | 177 | 13.5% |
| Engineering | 76 | 5.8% |
| Multidisciplinary Studies | 0 | 0.0% |
| Science & Technology | 108 | 8.2% |
| Business | 154 | 11.7% |
| Education | 19 | 1.4% |
| Literature & Languages | 175 | 13.3% |
| Liberal Arts & History | 122 | 9.3% |
| Visual & Performing Arts | 114 | 8.7% |
| Communications | 55 | 4.2% |
| Arts & Humanities | 65 | 4.9% |
| Total | 1,315 | 100.0% |
Transportation & Commute in Fort Lewis
Vehicle Availability by Sex in Fort Lewis
The most prevalent vehicle ownership categories in Fort Lewis are males with 2 vehicles (1,622, accounting for 58.6%) and females with 2 vehicles (870, making up 114.9%).
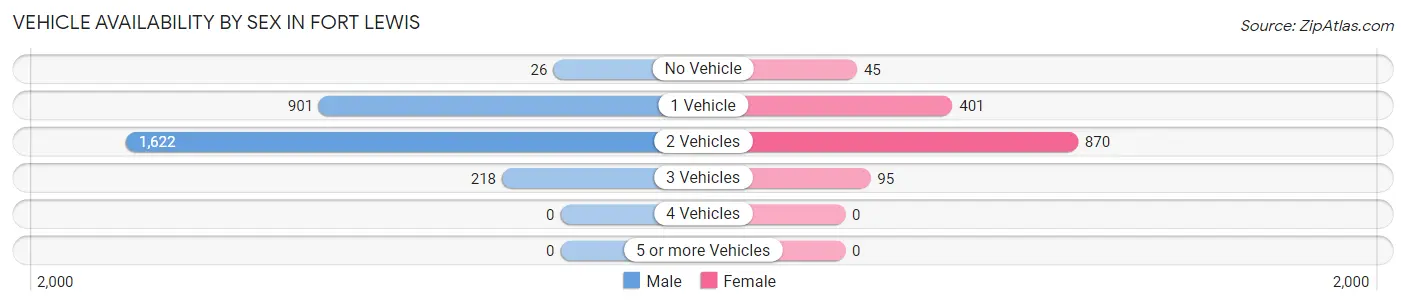
| Vehicles Available | Male | Female |
| No Vehicle | 26 (0.9%) | 45 (3.2%) |
| 1 Vehicle | 901 (32.6%) | 401 (28.4%) |
| 2 Vehicles | 1,622 (58.6%) | 870 (61.7%) |
| 3 Vehicles | 218 (7.9%) | 95 (6.7%) |
| 4 Vehicles | 0 (0.0%) | 0 (0.0%) |
| 5 or more Vehicles | 0 (0.0%) | 0 (0.0%) |
| Total | 2,767 (100.0%) | 1,411 (100.0%) |
Commute Time in Fort Lewis
The most frequently occuring commute durations in Fort Lewis are 5 to 9 minutes (2,915 commuters, 39.9%), 10 to 14 minutes (1,544 commuters, 21.1%), and less than 5 minutes (830 commuters, 11.4%).
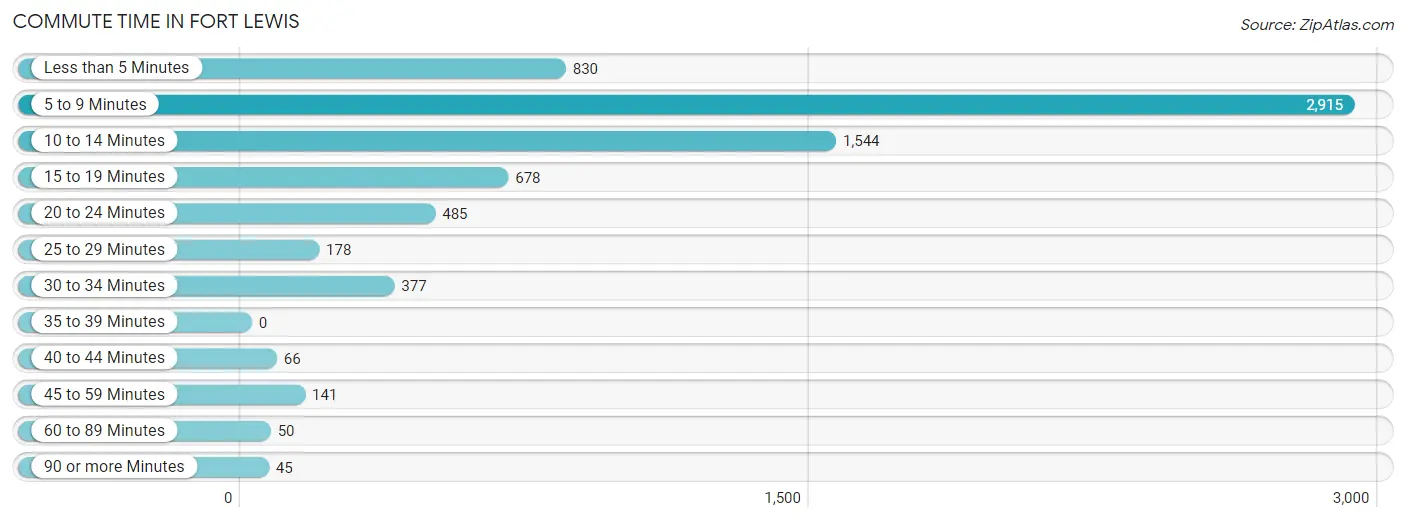
| Commute Time | # Commuters | % Commuters |
| Less than 5 Minutes | 830 | 11.4% |
| 5 to 9 Minutes | 2,915 | 39.9% |
| 10 to 14 Minutes | 1,544 | 21.1% |
| 15 to 19 Minutes | 678 | 9.3% |
| 20 to 24 Minutes | 485 | 6.6% |
| 25 to 29 Minutes | 178 | 2.4% |
| 30 to 34 Minutes | 377 | 5.2% |
| 35 to 39 Minutes | 0 | 0.0% |
| 40 to 44 Minutes | 66 | 0.9% |
| 45 to 59 Minutes | 141 | 1.9% |
| 60 to 89 Minutes | 50 | 0.7% |
| 90 or more Minutes | 45 | 0.6% |
Commute Time by Sex in Fort Lewis
The most common commute times in Fort Lewis are 5 to 9 minutes (2,358 commuters, 42.8%) for males and 5 to 9 minutes (557 commuters, 31.0%) for females.
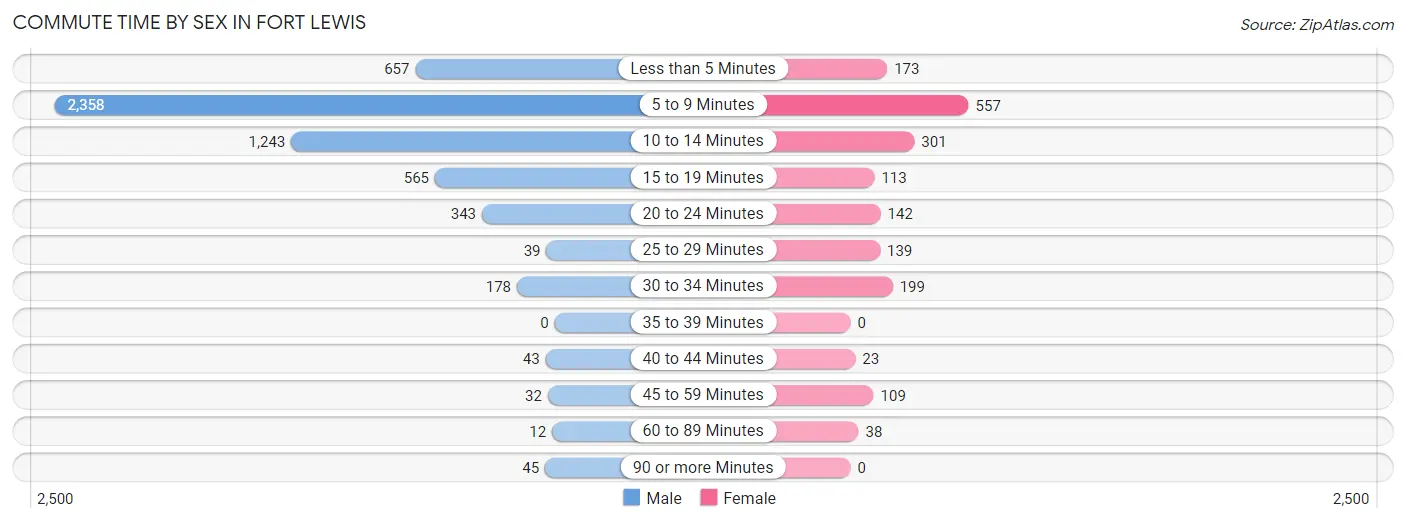
| Commute Time | Male | Female |
| Less than 5 Minutes | 657 (11.9%) | 173 (9.6%) |
| 5 to 9 Minutes | 2,358 (42.8%) | 557 (31.0%) |
| 10 to 14 Minutes | 1,243 (22.5%) | 301 (16.8%) |
| 15 to 19 Minutes | 565 (10.2%) | 113 (6.3%) |
| 20 to 24 Minutes | 343 (6.2%) | 142 (7.9%) |
| 25 to 29 Minutes | 39 (0.7%) | 139 (7.7%) |
| 30 to 34 Minutes | 178 (3.2%) | 199 (11.1%) |
| 35 to 39 Minutes | 0 (0.0%) | 0 (0.0%) |
| 40 to 44 Minutes | 43 (0.8%) | 23 (1.3%) |
| 45 to 59 Minutes | 32 (0.6%) | 109 (6.1%) |
| 60 to 89 Minutes | 12 (0.2%) | 38 (2.1%) |
| 90 or more Minutes | 45 (0.8%) | 0 (0.0%) |
Time of Departure to Work by Sex in Fort Lewis
The most frequent times of departure to work in Fort Lewis are 5:30 AM to 5:59 AM (1,675, 30.4%) for males and 6:00 AM to 6:29 AM (279, 15.5%) for females.
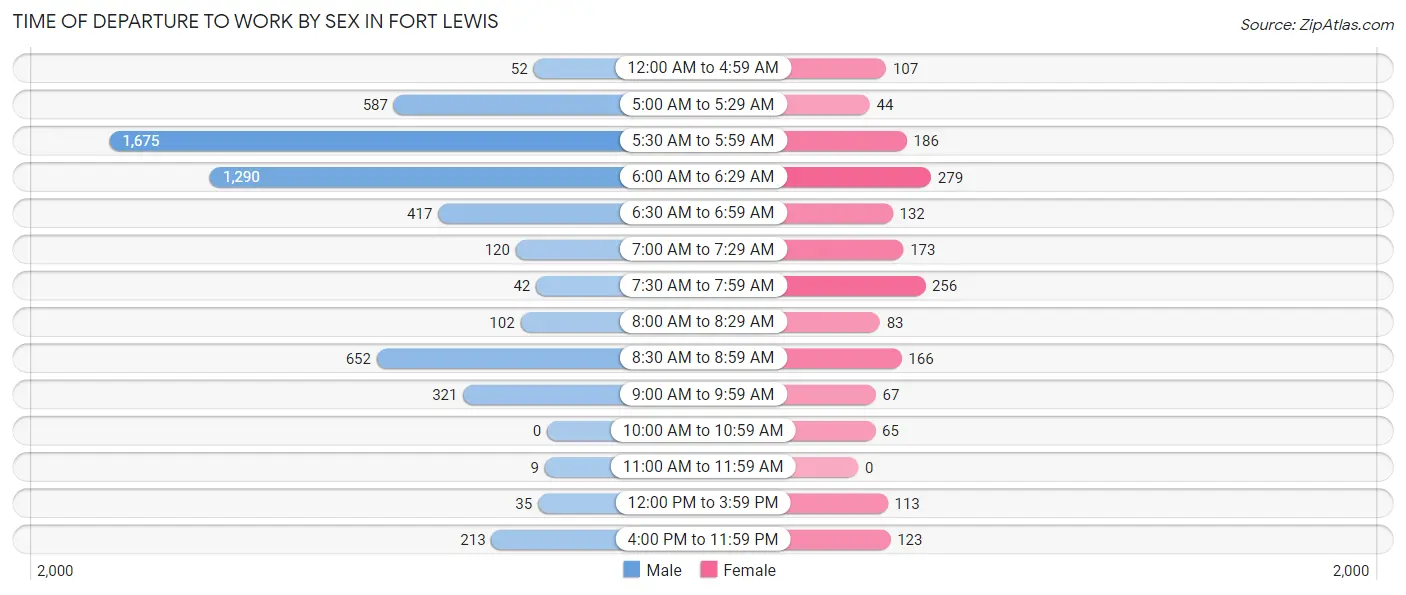
| Time of Departure | Male | Female |
| 12:00 AM to 4:59 AM | 52 (0.9%) | 107 (6.0%) |
| 5:00 AM to 5:29 AM | 587 (10.6%) | 44 (2.5%) |
| 5:30 AM to 5:59 AM | 1,675 (30.4%) | 186 (10.4%) |
| 6:00 AM to 6:29 AM | 1,290 (23.4%) | 279 (15.5%) |
| 6:30 AM to 6:59 AM | 417 (7.6%) | 132 (7.4%) |
| 7:00 AM to 7:29 AM | 120 (2.2%) | 173 (9.6%) |
| 7:30 AM to 7:59 AM | 42 (0.8%) | 256 (14.3%) |
| 8:00 AM to 8:29 AM | 102 (1.8%) | 83 (4.6%) |
| 8:30 AM to 8:59 AM | 652 (11.8%) | 166 (9.2%) |
| 9:00 AM to 9:59 AM | 321 (5.8%) | 67 (3.7%) |
| 10:00 AM to 10:59 AM | 0 (0.0%) | 65 (3.6%) |
| 11:00 AM to 11:59 AM | 9 (0.2%) | 0 (0.0%) |
| 12:00 PM to 3:59 PM | 35 (0.6%) | 113 (6.3%) |
| 4:00 PM to 11:59 PM | 213 (3.9%) | 123 (6.9%) |
| Total | 5,515 (100.0%) | 1,794 (100.0%) |
Housing Occupancy in Fort Lewis
Occupancy by Ownership in Fort Lewis
Of the total 3,214 dwellings in Fort Lewis, owner-occupied units account for 46 (1.4%), while renter-occupied units make up 3,168 (98.6%).
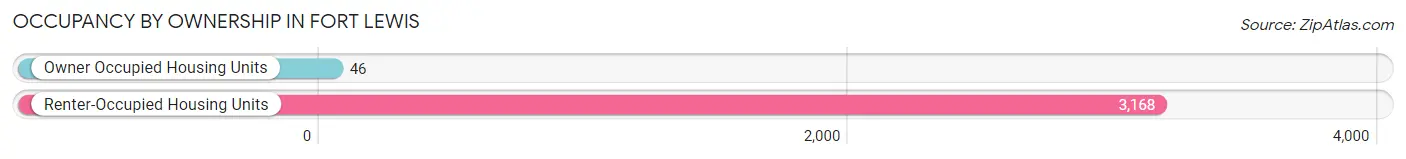
| Occupancy | # Housing Units | % Housing Units |
| Owner Occupied Housing Units | 46 | 1.4% |
| Renter-Occupied Housing Units | 3,168 | 98.6% |
| Total Occupied Housing Units | 3,214 | 100.0% |
Occupancy by Household Size in Fort Lewis
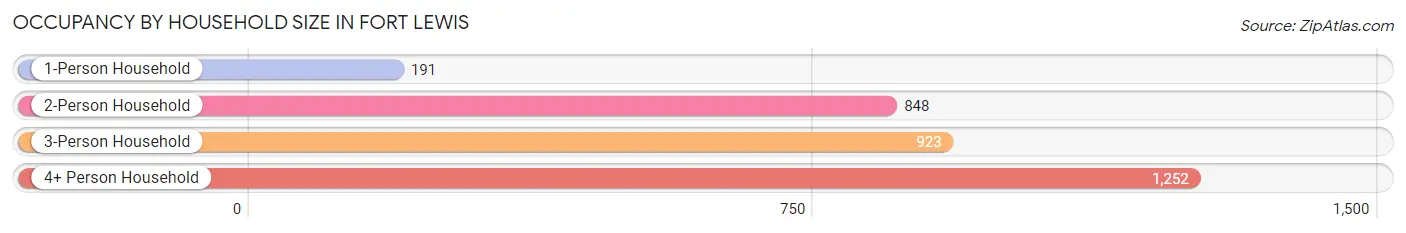
| Household Size | # Housing Units | % Housing Units |
| 1-Person Household | 191 | 5.9% |
| 2-Person Household | 848 | 26.4% |
| 3-Person Household | 923 | 28.7% |
| 4+ Person Household | 1,252 | 39.0% |
| Total Housing Units | 3,214 | 100.0% |
Occupancy by Ownership by Household Size in Fort Lewis
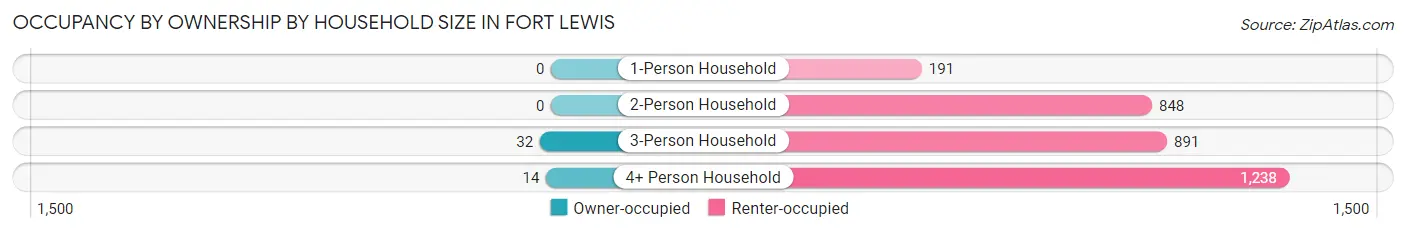
| Household Size | Owner-occupied | Renter-occupied |
| 1-Person Household | 0 (0.0%) | 191 (100.0%) |
| 2-Person Household | 0 (0.0%) | 848 (100.0%) |
| 3-Person Household | 32 (3.5%) | 891 (96.5%) |
| 4+ Person Household | 14 (1.1%) | 1,238 (98.9%) |
| Total Housing Units | 46 (1.4%) | 3,168 (98.6%) |
Occupancy by Educational Attainment in Fort Lewis
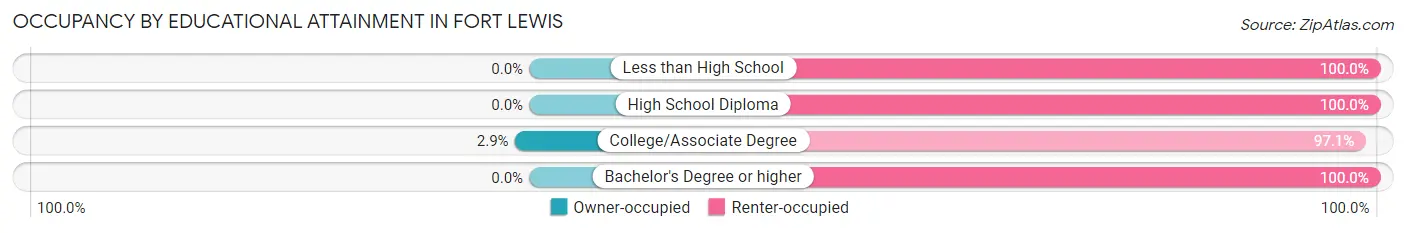
| Household Size | Owner-occupied | Renter-occupied |
| Less than High School | 0 (0.0%) | 157 (100.0%) |
| High School Diploma | 0 (0.0%) | 1,007 (100.0%) |
| College/Associate Degree | 46 (2.9%) | 1,554 (97.1%) |
| Bachelor's Degree or higher | 0 (0.0%) | 450 (100.0%) |
Occupancy by Age of Householder in Fort Lewis
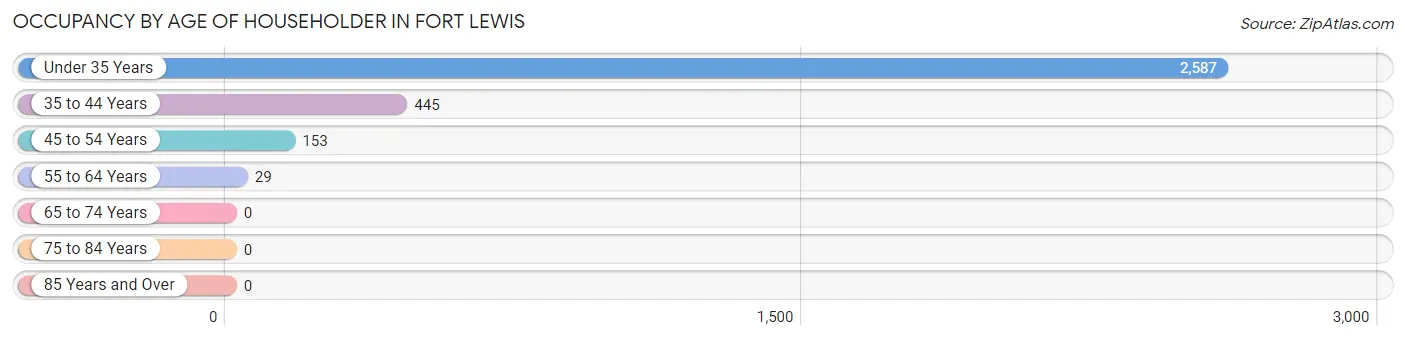
| Age Bracket | # Households | % Households |
| Under 35 Years | 2,587 | 80.5% |
| 35 to 44 Years | 445 | 13.9% |
| 45 to 54 Years | 153 | 4.8% |
| 55 to 64 Years | 29 | 0.9% |
| 65 to 74 Years | 0 | 0.0% |
| 75 to 84 Years | 0 | 0.0% |
| 85 Years and Over | 0 | 0.0% |
| Total | 3,214 | 100.0% |
Housing Finances in Fort Lewis
Median Income by Occupancy in Fort Lewis
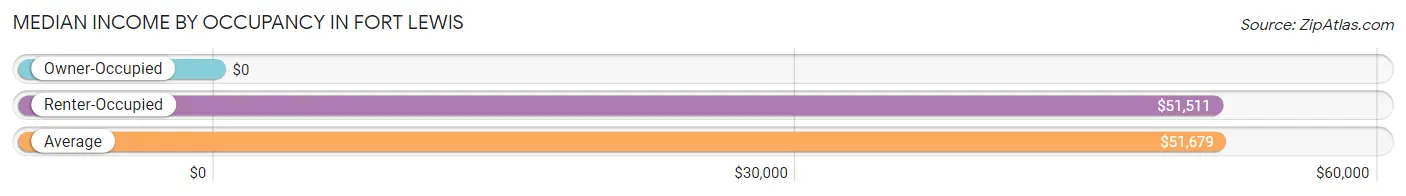
| Occupancy Type | # Households | Median Income |
| Owner-Occupied | 46 (1.4%) | $0 |
| Renter-Occupied | 3,168 (98.6%) | $51,511 |
| Average | 3,214 (100.0%) | $51,679 |
Occupancy by Householder Income Bracket in Fort Lewis
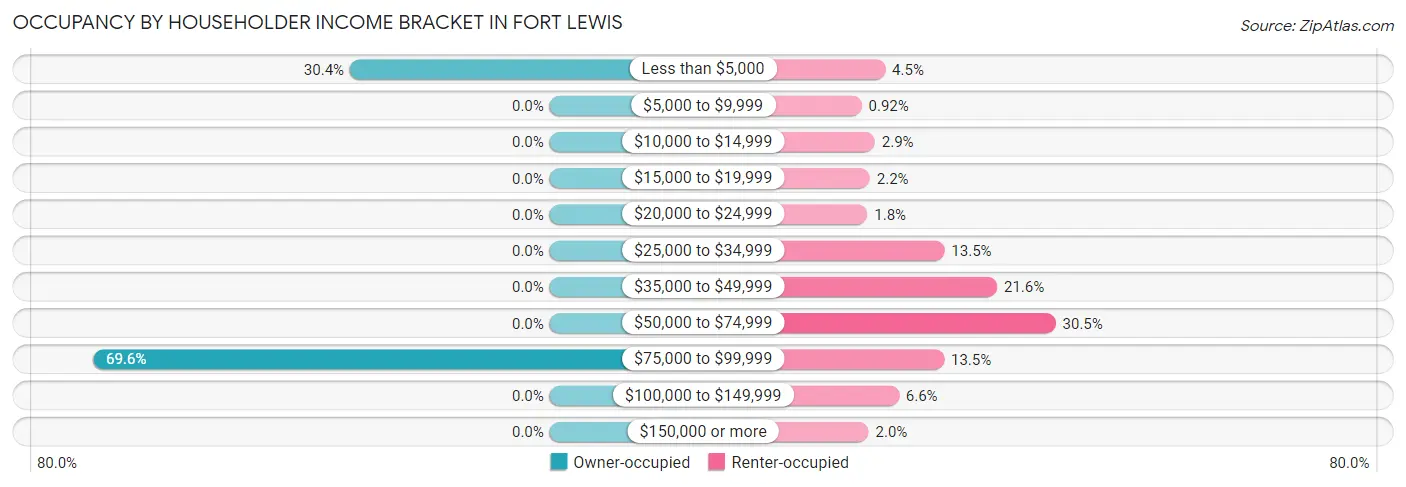
| Income Bracket | Owner-occupied | Renter-occupied |
| Less than $5,000 | 14 (30.4%) | 143 (4.5%) |
| $5,000 to $9,999 | 0 (0.0%) | 29 (0.9%) |
| $10,000 to $14,999 | 0 (0.0%) | 93 (2.9%) |
| $15,000 to $19,999 | 0 (0.0%) | 69 (2.2%) |
| $20,000 to $24,999 | 0 (0.0%) | 57 (1.8%) |
| $25,000 to $34,999 | 0 (0.0%) | 429 (13.5%) |
| $35,000 to $49,999 | 0 (0.0%) | 683 (21.6%) |
| $50,000 to $74,999 | 0 (0.0%) | 966 (30.5%) |
| $75,000 to $99,999 | 32 (69.6%) | 427 (13.5%) |
| $100,000 to $149,999 | 0 (0.0%) | 209 (6.6%) |
| $150,000 or more | 0 (0.0%) | 63 (2.0%) |
| Total | 46 (100.0%) | 3,168 (100.0%) |
Monthly Housing Cost Tiers in Fort Lewis
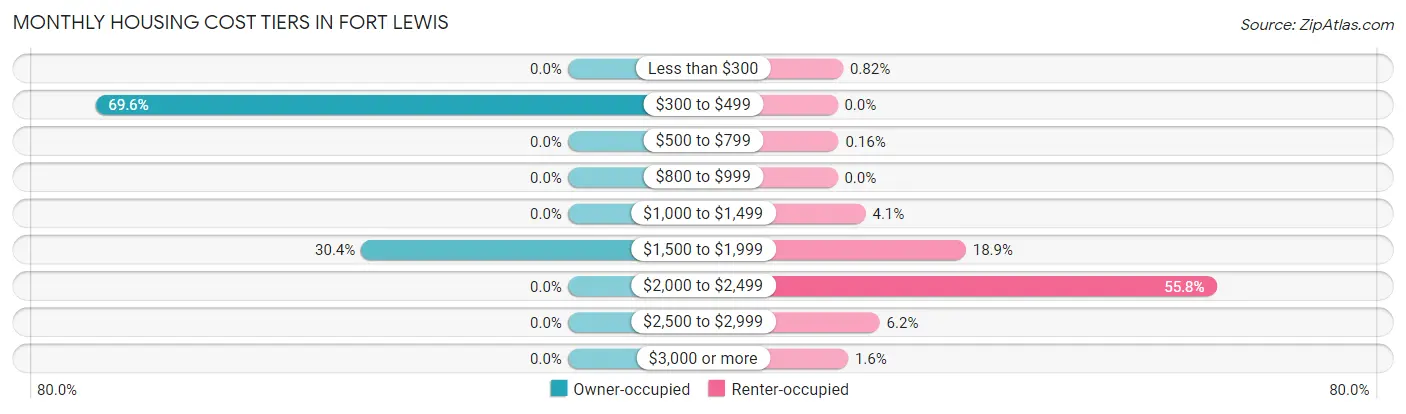
| Monthly Cost | Owner-occupied | Renter-occupied |
| Less than $300 | 0 (0.0%) | 26 (0.8%) |
| $300 to $499 | 32 (69.6%) | 0 (0.0%) |
| $500 to $799 | 0 (0.0%) | 5 (0.2%) |
| $800 to $999 | 0 (0.0%) | 0 (0.0%) |
| $1,000 to $1,499 | 0 (0.0%) | 131 (4.1%) |
| $1,500 to $1,999 | 14 (30.4%) | 599 (18.9%) |
| $2,000 to $2,499 | 0 (0.0%) | 1,768 (55.8%) |
| $2,500 to $2,999 | 0 (0.0%) | 197 (6.2%) |
| $3,000 or more | 0 (0.0%) | 49 (1.5%) |
| Total | 46 (100.0%) | 3,168 (100.0%) |
Physical Housing Characteristics in Fort Lewis
Housing Structures in Fort Lewis
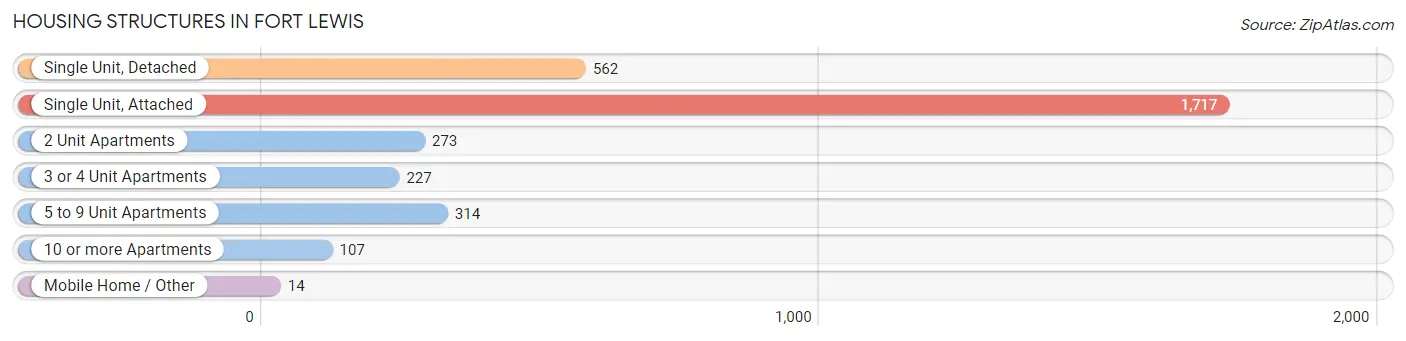
| Structure Type | # Housing Units | % Housing Units |
| Single Unit, Detached | 562 | 17.5% |
| Single Unit, Attached | 1,717 | 53.4% |
| 2 Unit Apartments | 273 | 8.5% |
| 3 or 4 Unit Apartments | 227 | 7.1% |
| 5 to 9 Unit Apartments | 314 | 9.8% |
| 10 or more Apartments | 107 | 3.3% |
| Mobile Home / Other | 14 | 0.4% |
| Total | 3,214 | 100.0% |
Housing Structures by Occupancy in Fort Lewis
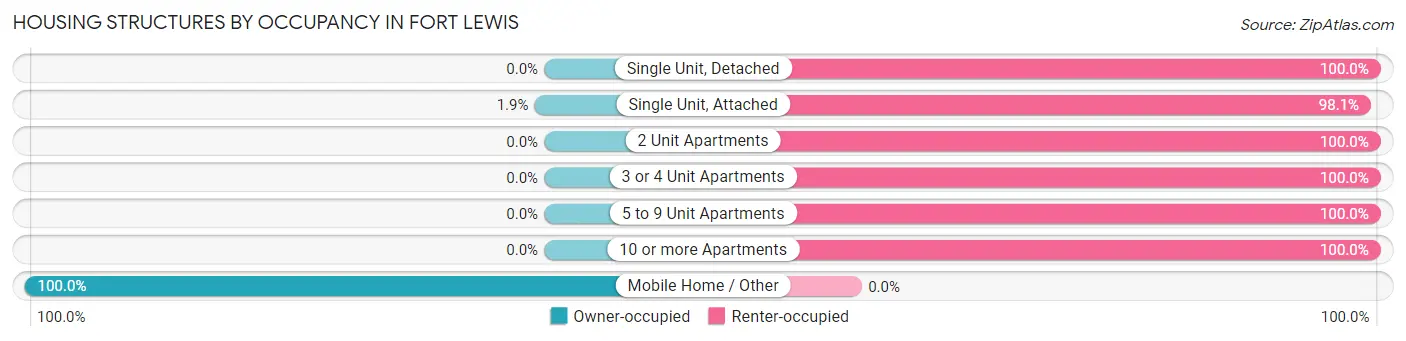
| Structure Type | Owner-occupied | Renter-occupied |
| Single Unit, Detached | 0 (0.0%) | 562 (100.0%) |
| Single Unit, Attached | 32 (1.9%) | 1,685 (98.1%) |
| 2 Unit Apartments | 0 (0.0%) | 273 (100.0%) |
| 3 or 4 Unit Apartments | 0 (0.0%) | 227 (100.0%) |
| 5 to 9 Unit Apartments | 0 (0.0%) | 314 (100.0%) |
| 10 or more Apartments | 0 (0.0%) | 107 (100.0%) |
| Mobile Home / Other | 14 (100.0%) | 0 (0.0%) |
| Total | 46 (1.4%) | 3,168 (98.6%) |
Housing Structures by Number of Rooms in Fort Lewis
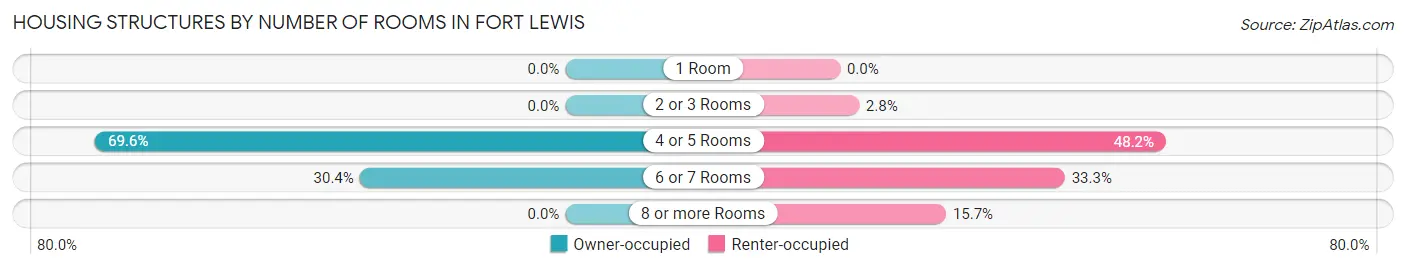
| Number of Rooms | Owner-occupied | Renter-occupied |
| 1 Room | 0 (0.0%) | 0 (0.0%) |
| 2 or 3 Rooms | 0 (0.0%) | 89 (2.8%) |
| 4 or 5 Rooms | 32 (69.6%) | 1,528 (48.2%) |
| 6 or 7 Rooms | 14 (30.4%) | 1,054 (33.3%) |
| 8 or more Rooms | 0 (0.0%) | 497 (15.7%) |
| Total | 46 (100.0%) | 3,168 (100.0%) |
Housing Structure by Heating Type in Fort Lewis
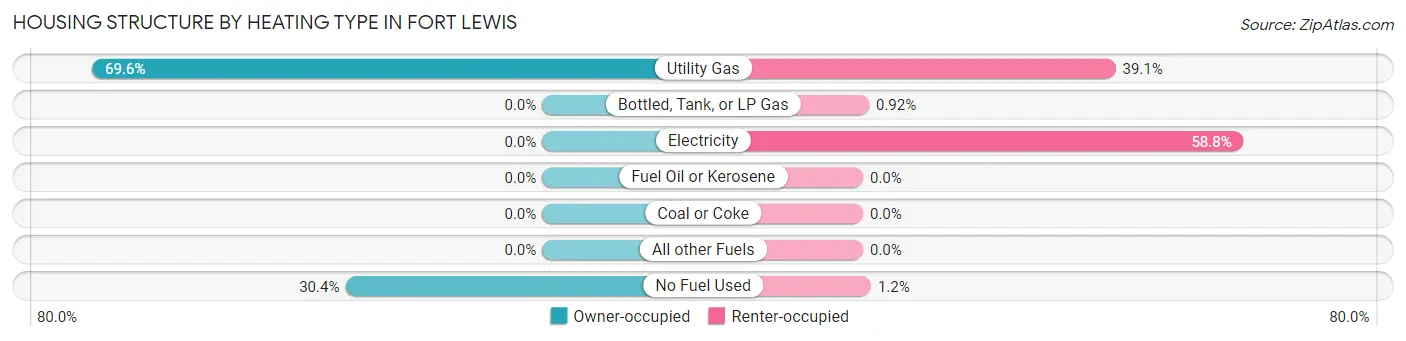
| Heating Type | Owner-occupied | Renter-occupied |
| Utility Gas | 32 (69.6%) | 1,237 (39.1%) |
| Bottled, Tank, or LP Gas | 0 (0.0%) | 29 (0.9%) |
| Electricity | 0 (0.0%) | 1,863 (58.8%) |
| Fuel Oil or Kerosene | 0 (0.0%) | 0 (0.0%) |
| Coal or Coke | 0 (0.0%) | 0 (0.0%) |
| All other Fuels | 0 (0.0%) | 0 (0.0%) |
| No Fuel Used | 14 (30.4%) | 39 (1.2%) |
| Total | 46 (100.0%) | 3,168 (100.0%) |
Household Vehicle Usage in Fort Lewis
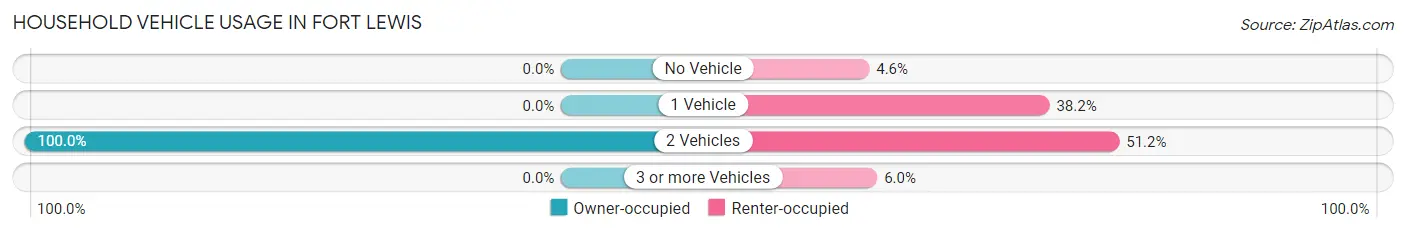
| Vehicles per Household | Owner-occupied | Renter-occupied |
| No Vehicle | 0 (0.0%) | 144 (4.5%) |
| 1 Vehicle | 0 (0.0%) | 1,210 (38.2%) |
| 2 Vehicles | 46 (100.0%) | 1,623 (51.2%) |
| 3 or more Vehicles | 0 (0.0%) | 191 (6.0%) |
| Total | 46 (100.0%) | 3,168 (100.0%) |
Real Estate & Mortgages in Fort Lewis
Real Estate and Mortgage Overview in Fort Lewis
| Characteristic | Without Mortgage | With Mortgage |
| Housing Units | 32 | 14 |
| Median Property Value | - | - |
| Median Household Income | - | - |
| Monthly Housing Costs | - | - |
| Real Estate Taxes | - | - |
Property Value by Mortgage Status in Fort Lewis
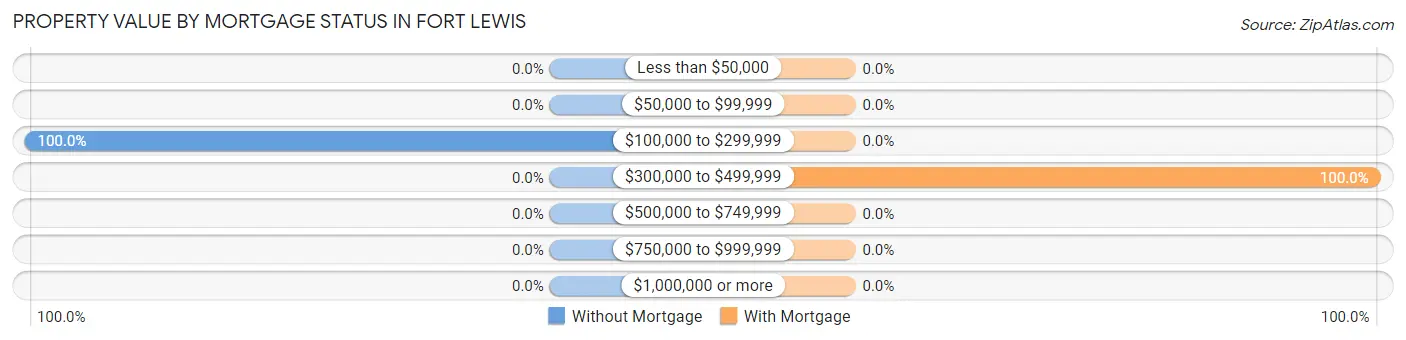
| Property Value | Without Mortgage | With Mortgage |
| Less than $50,000 | 0 (0.0%) | 0 (0.0%) |
| $50,000 to $99,999 | 0 (0.0%) | 0 (0.0%) |
| $100,000 to $299,999 | 32 (100.0%) | 0 (0.0%) |
| $300,000 to $499,999 | 0 (0.0%) | 14 (100.0%) |
| $500,000 to $749,999 | 0 (0.0%) | 0 (0.0%) |
| $750,000 to $999,999 | 0 (0.0%) | 0 (0.0%) |
| $1,000,000 or more | 0 (0.0%) | 0 (0.0%) |
| Total | 32 (100.0%) | 14 (100.0%) |
Household Income by Mortgage Status in Fort Lewis
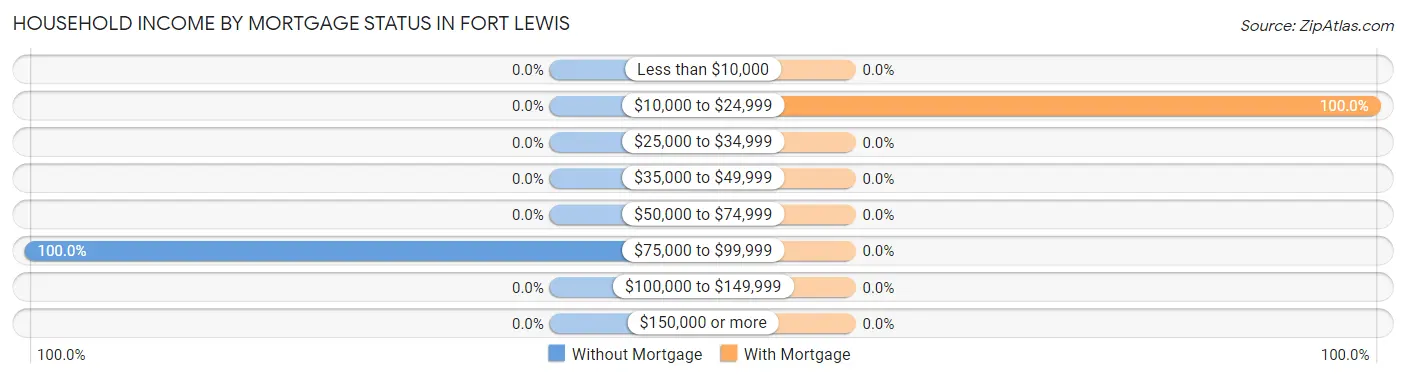
| Household Income | Without Mortgage | With Mortgage |
| Less than $10,000 | 0 (0.0%) | 0 (0.0%) |
| $10,000 to $24,999 | 0 (0.0%) | 14 (100.0%) |
| $25,000 to $34,999 | 0 (0.0%) | 0 (0.0%) |
| $35,000 to $49,999 | 0 (0.0%) | 0 (0.0%) |
| $50,000 to $74,999 | 0 (0.0%) | 0 (0.0%) |
| $75,000 to $99,999 | 32 (100.0%) | 0 (0.0%) |
| $100,000 to $149,999 | 0 (0.0%) | 0 (0.0%) |
| $150,000 or more | 0 (0.0%) | 0 (0.0%) |
| Total | 32 (100.0%) | 14 (100.0%) |
Property Value to Household Income Ratio in Fort Lewis
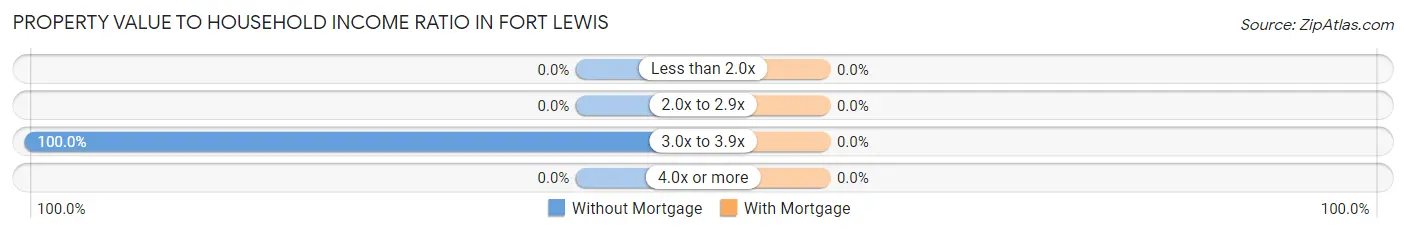
| Value-to-Income Ratio | Without Mortgage | With Mortgage |
| Less than 2.0x | 0 (0.0%) | 0 (0.0%) |
| 2.0x to 2.9x | 0 (0.0%) | 0 (0.0%) |
| 3.0x to 3.9x | 32 (100.0%) | 0 (0.0%) |
| 4.0x or more | 0 (0.0%) | 0 (0.0%) |
| Total | 32 (100.0%) | 14 (100.0%) |
Real Estate Taxes by Mortgage Status in Fort Lewis
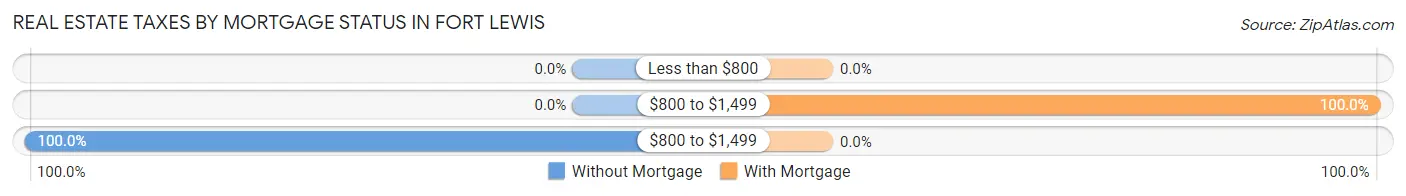
| Property Taxes | Without Mortgage | With Mortgage |
| Less than $800 | 0 (0.0%) | 0 (0.0%) |
| $800 to $1,499 | 0 (0.0%) | 14 (100.0%) |
| $800 to $1,499 | 32 (100.0%) | 0 (0.0%) |
| Total | 32 (100.0%) | 14 (100.0%) |
Health & Disability in Fort Lewis
Health Insurance Coverage by Age in Fort Lewis
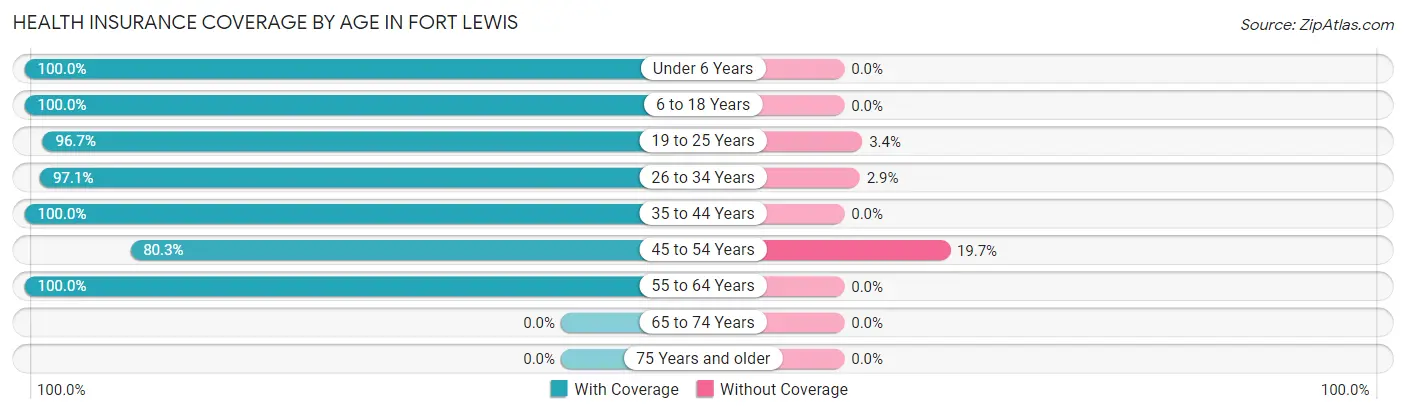
| Age Bracket | With Coverage | Without Coverage |
| Under 6 Years | 2,546 (100.0%) | 0 (0.0%) |
| 6 to 18 Years | 1,540 (100.0%) | 0 (0.0%) |
| 19 to 25 Years | 1,184 (96.7%) | 41 (3.4%) |
| 26 to 34 Years | 1,314 (97.1%) | 39 (2.9%) |
| 35 to 44 Years | 609 (100.0%) | 0 (0.0%) |
| 45 to 54 Years | 159 (80.3%) | 39 (19.7%) |
| 55 to 64 Years | 46 (100.0%) | 0 (0.0%) |
| 65 to 74 Years | 0 (0.0%) | 0 (0.0%) |
| 75 Years and older | 0 (0.0%) | 0 (0.0%) |
| Total | 7,398 (98.4%) | 119 (1.6%) |
Health Insurance Coverage by Citizenship Status in Fort Lewis
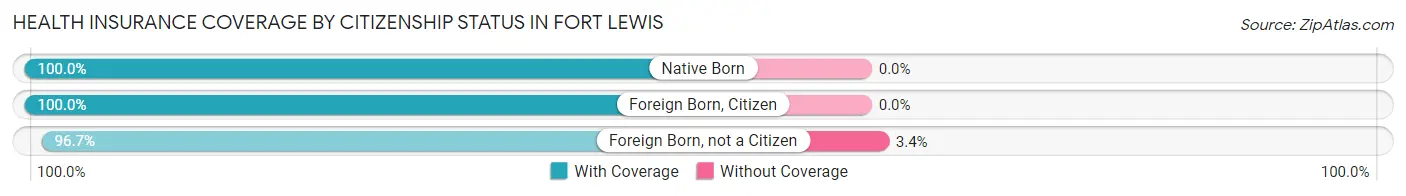
| Citizenship Status | With Coverage | Without Coverage |
| Native Born | 2,546 (100.0%) | 0 (0.0%) |
| Foreign Born, Citizen | 1,540 (100.0%) | 0 (0.0%) |
| Foreign Born, not a Citizen | 1,184 (96.7%) | 41 (3.4%) |
Health Insurance Coverage by Household Income in Fort Lewis
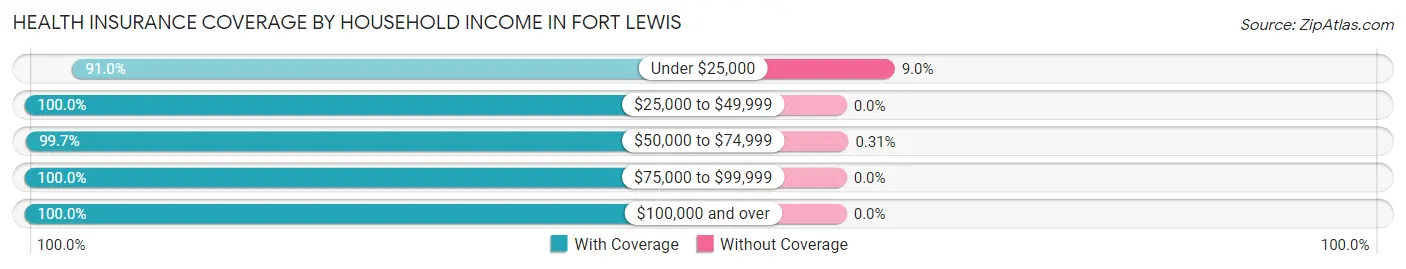
| Household Income | With Coverage | Without Coverage |
| Under $25,000 | 1,135 (91.0%) | 112 (9.0%) |
| $25,000 to $49,999 | 2,583 (100.0%) | 0 (0.0%) |
| $50,000 to $74,999 | 2,238 (99.7%) | 7 (0.3%) |
| $75,000 to $99,999 | 829 (100.0%) | 0 (0.0%) |
| $100,000 and over | 613 (100.0%) | 0 (0.0%) |
Public vs Private Health Insurance Coverage by Age in Fort Lewis
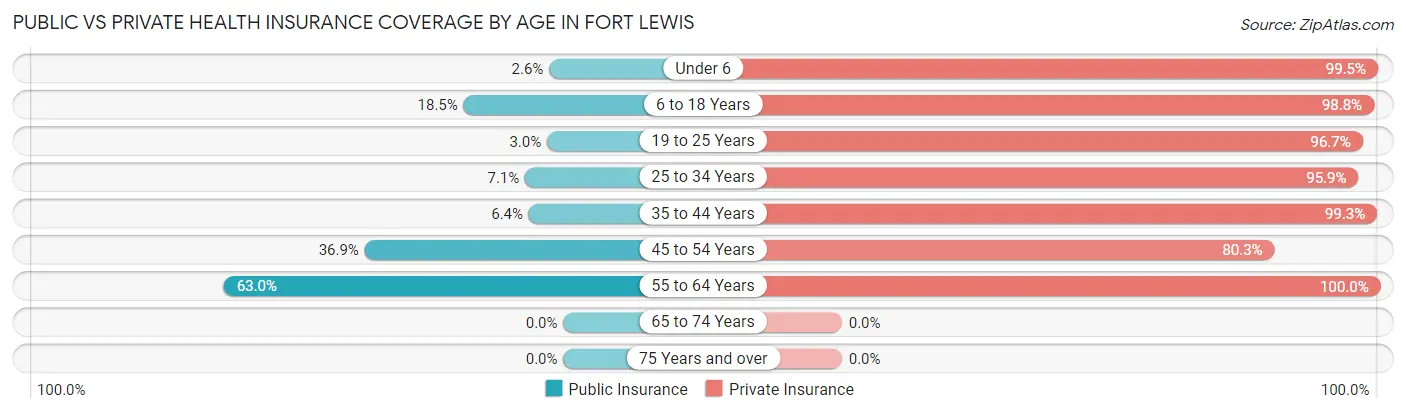
| Age Bracket | Public Insurance | Private Insurance |
| Under 6 | 67 (2.6%) | 2,533 (99.5%) |
| 6 to 18 Years | 285 (18.5%) | 1,521 (98.8%) |
| 19 to 25 Years | 37 (3.0%) | 1,184 (96.7%) |
| 25 to 34 Years | 96 (7.1%) | 1,297 (95.9%) |
| 35 to 44 Years | 39 (6.4%) | 605 (99.3%) |
| 45 to 54 Years | 73 (36.9%) | 159 (80.3%) |
| 55 to 64 Years | 29 (63.0%) | 46 (100.0%) |
| 65 to 74 Years | 0 (0.0%) | 0 (0.0%) |
| 75 Years and over | 0 (0.0%) | 0 (0.0%) |
| Total | 626 (8.3%) | 7,345 (97.7%) |
Disability Status by Sex by Age in Fort Lewis
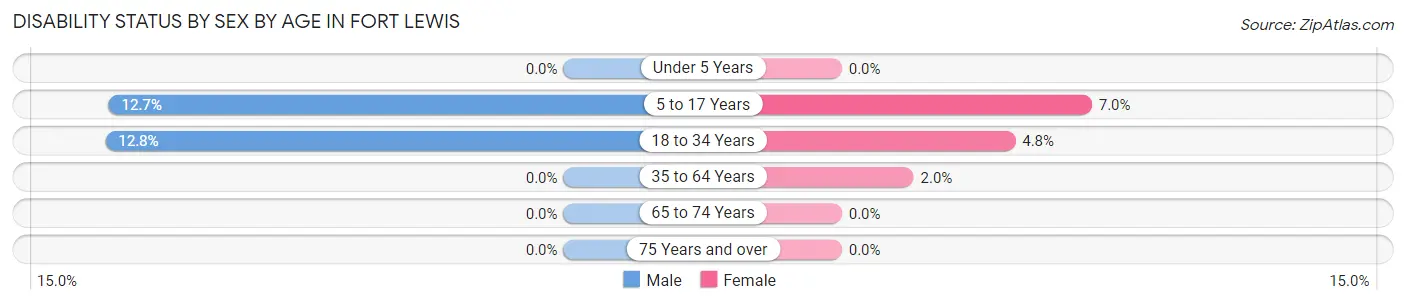
| Age Bracket | Male | Female |
| Under 5 Years | 0 (0.0%) | 0 (0.0%) |
| 5 to 17 Years | 100 (12.7%) | 54 (7.0%) |
| 18 to 34 Years | 45 (12.8%) | 114 (4.8%) |
| 35 to 64 Years | 0 (0.0%) | 11 (2.0%) |
| 65 to 74 Years | 0 (0.0%) | 0 (0.0%) |
| 75 Years and over | 0 (0.0%) | 0 (0.0%) |
Disability Class by Sex by Age in Fort Lewis
Disability Class: Hearing Difficulty
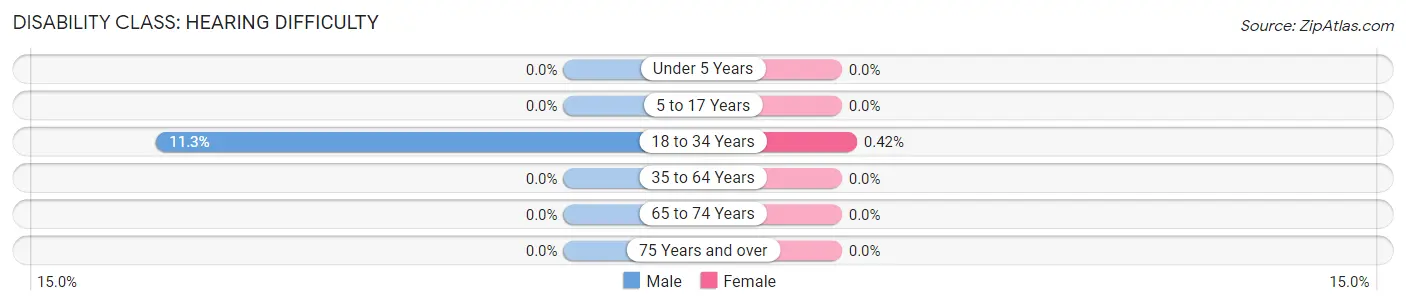
| Age Bracket | Male | Female |
| Under 5 Years | 0 (0.0%) | 0 (0.0%) |
| 5 to 17 Years | 0 (0.0%) | 0 (0.0%) |
| 18 to 34 Years | 40 (11.3%) | 10 (0.4%) |
| 35 to 64 Years | 0 (0.0%) | 0 (0.0%) |
| 65 to 74 Years | 0 (0.0%) | 0 (0.0%) |
| 75 Years and over | 0 (0.0%) | 0 (0.0%) |
Disability Class: Vision Difficulty
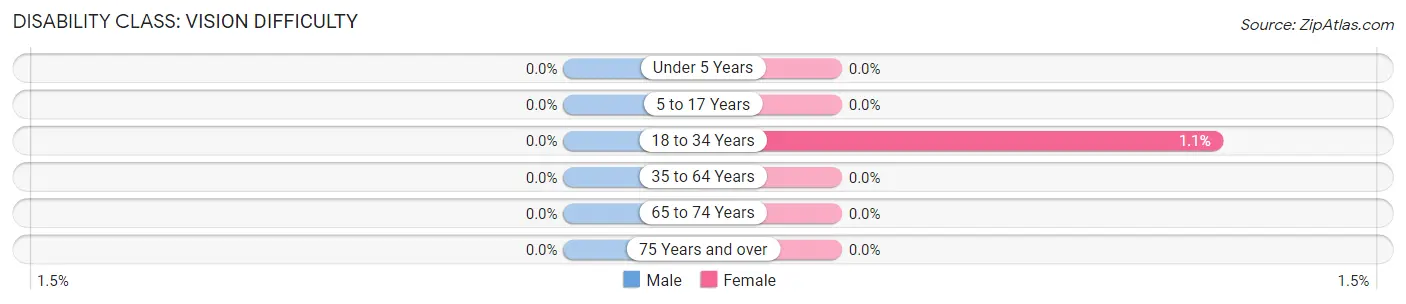
| Age Bracket | Male | Female |
| Under 5 Years | 0 (0.0%) | 0 (0.0%) |
| 5 to 17 Years | 0 (0.0%) | 0 (0.0%) |
| 18 to 34 Years | 0 (0.0%) | 25 (1.1%) |
| 35 to 64 Years | 0 (0.0%) | 0 (0.0%) |
| 65 to 74 Years | 0 (0.0%) | 0 (0.0%) |
| 75 Years and over | 0 (0.0%) | 0 (0.0%) |
Disability Class: Cognitive Difficulty
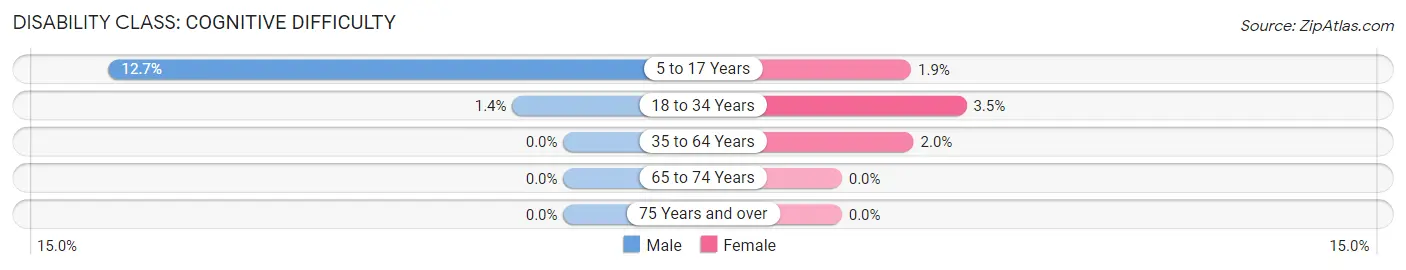
| Age Bracket | Male | Female |
| 5 to 17 Years | 100 (12.7%) | 15 (1.9%) |
| 18 to 34 Years | 5 (1.4%) | 82 (3.5%) |
| 35 to 64 Years | 0 (0.0%) | 11 (2.0%) |
| 65 to 74 Years | 0 (0.0%) | 0 (0.0%) |
| 75 Years and over | 0 (0.0%) | 0 (0.0%) |
Disability Class: Ambulatory Difficulty
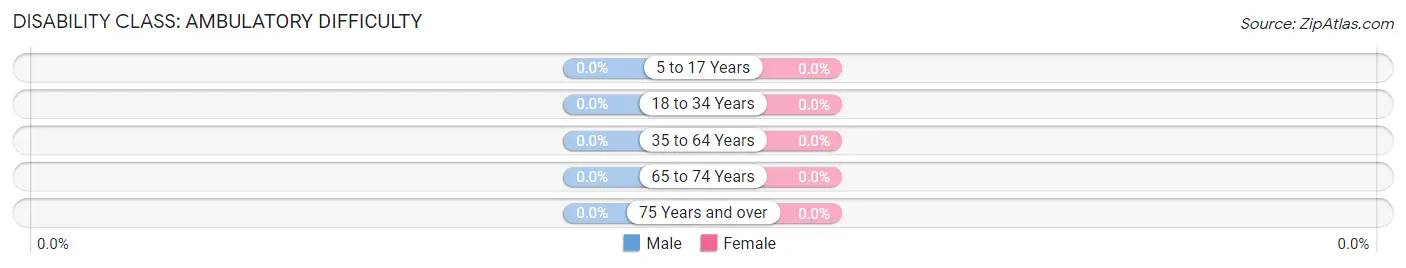
| Age Bracket | Male | Female |
| 5 to 17 Years | 0 (0.0%) | 0 (0.0%) |
| 18 to 34 Years | 0 (0.0%) | 0 (0.0%) |
| 35 to 64 Years | 0 (0.0%) | 0 (0.0%) |
| 65 to 74 Years | 0 (0.0%) | 0 (0.0%) |
| 75 Years and over | 0 (0.0%) | 0 (0.0%) |
Disability Class: Self-Care Difficulty
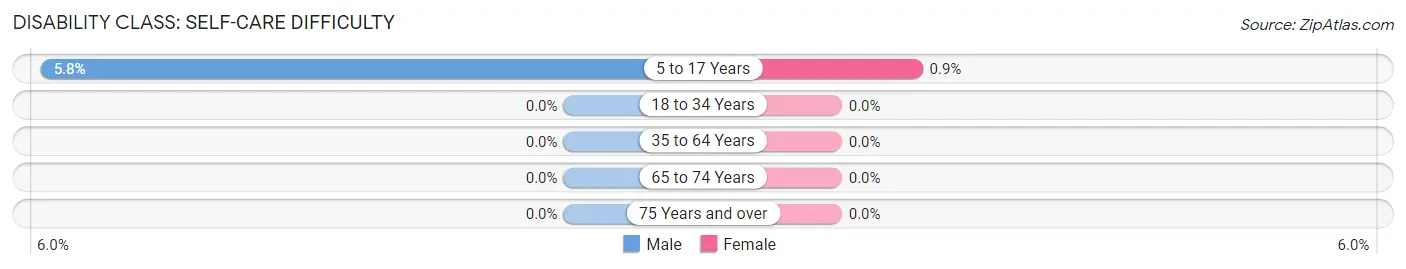
| Age Bracket | Male | Female |
| 5 to 17 Years | 46 (5.8%) | 7 (0.9%) |
| 18 to 34 Years | 0 (0.0%) | 0 (0.0%) |
| 35 to 64 Years | 0 (0.0%) | 0 (0.0%) |
| 65 to 74 Years | 0 (0.0%) | 0 (0.0%) |
| 75 Years and over | 0 (0.0%) | 0 (0.0%) |
Technology Access in Fort Lewis
Computing Device Access in Fort Lewis
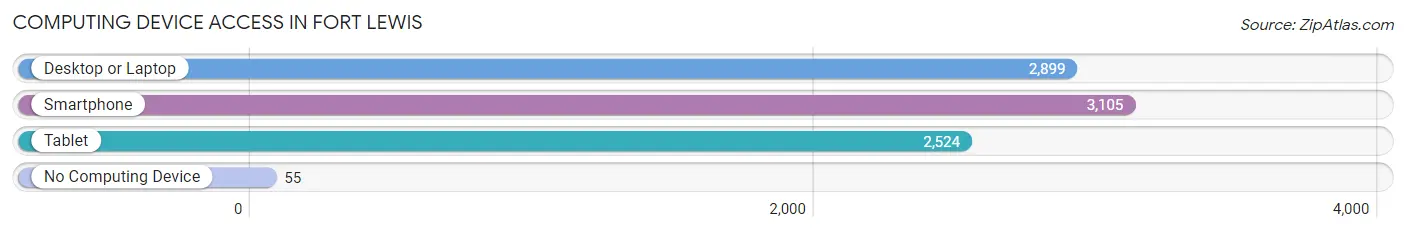
| Device Type | # Households | % Households |
| Desktop or Laptop | 2,899 | 90.2% |
| Smartphone | 3,105 | 96.6% |
| Tablet | 2,524 | 78.5% |
| No Computing Device | 55 | 1.7% |
| Total | 3,214 | 100.0% |
Internet Access in Fort Lewis
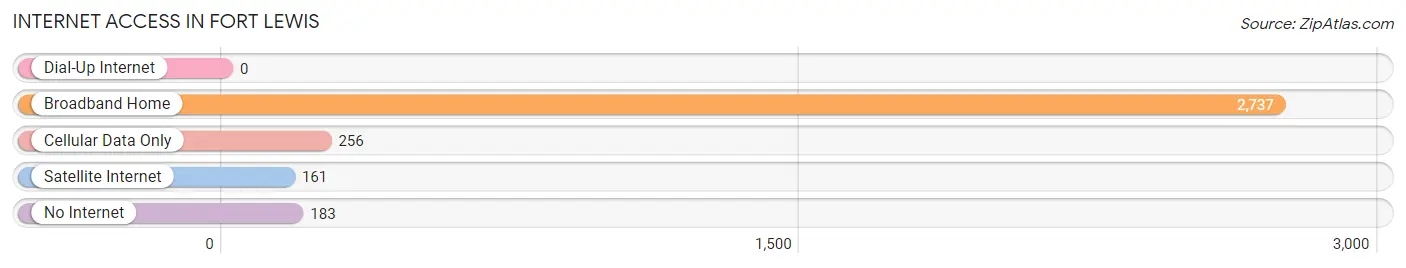
| Internet Type | # Households | % Households |
| Dial-Up Internet | 0 | 0.0% |
| Broadband Home | 2,737 | 85.2% |
| Cellular Data Only | 256 | 8.0% |
| Satellite Internet | 161 | 5.0% |
| No Internet | 183 | 5.7% |
| Total | 3,214 | 100.0% |
Fort Lewis Summary
Lewis, Washington is a small city located in Pierce County, Washington, United States. It is located approximately 25 miles south of Tacoma and 40 miles north of Seattle. The city is named after Fort Lewis, a United States Army post that was established in 1917 and is now part of Joint Base Lewis-McChord. The population of Fort Lewis was 8,845 at the 2010 census.
History
The area that is now Fort Lewis was originally inhabited by the Nisqually and Puyallup tribes. The first European settlers arrived in the area in the mid-1800s, and the area was officially incorporated as a city in 1951.
The area was originally known as Camp Lewis, and was established as a military post in 1917. The post was named after Meriwether Lewis, the leader of the Lewis and Clark Expedition. During World War II, the post was expanded and renamed Fort Lewis.
In the 1950s, the post was used as a training center for the Army's Airborne and Special Forces units. In the 1960s, the post was used as a staging area for troops being sent to Vietnam.
In the 1970s, the post was used as a training center for the Army's mechanized forces. In the 1980s, the post was used as a training center for the Army's light infantry forces.
In the 1990s, the post was used as a training center for the Army's air assault forces. In the 2000s, the post was used as a training center for the Army's Stryker forces.
In 2010 the post was merged with nearby McChord Air Force Base to form Joint Base Lewis McChord
Geography
Fort Lewis is located at 47°09'N 122°35'W (47.15, -122.58). The city has a total area of 8.3 square miles, of which 8.2 square miles is land and 0.1 square miles is water.
The city is located in the Puget Sound lowlands, and is surrounded by forests and wetlands. The city is located near the Nisqually River, and is home to several lakes, including Lake Steilacoom, Lake Tapps, and Lake Youngs.
Economy
The economy of Fort Lewis is largely driven by the military presence at Joint Base Lewis-McChord. The base is home to more than 40,000 military personnel and civilian employees, and is the largest military installation in the Pacific Northwest.
The base is home to several major commands, including the I Corps, the 62nd Airlift Wing, the 7th Infantry Division, and the 446th Airlift Wing. The base also houses several major units, including the 1st Special Forces Group, the 2nd Stryker Brigade Combat Team, and the 3rd Brigade, 2nd Infantry Division.
The base is also home to several major defense contractors, including Boeing, Lockheed Martin, and Raytheon.
Demographics
As of the 2010 census, there were 8,845 people, 2,945 households, and 2,072 families residing in the city. The population density was 1,072.3 people per square mile. There were 3,095 housing units at an average density of 375.7 per square mile.
The racial makeup of the city was 68.2% White, 16.2% African American, 0.7% Native American, 5.2% Asian, 0.2% Pacific Islander, 4.3% from other races, and 5.2% from two or more races. Hispanic or Latino of any race were 10.2% of the population.
There were 2,945 households, out of which 33.2% had children under the age of 18 living with them, 51.2% were married couples living together, 11.7% had a female householder with no husband present, and 32.2% were non-families. 25.2% of all households were made up of individuals, and 5.2% had someone living alone who was 65 years of age or older. The average household size was 2.63 and the average family size was 3.17.
In the city, the population was spread out, with 25.7% under the age of 18, 10.2% from 18 to 24, 33.2% from 25 to 44, 22.2% from 45 to 64, and 8.7% who were 65 years of age or older. The median age was 34 years. For every 100 females, there were 106.2 males. For every 100 females age 18 and over, there were 106.7 males.
The median income for a household in the city was $50,945, and the median income for a family was $58,958. Males had a median income of $41,945 versus $30,958 for females. The per capita income for the city was $22,945. About 5.2% of families and 7.2% of the population were below the poverty line, including 8.7% of those under age 18 and 4.2% of those age 65 or over.
Common Questions
What is Per Capita Income in Fort Lewis?
Per Capita income in Fort Lewis is $21,202.
What is the Median Family Income in Fort Lewis?
Median Family Income in Fort Lewis is $51,716.
What is the Median Household income in Fort Lewis?
Median Household Income in Fort Lewis is $51,679.
What is Income or Wage Gap in Fort Lewis?
Income or Wage Gap in Fort Lewis is 16.1%.
Women in Fort Lewis earn 83.9 cents for every dollar earned by a man.
What is Inequality or Gini Index in Fort Lewis?
Inequality or Gini Index in Fort Lewis is 0.34.
What is the Total Population of Fort Lewis?
Total Population of Fort Lewis is 13,440.
What is the Total Male Population of Fort Lewis?
Total Male Population of Fort Lewis is 7,948.
What is the Total Female Population of Fort Lewis?
Total Female Population of Fort Lewis is 5,492.
What is the Ratio of Males per 100 Females in Fort Lewis?
There are 144.72 Males per 100 Females in Fort Lewis.
What is the Ratio of Females per 100 Males in Fort Lewis?
There are 69.10 Females per 100 Males in Fort Lewis.
What is the Median Population Age in Fort Lewis?
Median Population Age in Fort Lewis is 22.8 Years.
What is the Average Family Size in Fort Lewis
Average Family Size in Fort Lewis is 3.3 People.
What is the Average Household Size in Fort Lewis
Average Household Size in Fort Lewis is 3.1 People.
How Large is the Labor Force in Fort Lewis?
There are 7,650 People in the Labor Forcein in Fort Lewis.
What is the Percentage of People in the Labor Force in Fort Lewis?
79.7% of People are in the Labor Force in Fort Lewis.
What is the Unemployment Rate in Fort Lewis?
Unemployment Rate in Fort Lewis is 2.6%.